Ofsted introduced its new inspection framework in November last year. Since then, the relationship between the achievement grade and disadvantage has been subject to scrutiny.
In response, Ofsted published some analysis showing the relationship between the achievement grade and the attainment of disadvantaged pupils. This showed that the two were positively correlated. Grades increased with attainment.
Case closed?
I’m not so sure.
Data
We’re using data on Ofsted inspections up to the end of April 2026, which we’ve matched to Key Stage 4 data for 2024/25 (and 2023/24) in the National Pupil Database (NPD). Note that we only have access at present to unamended data for 2024/25 (whereas Ofsted used final data in their analysis).
Ofsted’s analysis
In Ofsted’s analysis, they present the average unweighted school-level Attainment 8 score. This ignores the number of disadvantaged pupils at each school.
We replicate their analysis below, but also add on the weighted average score which takes into account pupil numbers.
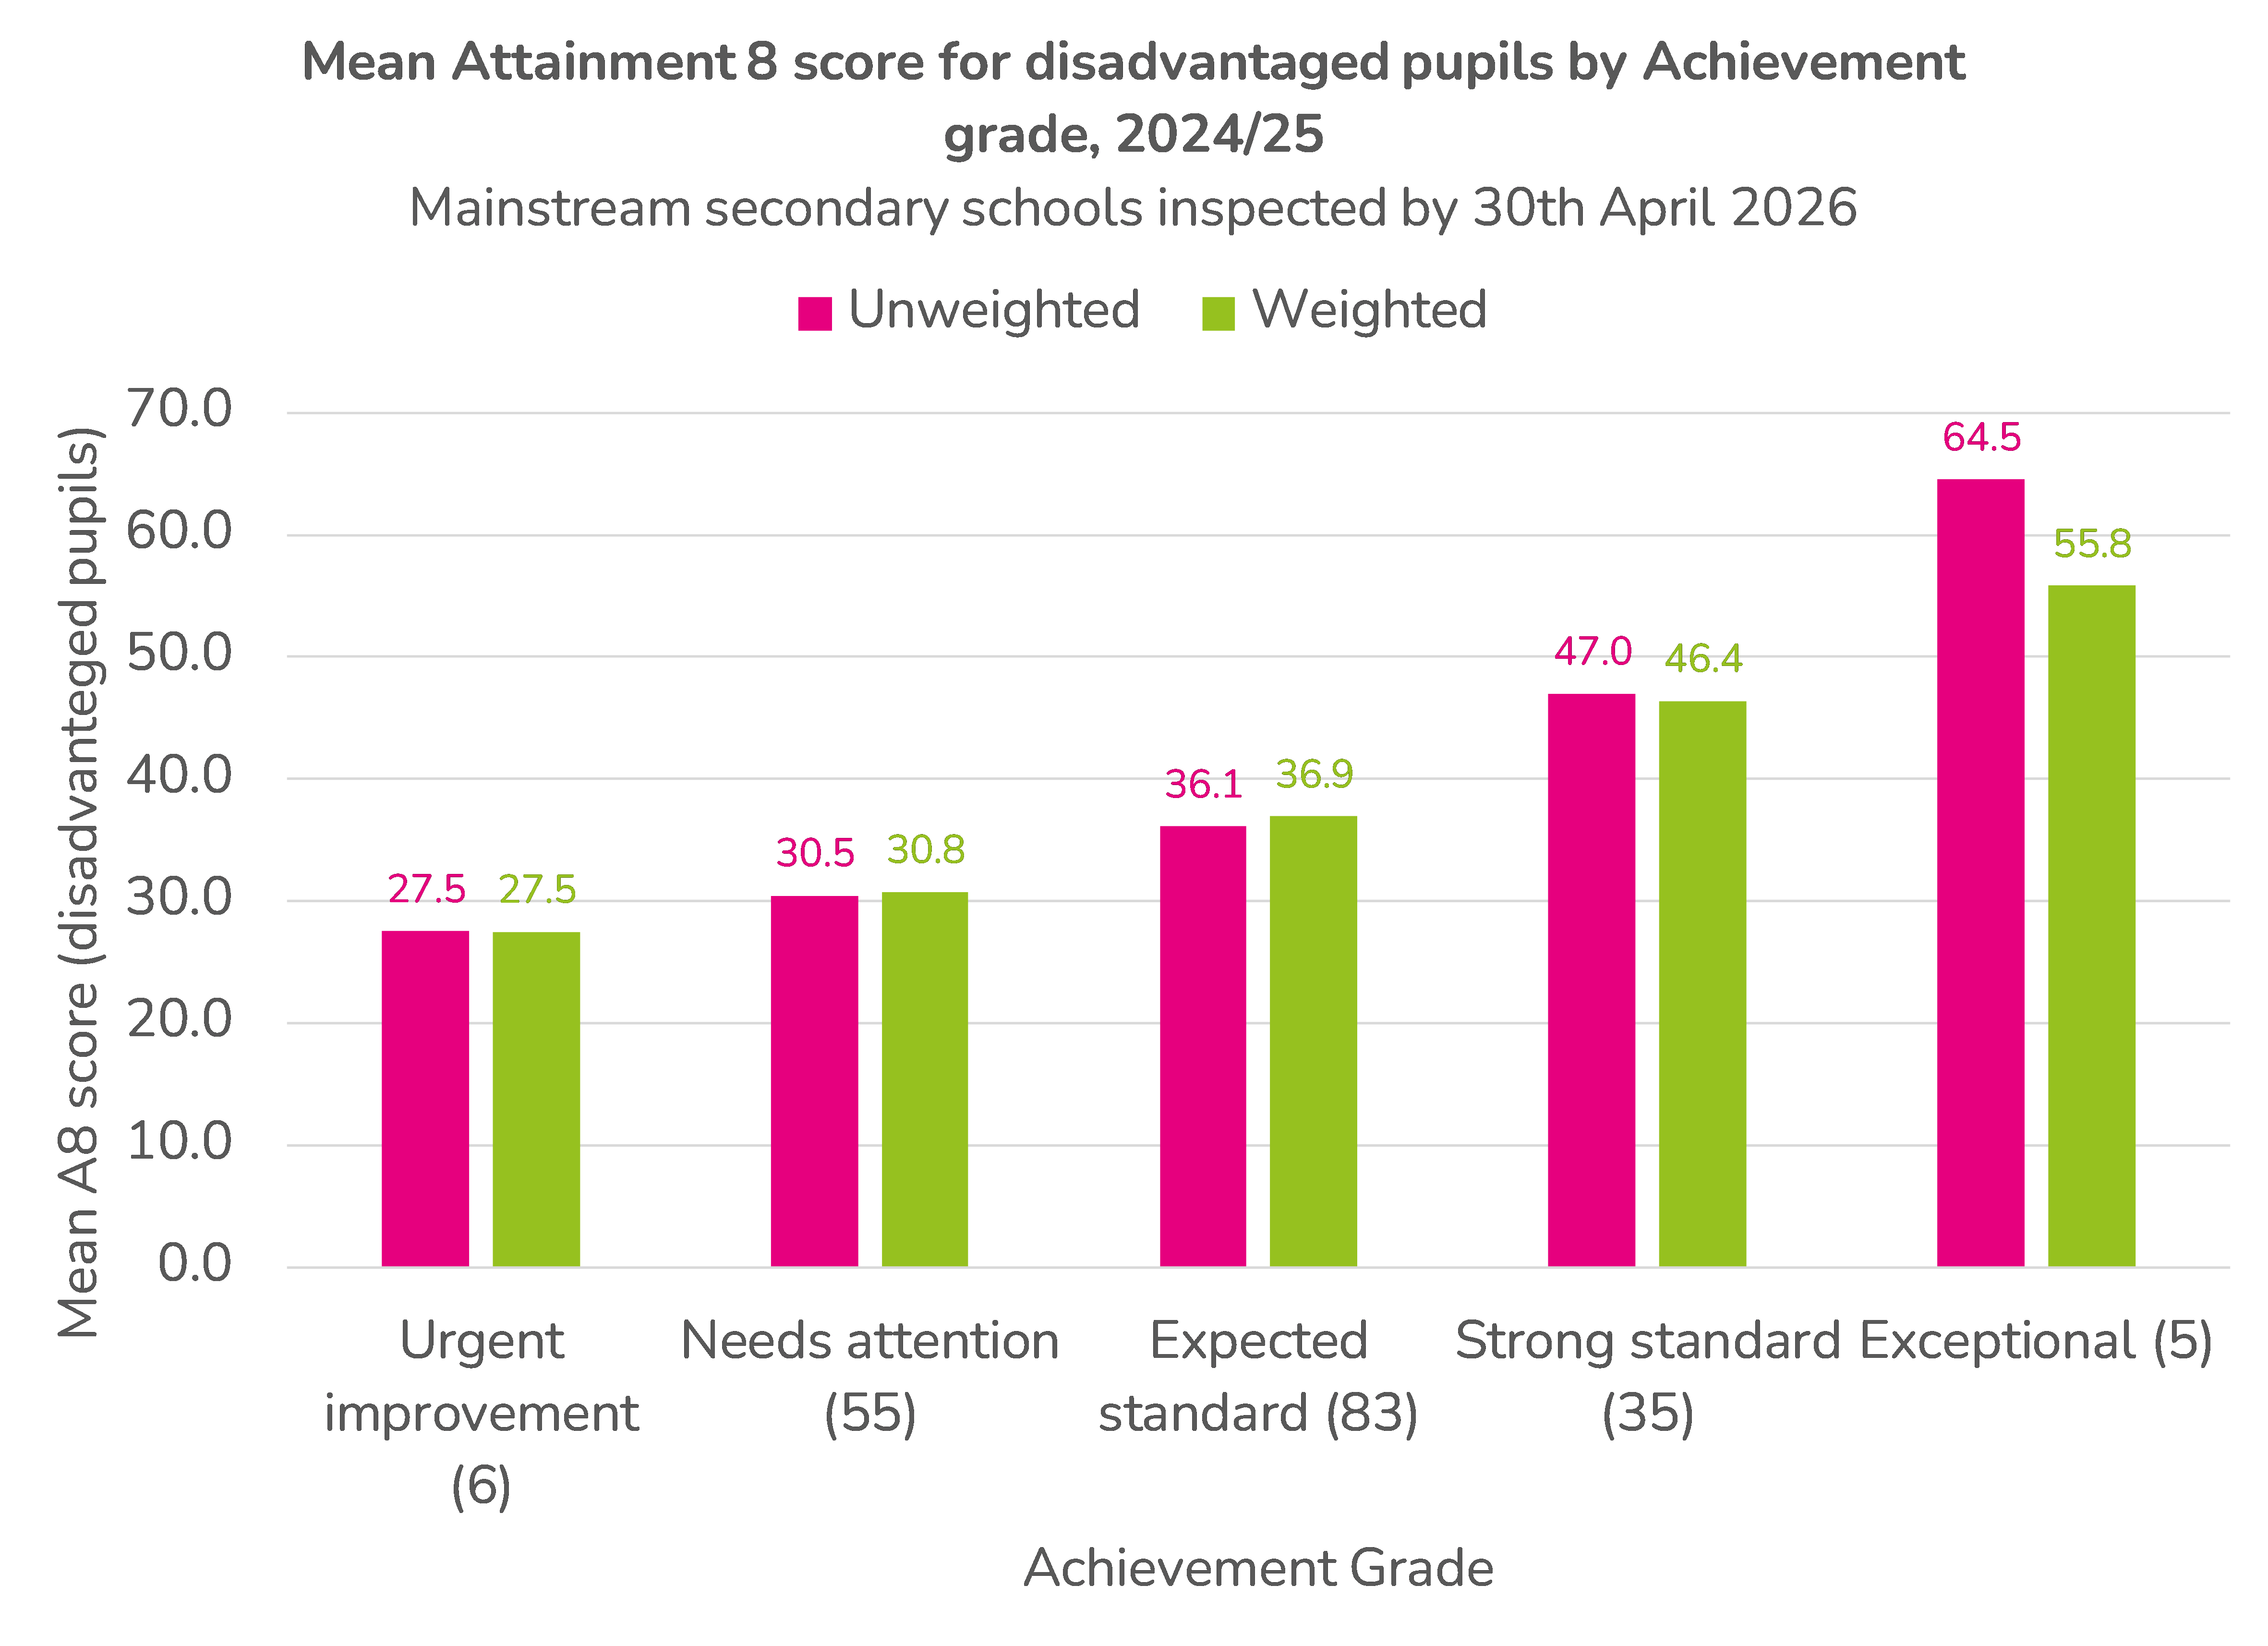
The question of weighting matters for the “Exceptional” group. Unweighted the average A8 score was 64.5 but after weighting falls to 55.6.
We can see how this comes about if we inspect the data for the five schools judged exceptional.

The unweighted average for the group is boosted by the inclusion of the two grammar schools, both of which have relatively few disadvantaged pupils in their cohort.
Due to the Covid-19 pandemic, the 2024/25 Year 11 cohort whose Attainment 8 scores feature in the above chart were not tested at Key Stage 2 when in Year 6.
However, we can look at the Key Stage 2 results of the previous cohort that completed Key Stage 4 in 2023/24. In the following chart we have centred the vertical axis around the mean KS2 score for disadvantaged pupils of 102.
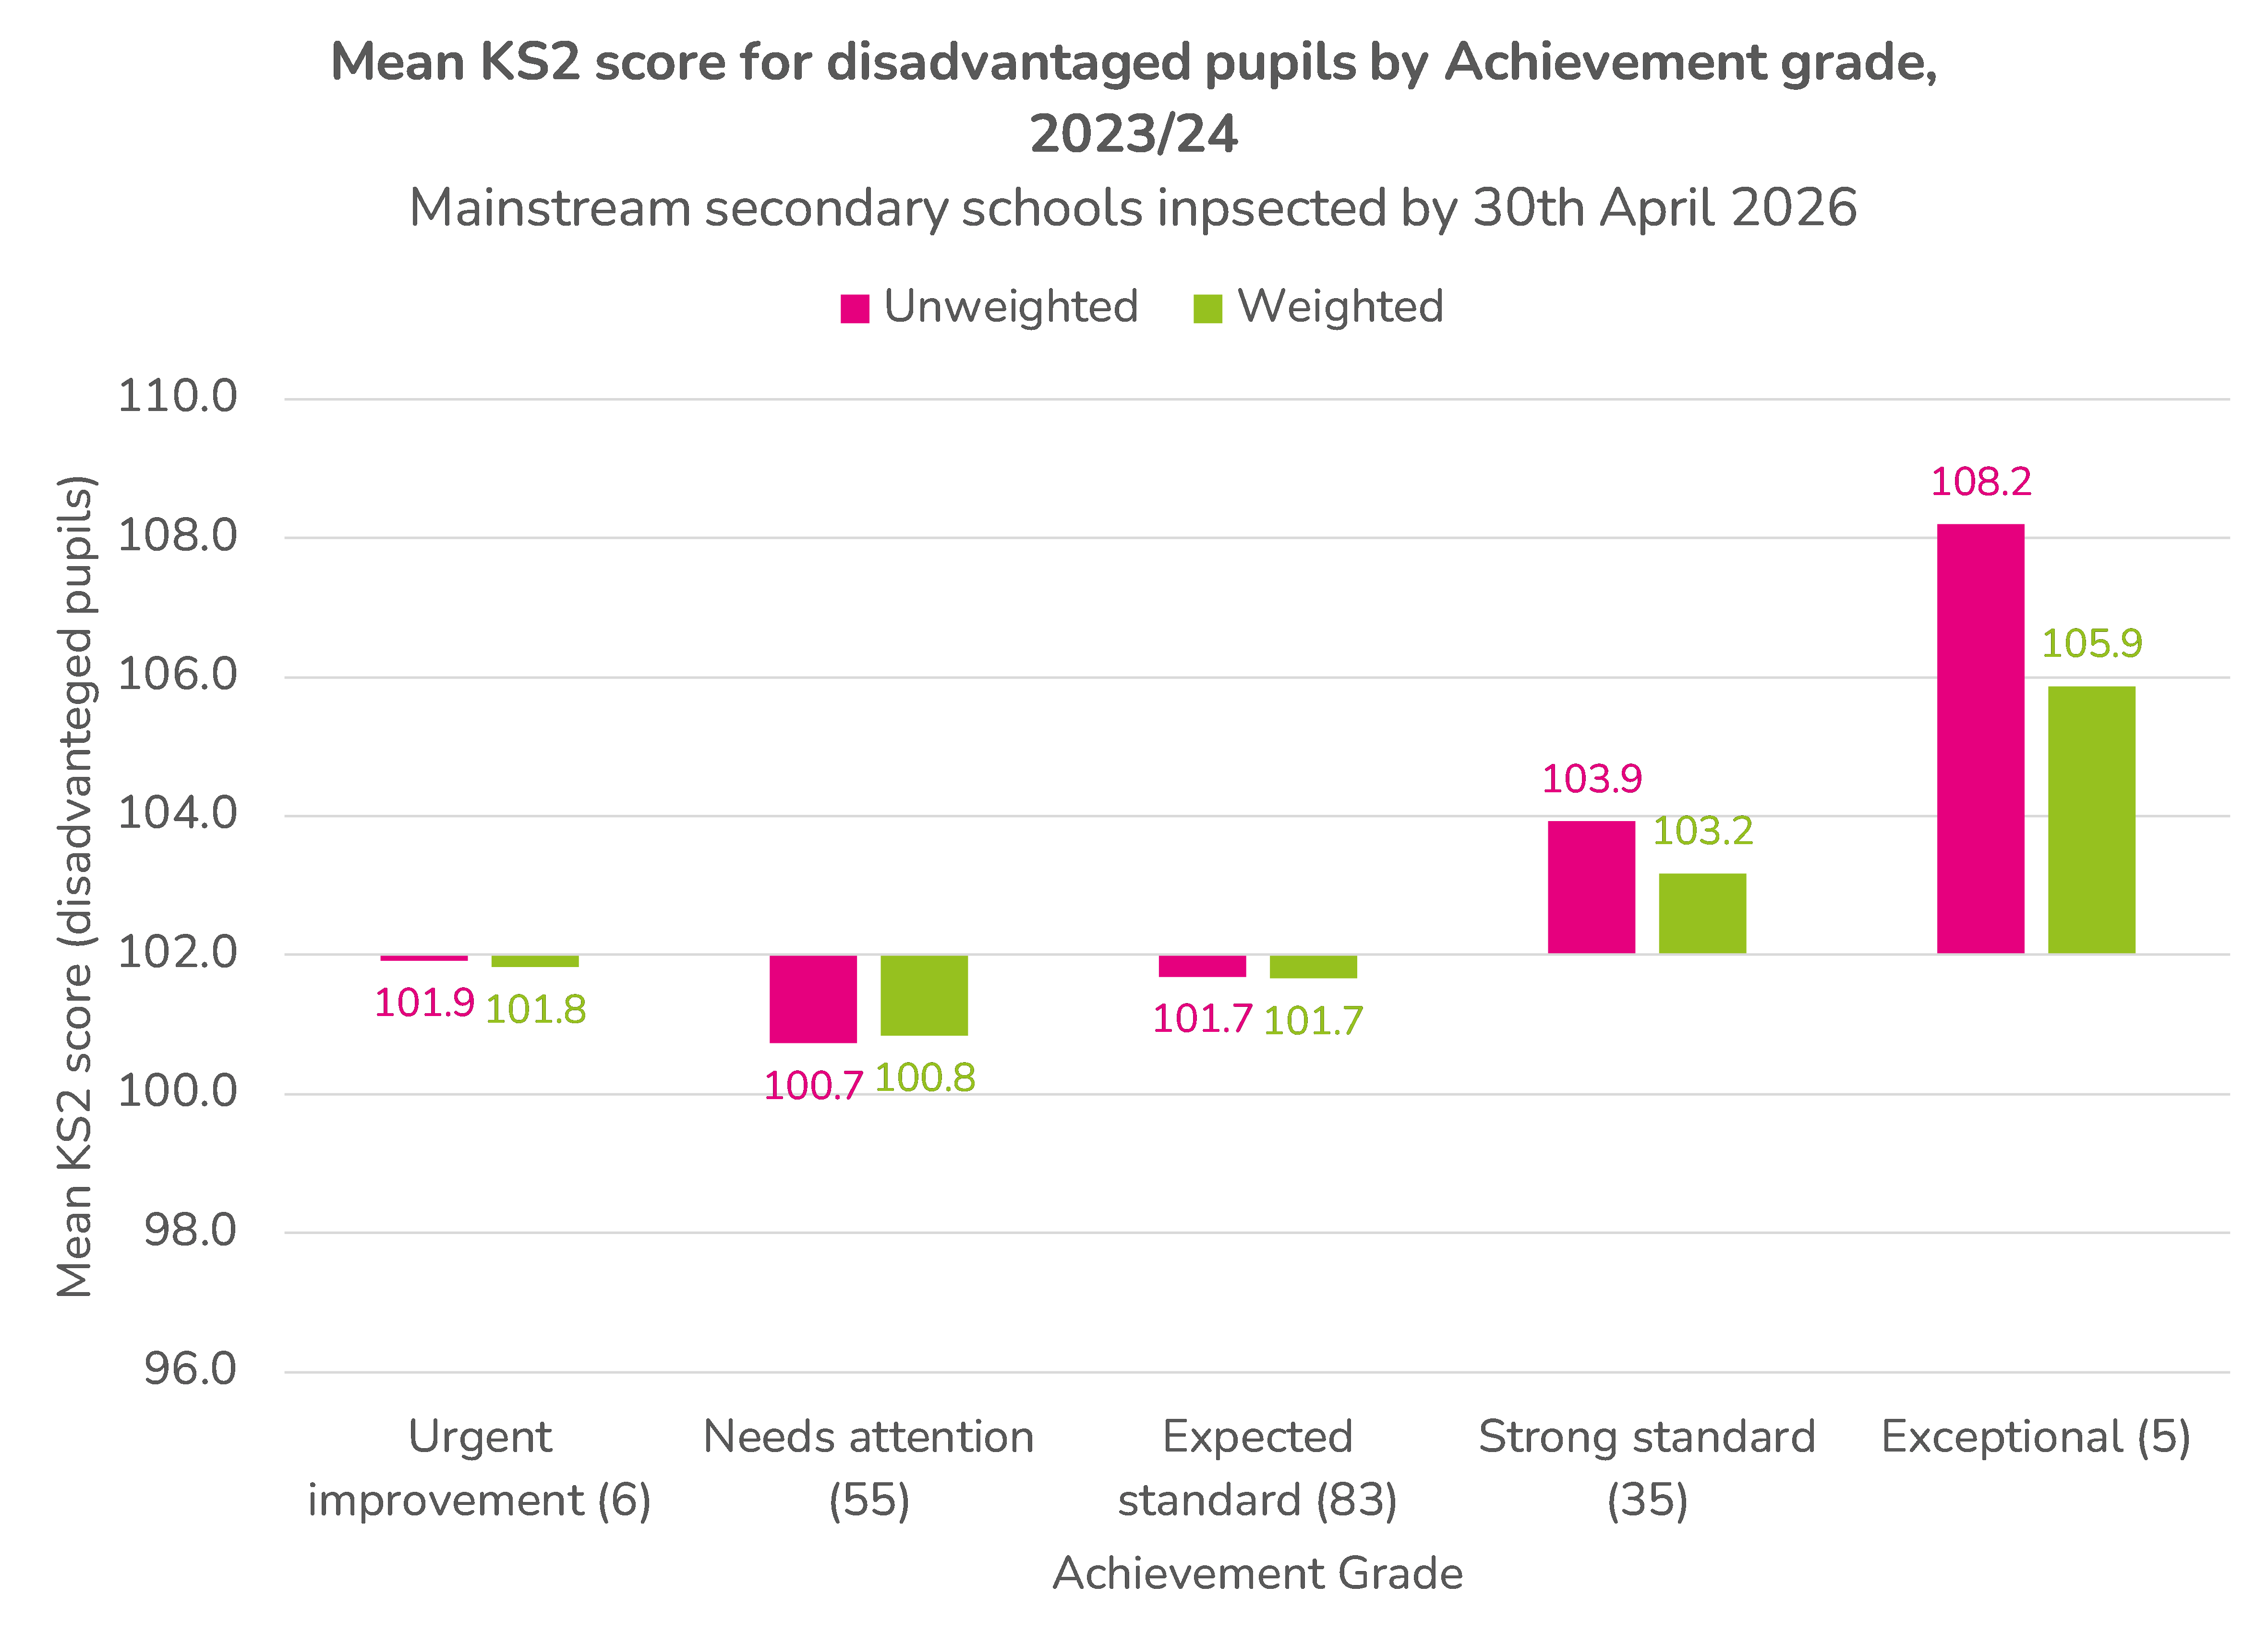
Here we see that the schools judged “strong standard” and “exceptional” tended to have the advantage of a higher attaining intake. There were already differences in attainment between pupils in the inspected schools before the first day of secondary school.
Variation within the disadvantaged group
Ofsted’s analysis considers disadvantaged group as a single, homogenous group.
But we (and many others) have shown over the years variation in attainment within the group with respect not only to prior attainment but to other characteristics such as ethnic background and persistence of disadvantage.
By way of example, the chart below shows the mean Attainment 8 scores of disadvantaged pupils broken down by ethnic background. The national average for all disadvantaged groups in 2024/25 was 36.9.
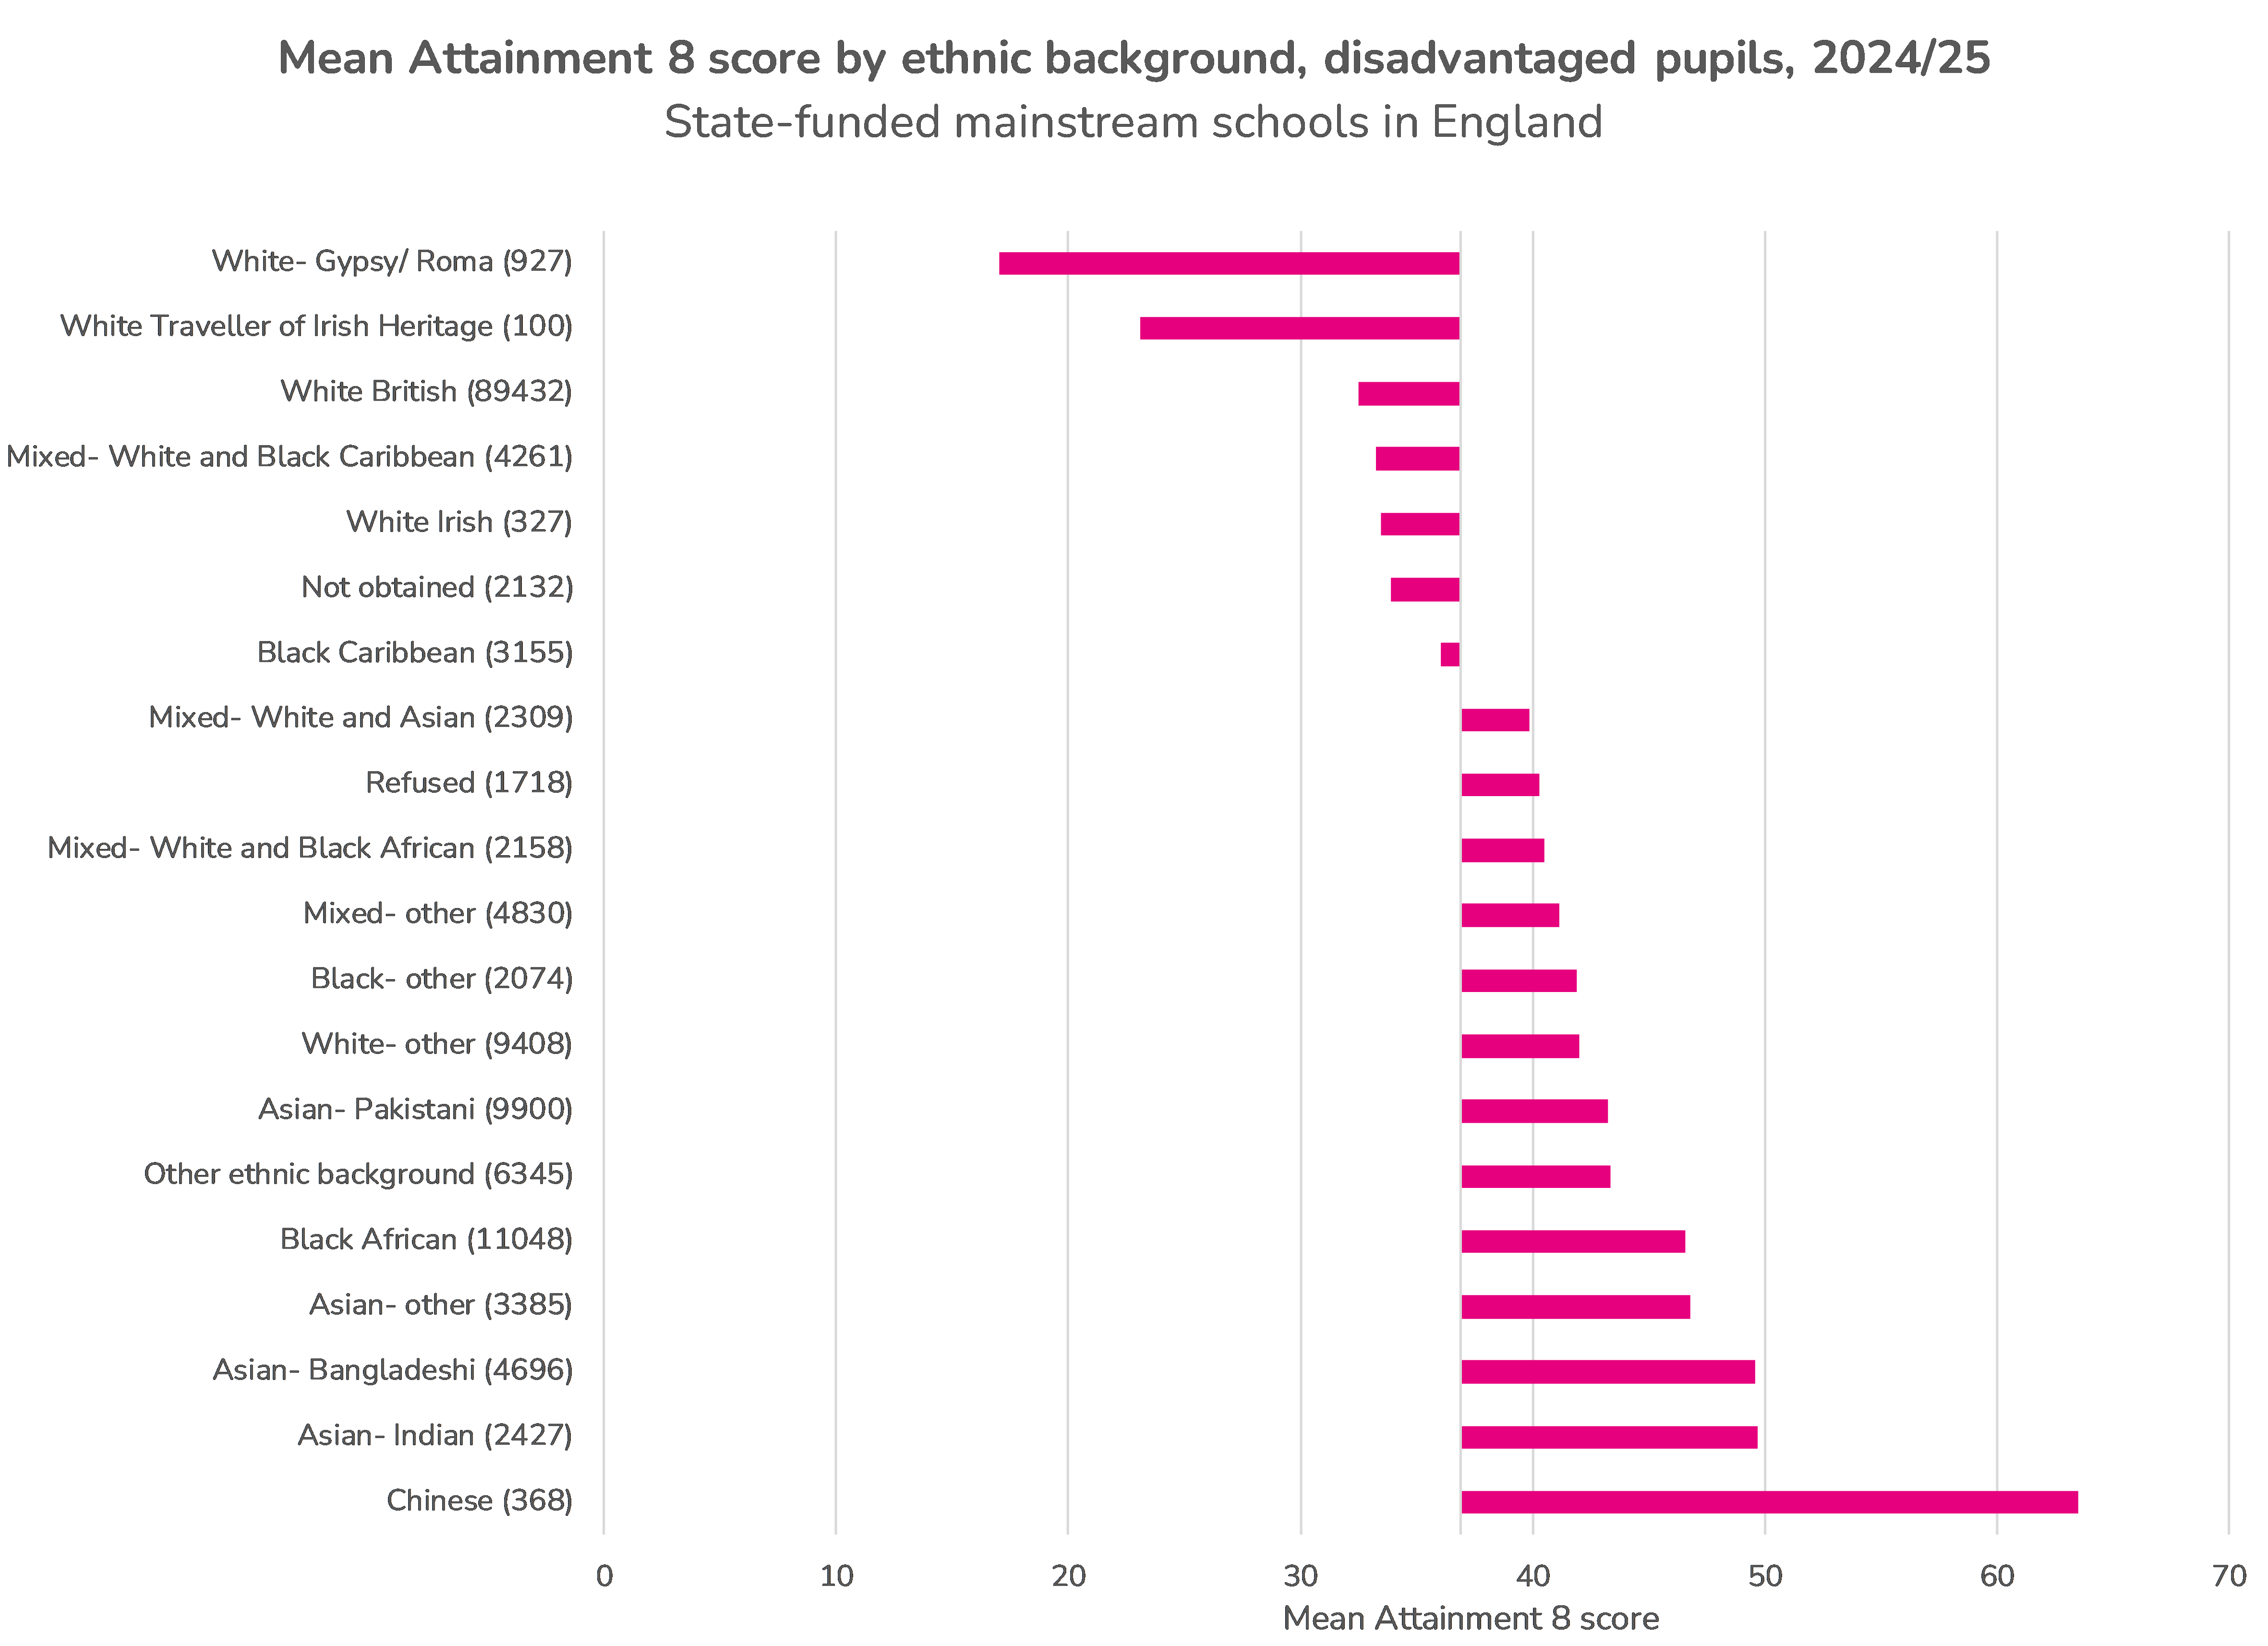
As we have written previously, attainment is lower among pupils from White British, White Irish, White Traveller of Irish Heritage, White Gypsy/ Roma, Black Caribbean and Mixed White/ Black Caribbean backgrounds. We usually label this set as the high impact disadvantaged group.
Therefore, schools where a greater share of the disadvantaged cohort is from other (low impact) groups will tend to have higher Attainment 8 scores for the disadvantaged group.
Going back to our inspection data, we show the relationship between achievement grade and the composition of the Year 11 cohort based on ethnicity and disadvantage using our broad high impact/ low impact categorisation of ethnic groups.
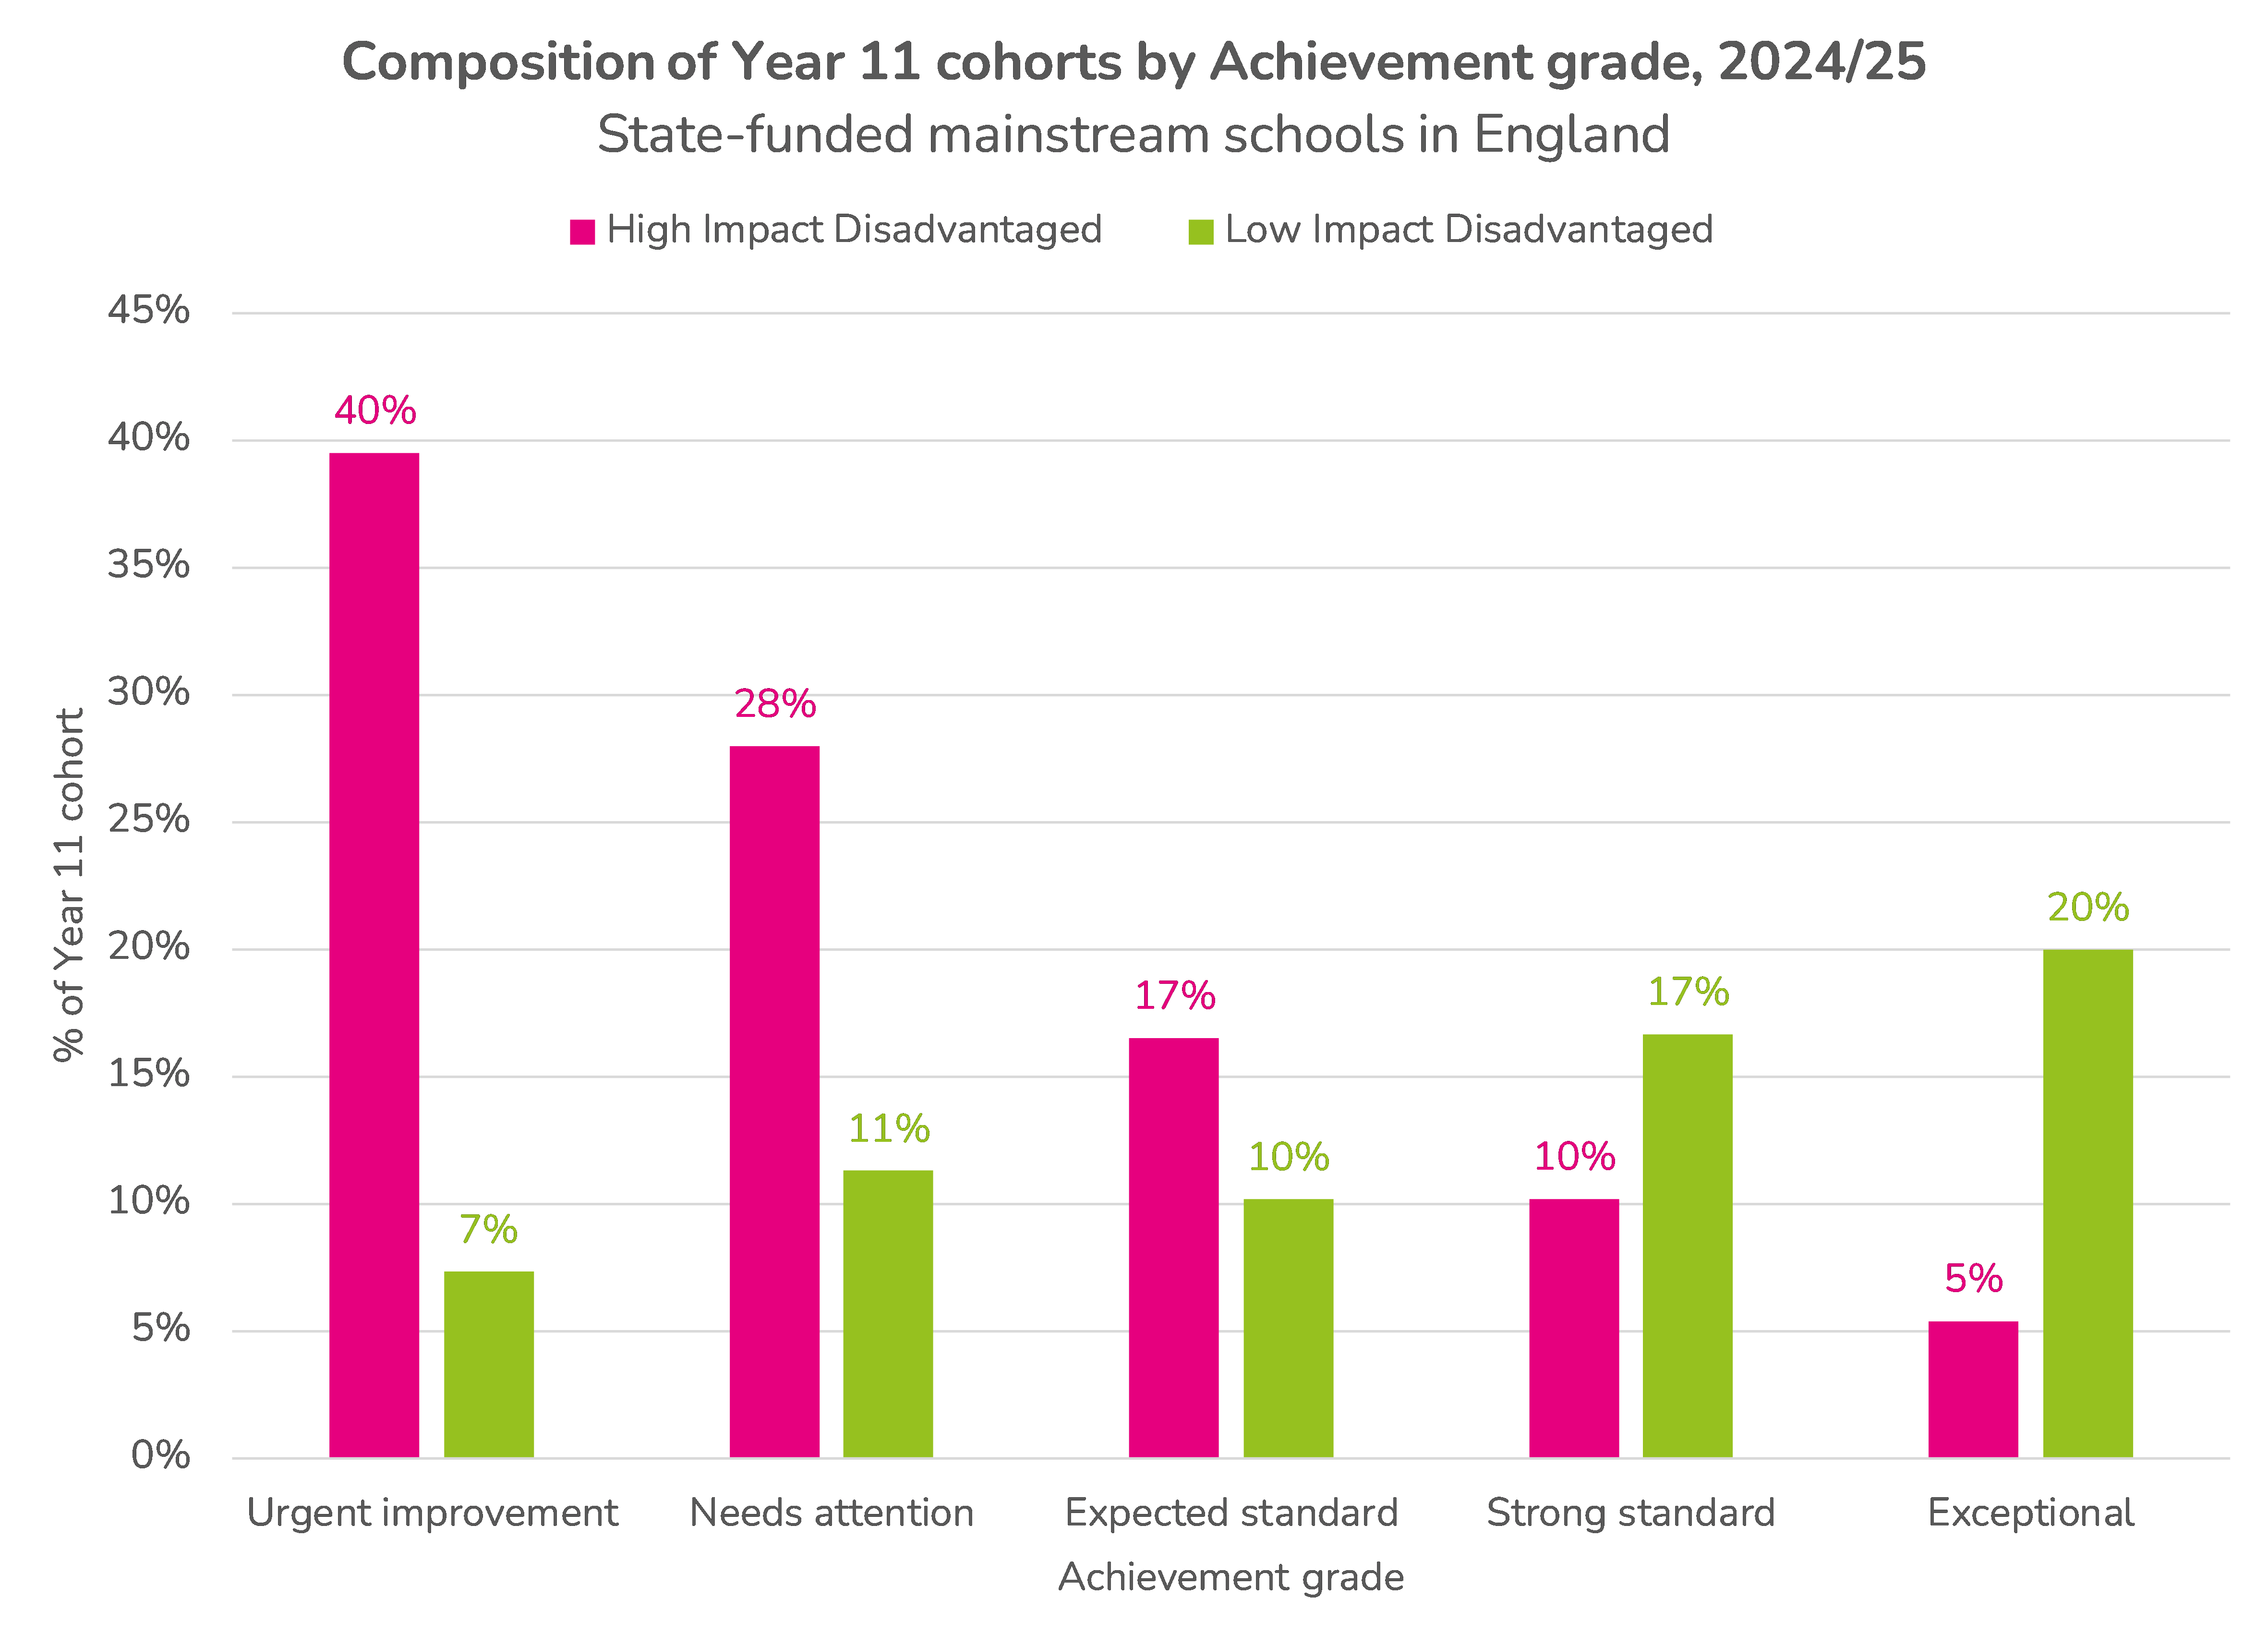
We can see that those judged “strong standard” and “exceptional” tended to have lower proportions from high impact disadvantaged groups among their cohorts. Moreover, disadvantaged pupils at these schools were more likely to come from low impact than high impact ethnic background, the opposite of the picture for schools with lower grades for achievement.
Schools with disproportionate numbers of White disadvantaged students
The Inquiry into white working class educational outcomes is due to publish its findings next week.
Whether this will say anything about inspection remains to be seen. But what is clear is that schools with large proportions of White disadvantaged students have a much higher probability of being judged ‘needs attention’ or ‘urgent improvement’ for achievement.
In the chart below we allocate all secondary schools in England to a quintile based on the percentage of White disadvantaged students they have on roll in Years 7 to 11. We do not include pupils from a “White-other” background. The chart shows inspection outcomes for those inspected under the new framework.
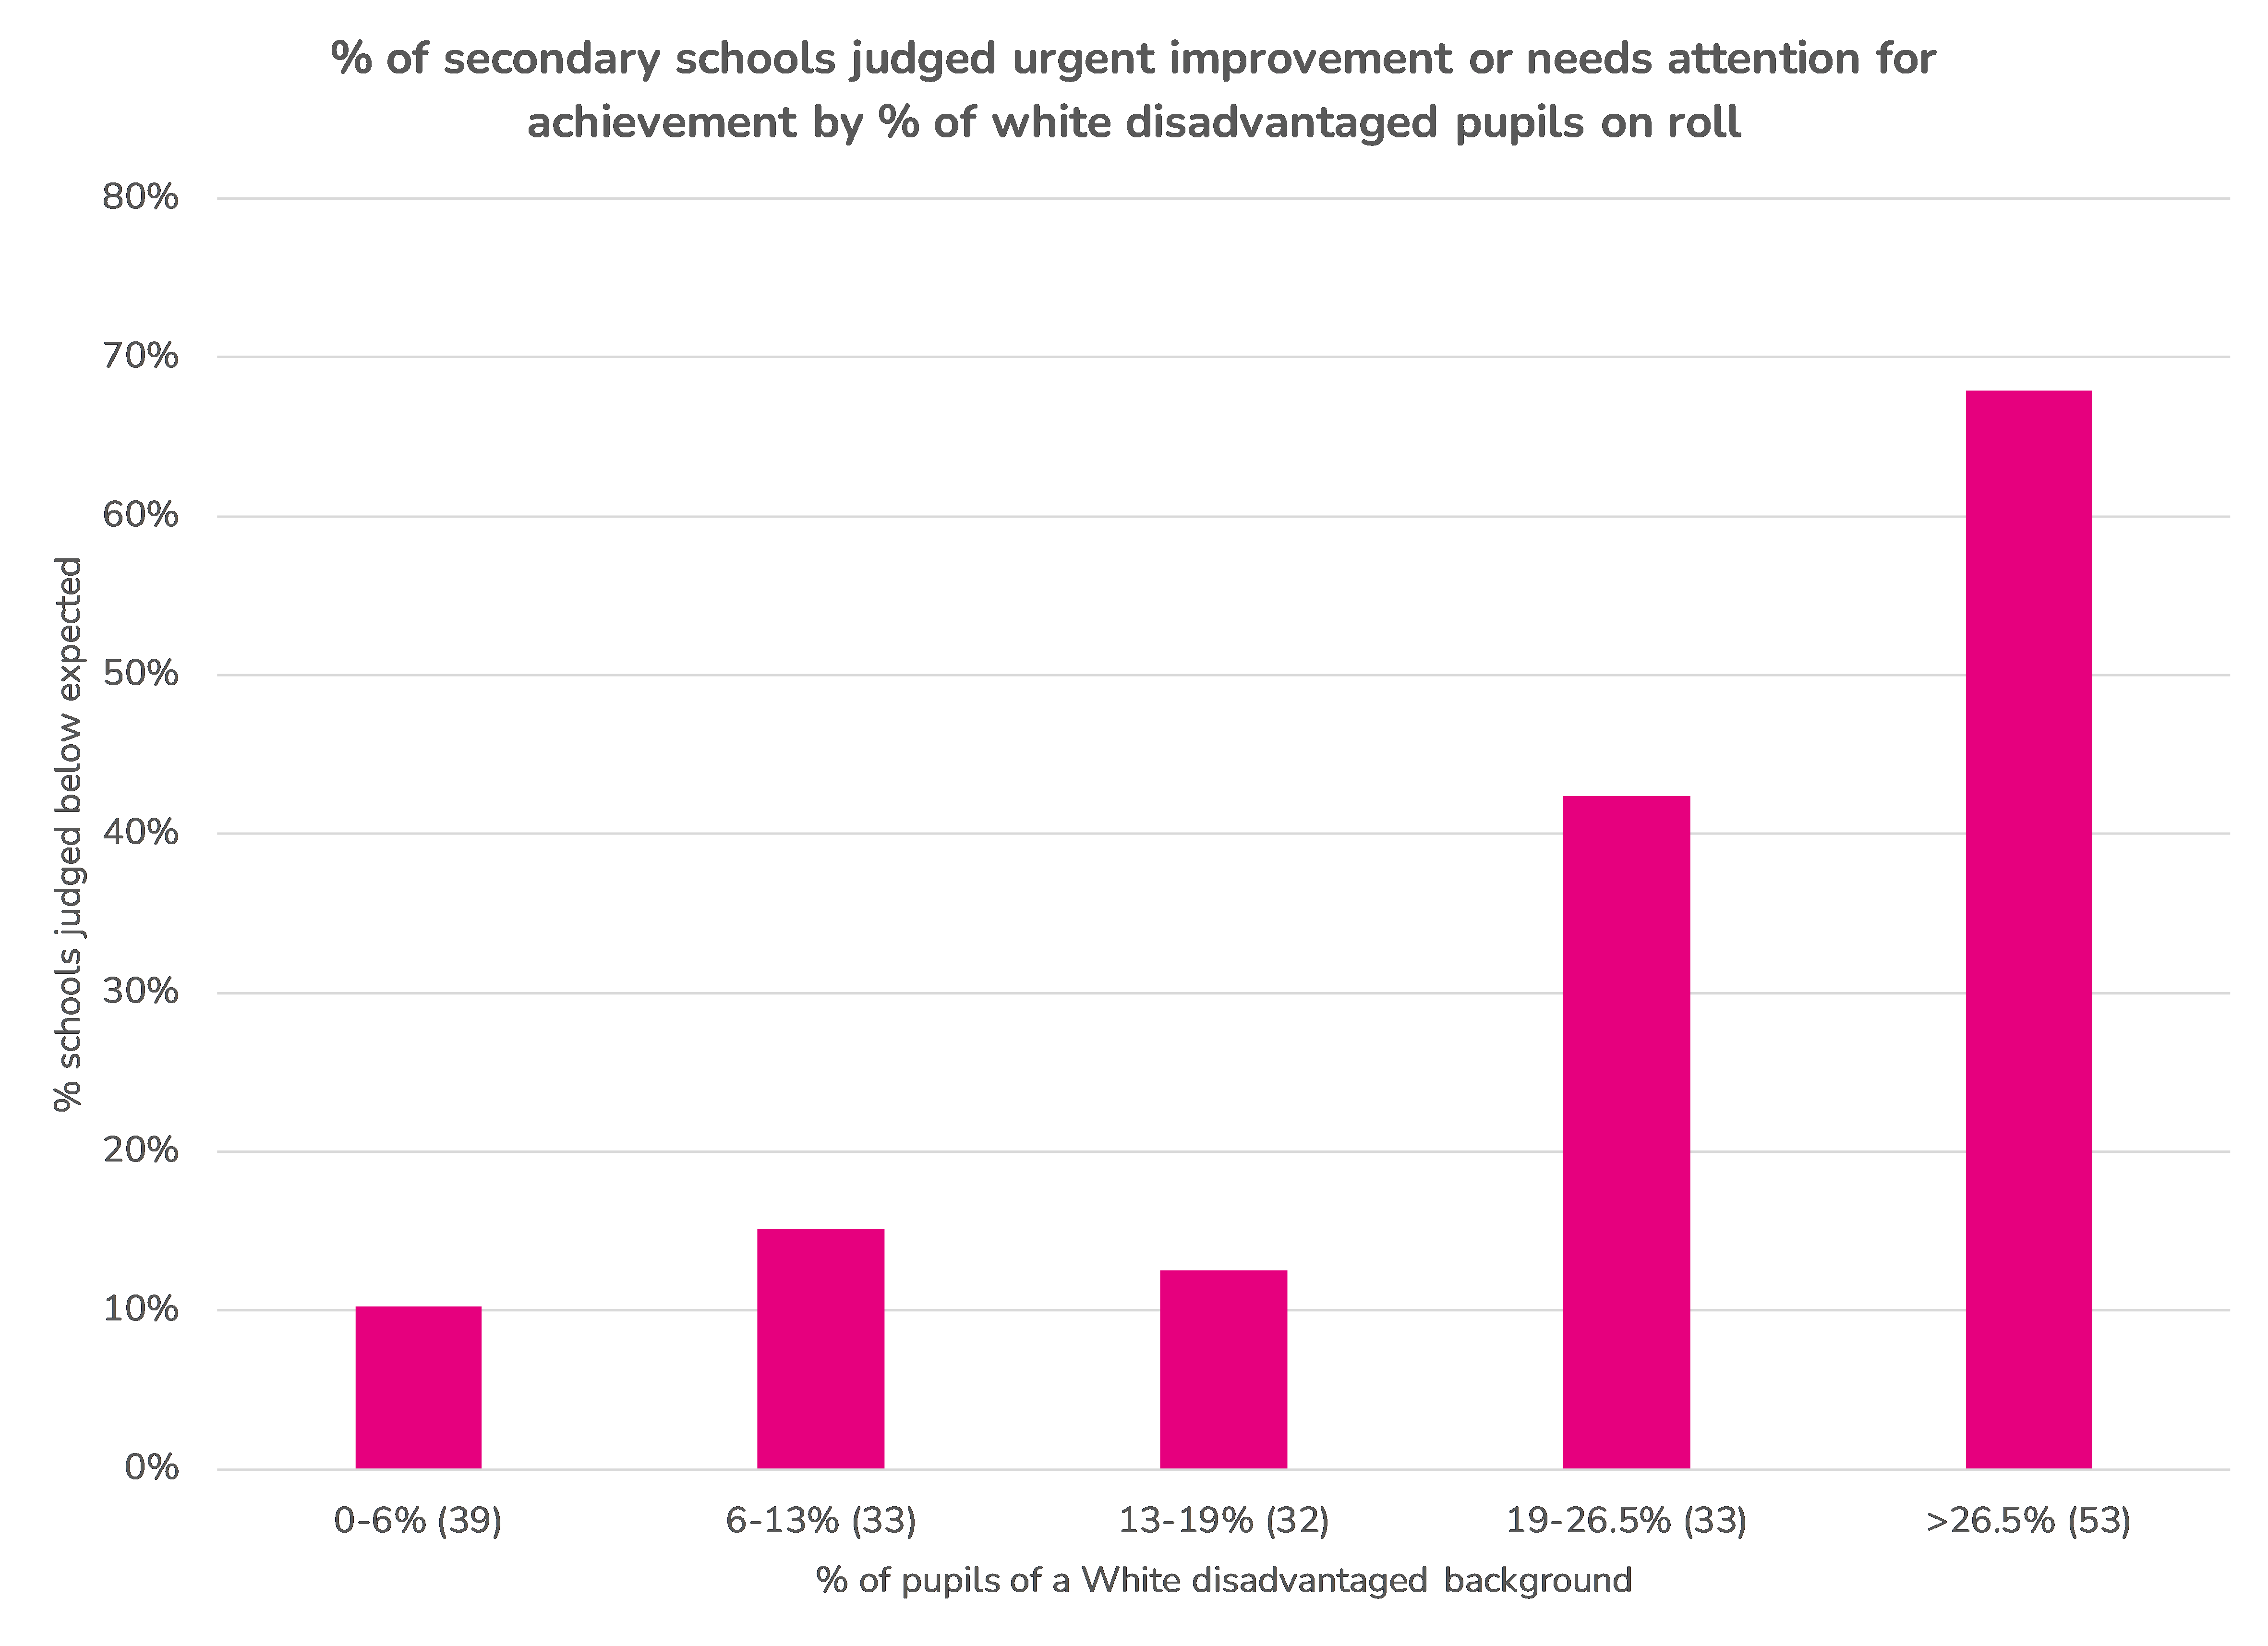
Two things stand out:
- Schools with high proportions of White disadvantaged students are likely to be judged needs attention or urgent improvement
- More schools from the highest quintile of schools based on the proportion of White disadvantaged students have been inspected.
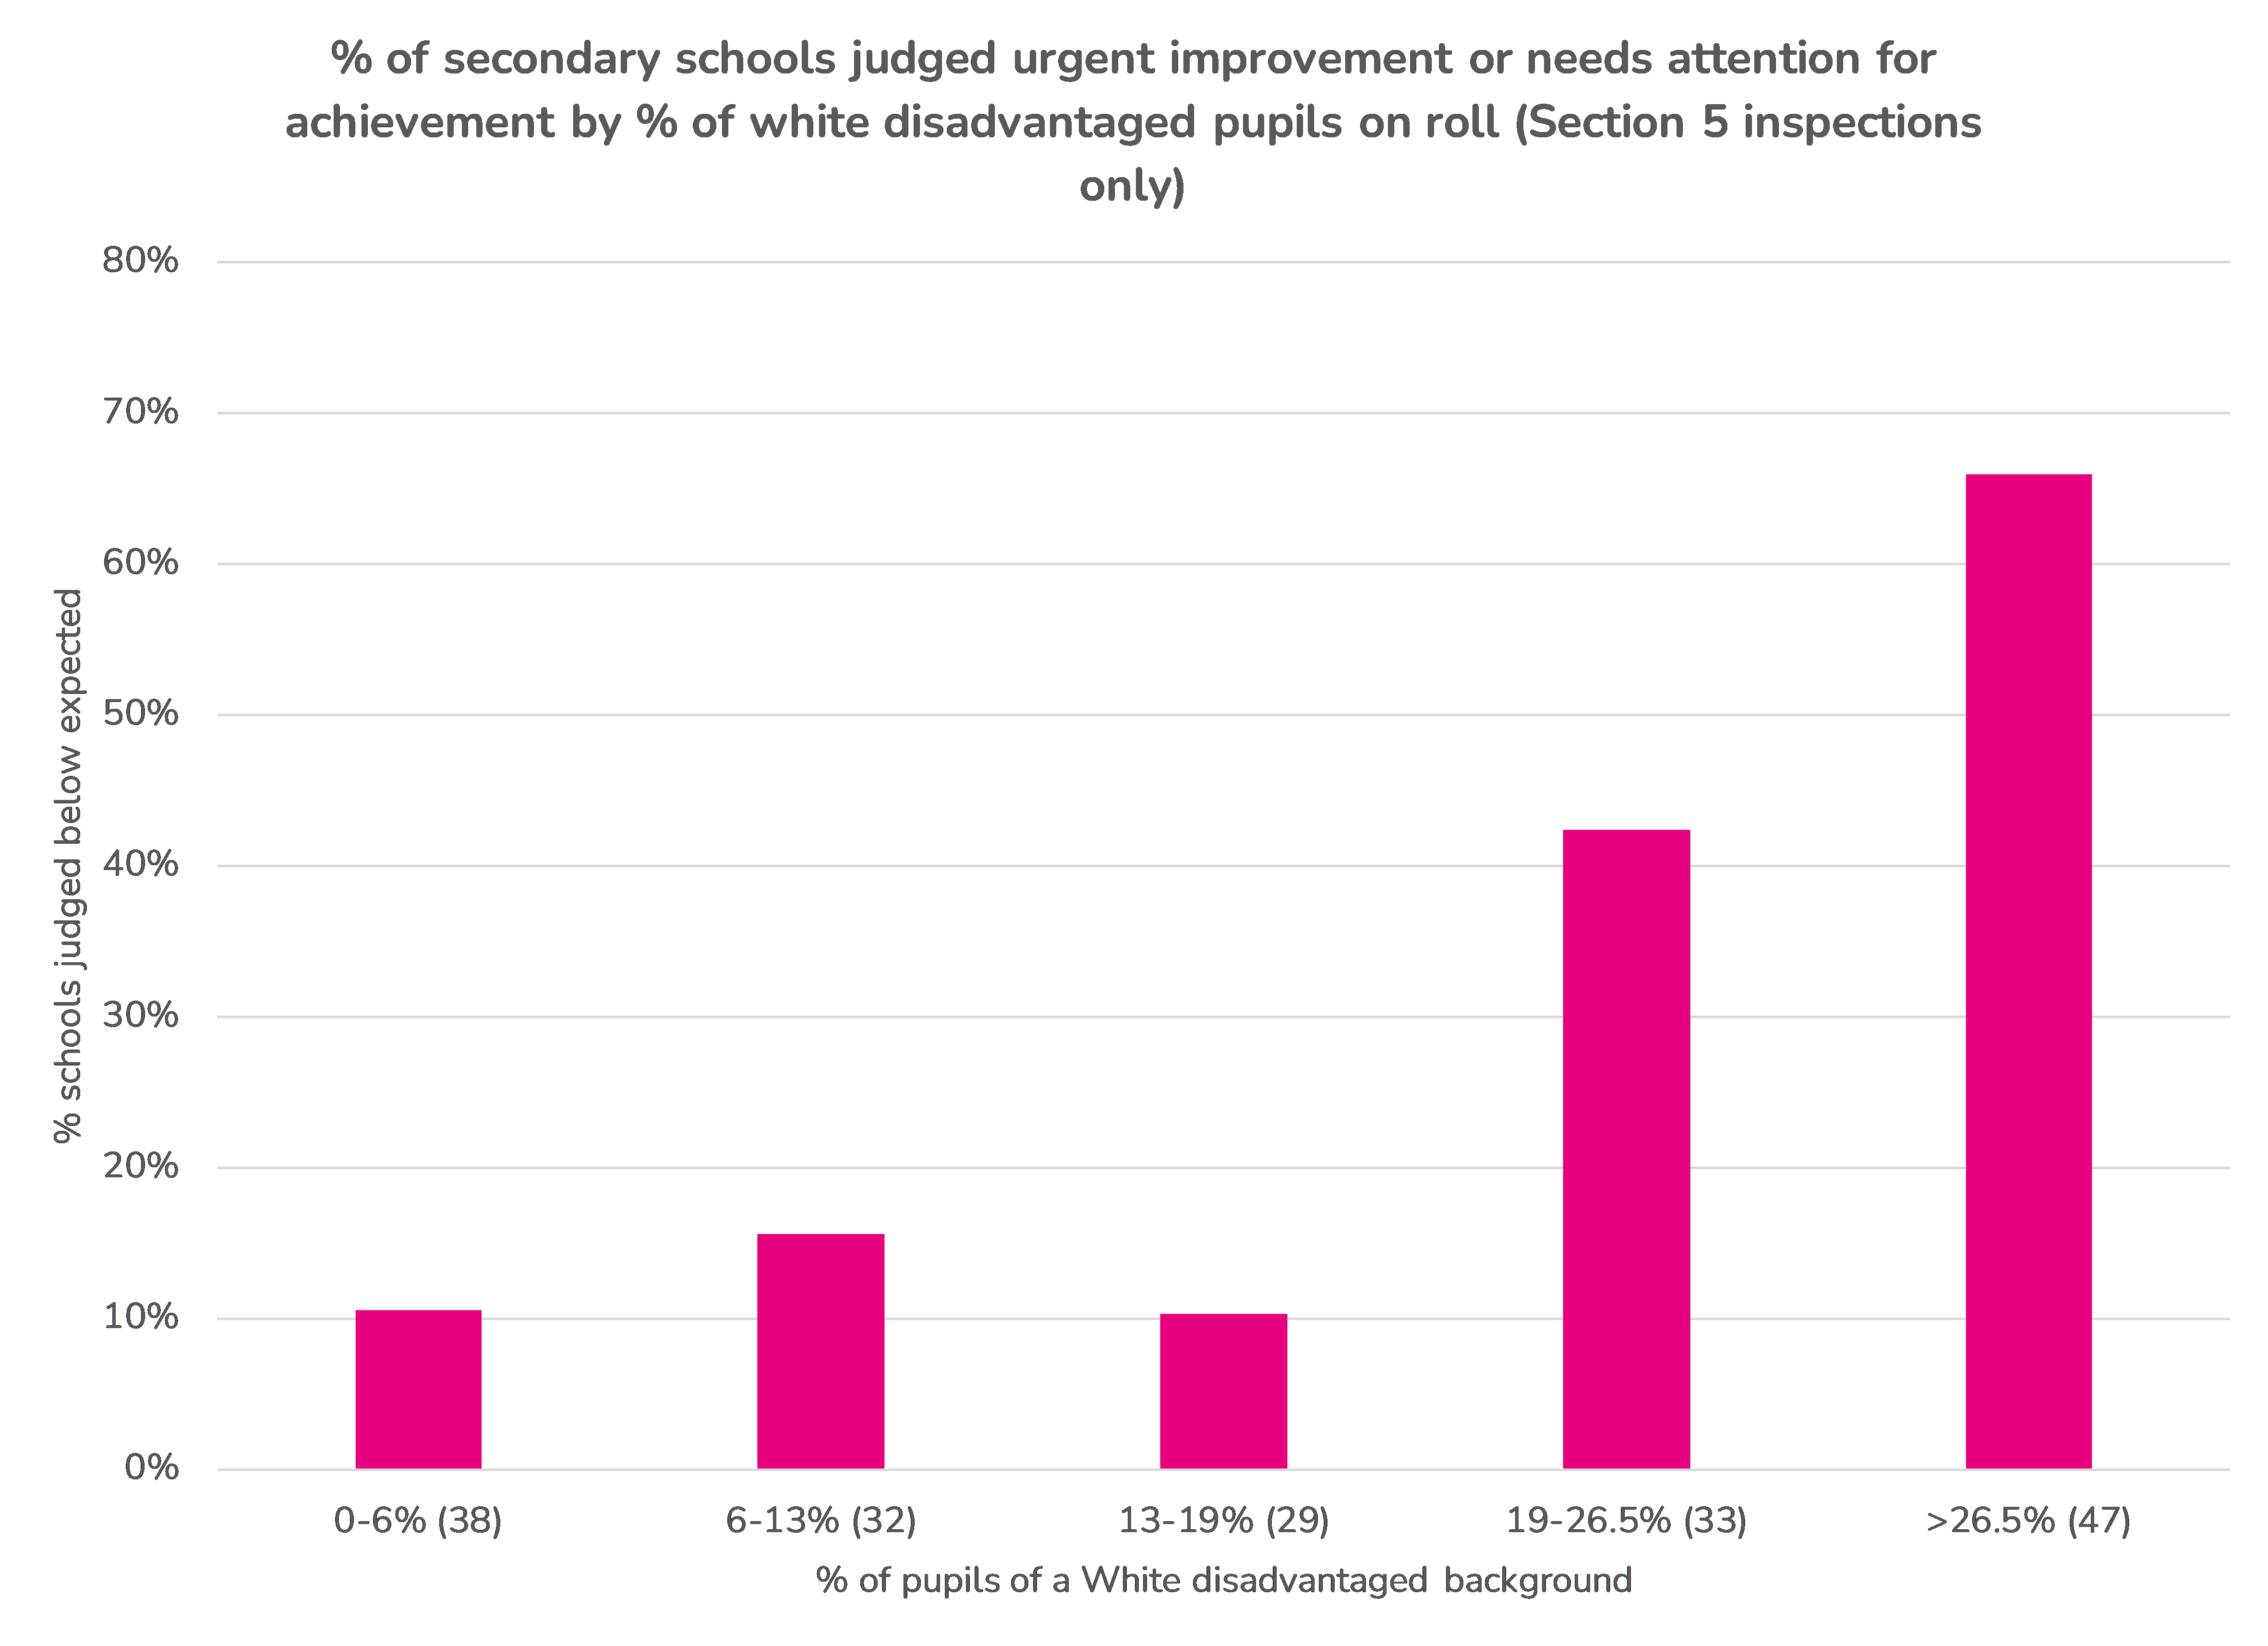
To some extent, the second finding above is partially driven by Ofsted reinspecting schools that were previously deemed to be in a category (special measures, serious weaknesses, requires improvement).
However, the finding still holds when we remove reinspections and visits from the data.
Summing up
Ofsted’s analysis shows that the achievement grade in inspection is related to the attainment of disadvantaged students. Schools where disadvantaged students achieve above average results tend to achieve better inspection outcomes.
However, this is an over-simplification for two reasons.
Firstly, it treats the subset of disadvantaged students as comparable from one school to another. Although there was no prior (Key Stage 2) attainment data for the 2024/25 Year 11 cohort, we can go back to the previous cohort to see that schools judged “exceptional” tended to have higher attaining intakes.
Secondly, it ignores the issue of school composition. Schools with larger proportions of disadvantaged students, particularly from White British, White Irish, White Traveller of Irish Heritage, White Gypsy/ Roma, Black Caribbean and Mixed White/ Black Caribbean backgrounds, will tend to achieve lower outcomes and lower inspection grades.
Underachievement of disadvantaged White pupils is clearly a priority for the government, and something they’ll want to see improve before the end of this parliament (whether it will or not is another matter, given the complexity of the problem). Ofsted having a measure which is inherently biased against schools with large proportions of such pupils will likely make for some uncomfortable headlines as more schools are inspected. Ofsted plans to contextualise attainment measures by comparing with similar schools.
Whether this will help remains to be seen.
Want to stay up-to-date with the latest research from FFT Education Datalab? Sign up to Datalab’s mailing list to get notifications about new blogposts, or to receive the team’s half-termly newsletter.


Leave A Comment