Last week’s statistics on Key Stage 4 attainment showed that the Progress 8 score for pupils with special educational needs met by a statement or education, health and care plan (EHCP) was -1.09. In other words, one grade lower in every subject included in Attainment 8 compared to pupils with similar prior attainment.
But is the attainment of these pupils at Key Stage 4 really that poor given their prior (Key Stage 2) attainment?
To examine this, I have to use 2017 data but I wouldn’t offer odds on it being much different in 2018. In 2017, the national average P8 score for pupils with statements/ECHPs was -1.04.
Progress 8 for pupils in mainstream vs special schools
Progress 8 compares pupils’ Attainment 8 scores to the national average for pupils with similar prior attainment. The set of national averages for each prior attainment band are generally known as expected scores or predictions. They can be seen in Annex C of this [PDF].
The methodology is rather curious in that expected scores are based on pupils in mainstream schools only, but then P8 is also calculated for pupils in special schools.
As pupils in special schools tend to achieve lower A8 scores than pupils in mainstream schools, the net result of this is that the national average P8 score for all pupils falls to -0.03 (rather than 0) when special schools are included.
Looking just at pupils with SEN met by statements or EHCPs, the chart below shows that P8 scores are much lower in special schools (-1.66) than in mainstream schools (-0.42).

Progress 8 is a measure that rewards entry as well as attainment and special schools do not tend to have curricula that align well with P8. For example, just 1% of pupils with SEN met by a statement/EHCP in special schools filled their three EBacc subject slots, compared to 45% in mainstream schools.
If those pupils in mainstream tend to be more likely to be able to follow with a curriculum aligned to Attainment 8 then it is entirely unsurprising that the P8 scores of pupils in special schools are so low by comparison. (Of course, there will be some special schools, e.g. those for the visually impaired, offering A8-aligned curricula, but these will be small in number.)
Over half of pupils with SEN met by a statement/EHCP in the 2017 Year 11 cohort were in special schools. If they were included in national A8 expected scores and then P8 was recalculated for all pupils, the average P8 score for all pupils with statements/EHCPs would increase from -1.04 to -0.65.
Pupils in mainstream
Now let’s look just at those pupils with statements/EHCPs in mainstream schools.
In terms of prior attainment, they are more likely to be found in the lower end of the distribution, as the chart below shows. Almost 40% had a mean KS2 fine grade of 3.0 or lower compared to 1% of pupils without SEN.
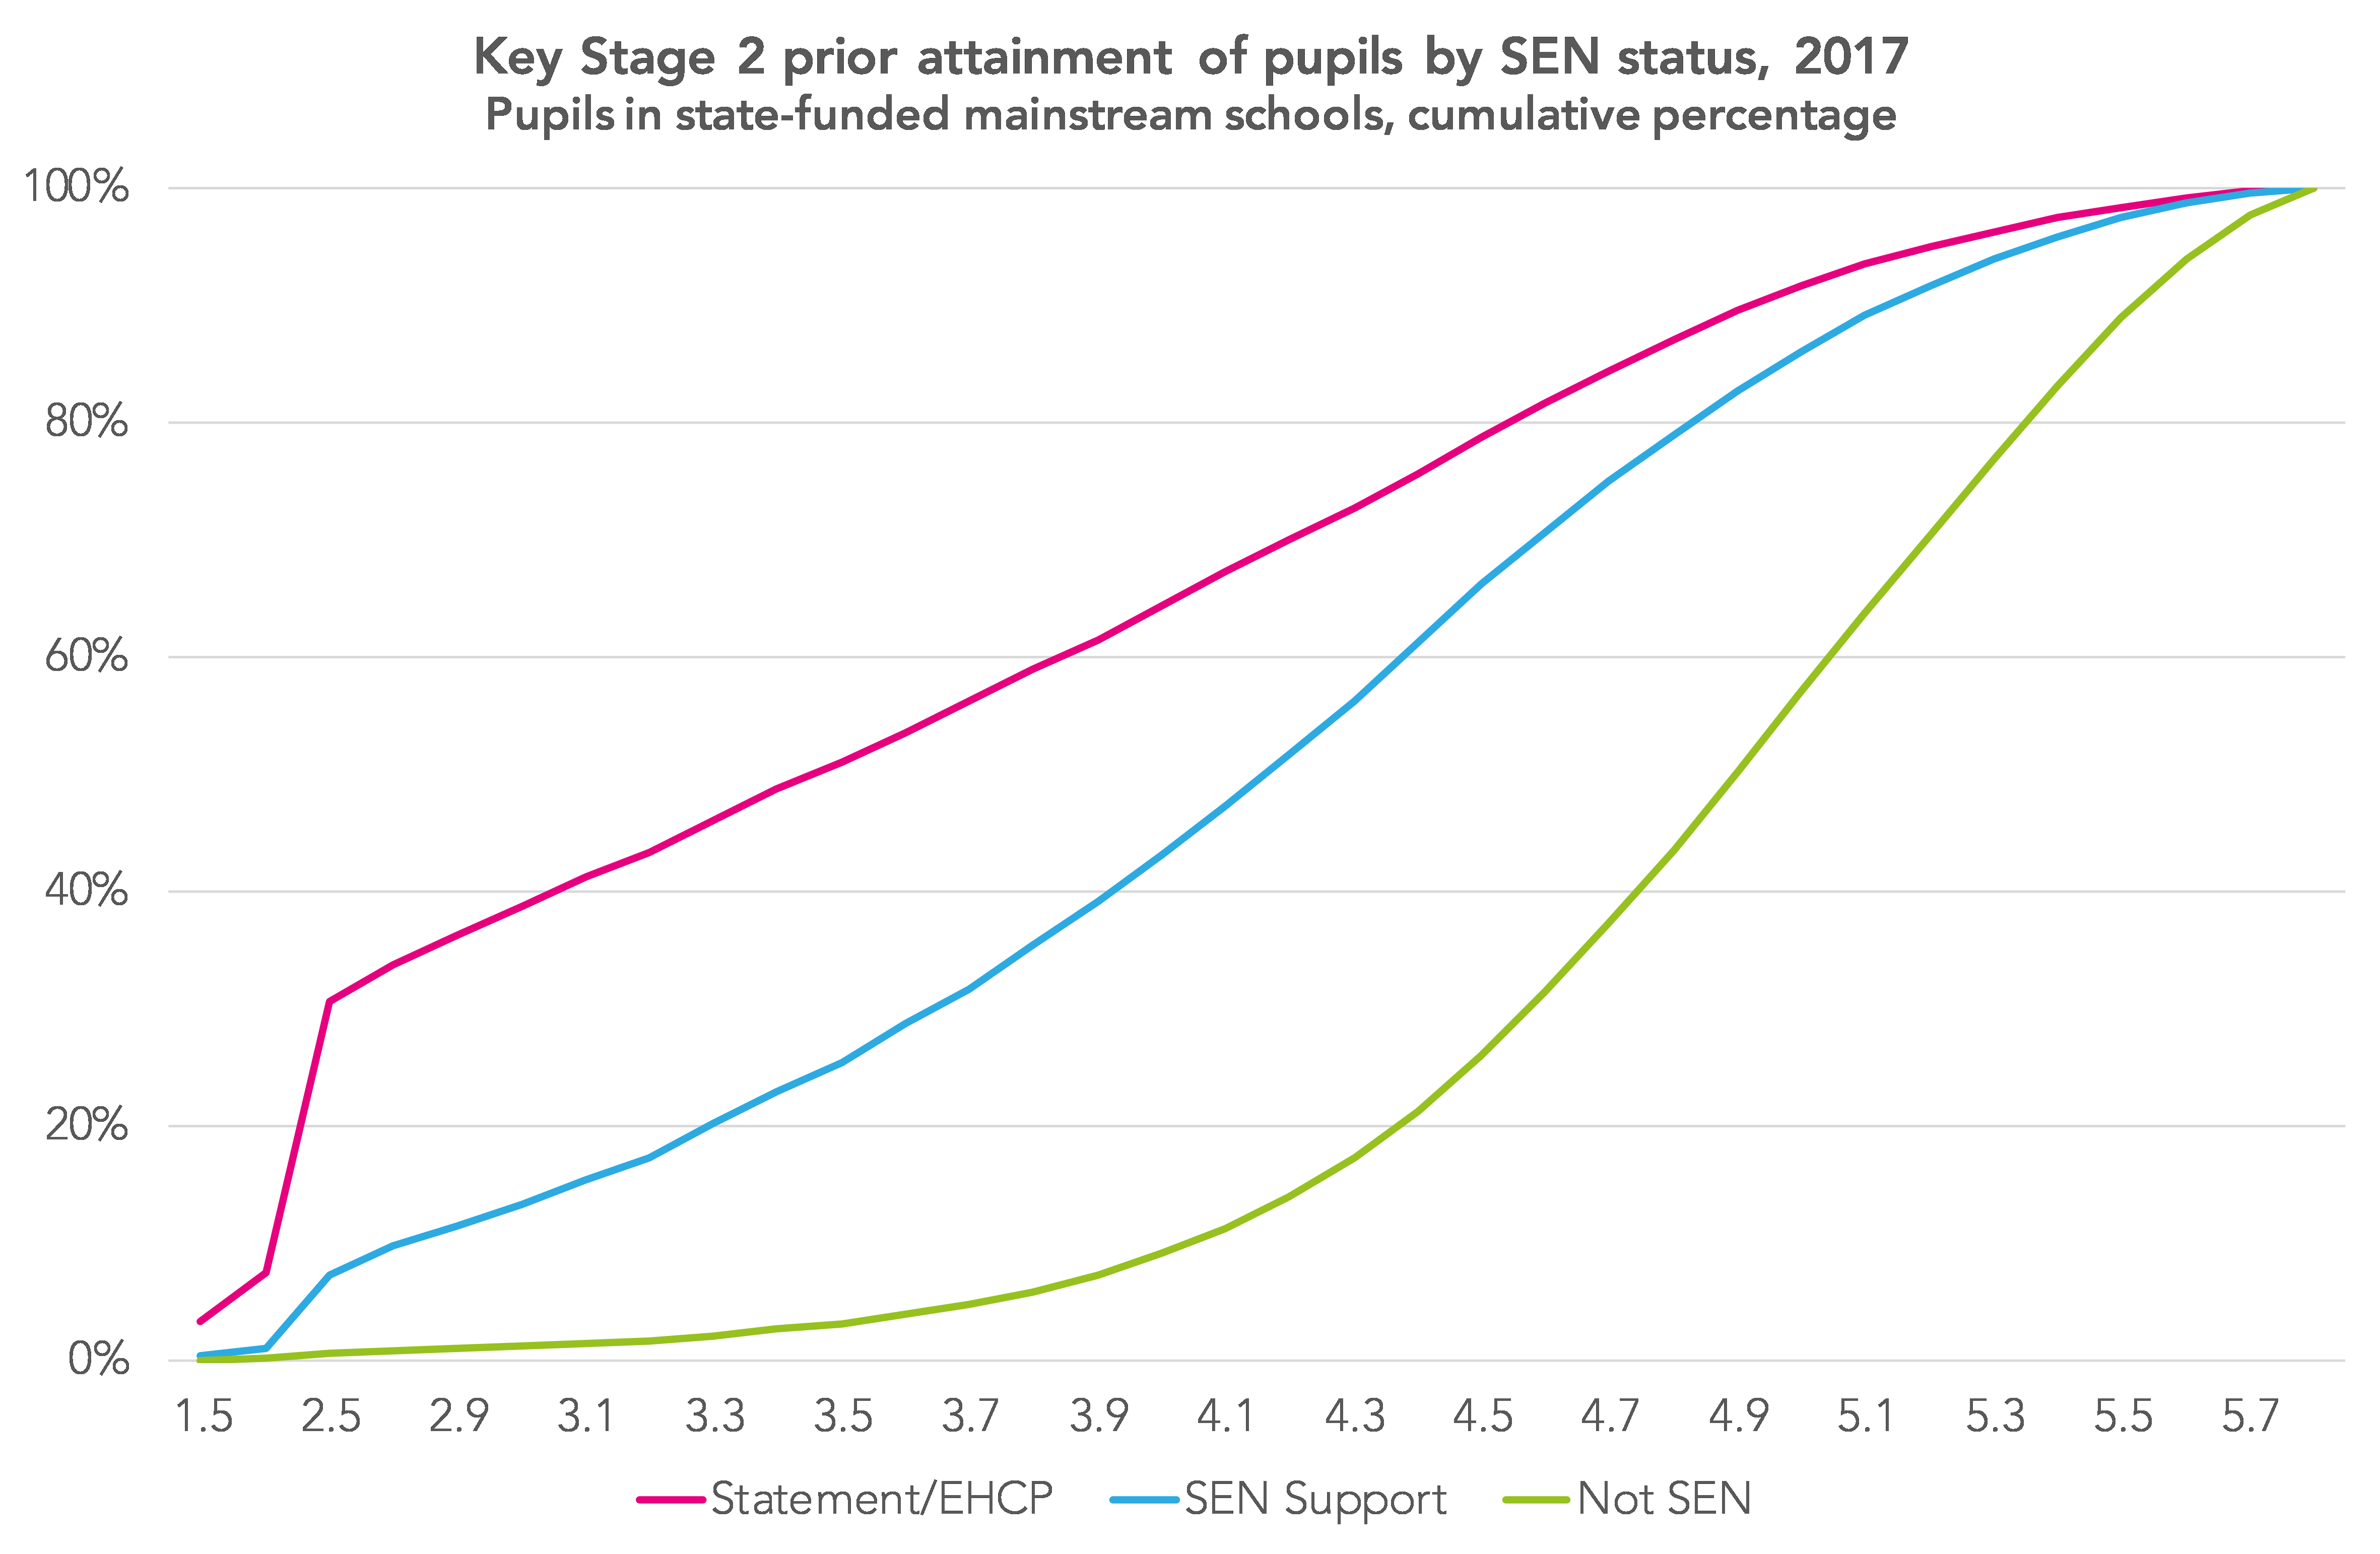
Looking across all pupils, regardless of SEN status, in this lower end of the distribution are around 2,000 pupils with English as an additional language who were first admitted to a school in England during Key Stage 2. Their P8 score is, on the surface, extremely impressive: +1.09. We might assume their Key Stage 2 results did not reflect their ability.
If we recalculate P8 removing these recent arrivals, plus around 7,000 other recent arrivals with higher levels of prior attainment, then the P8 score for pupils in mainstream schools with statements/EHCPs would improve from -0.42 to -0.32.
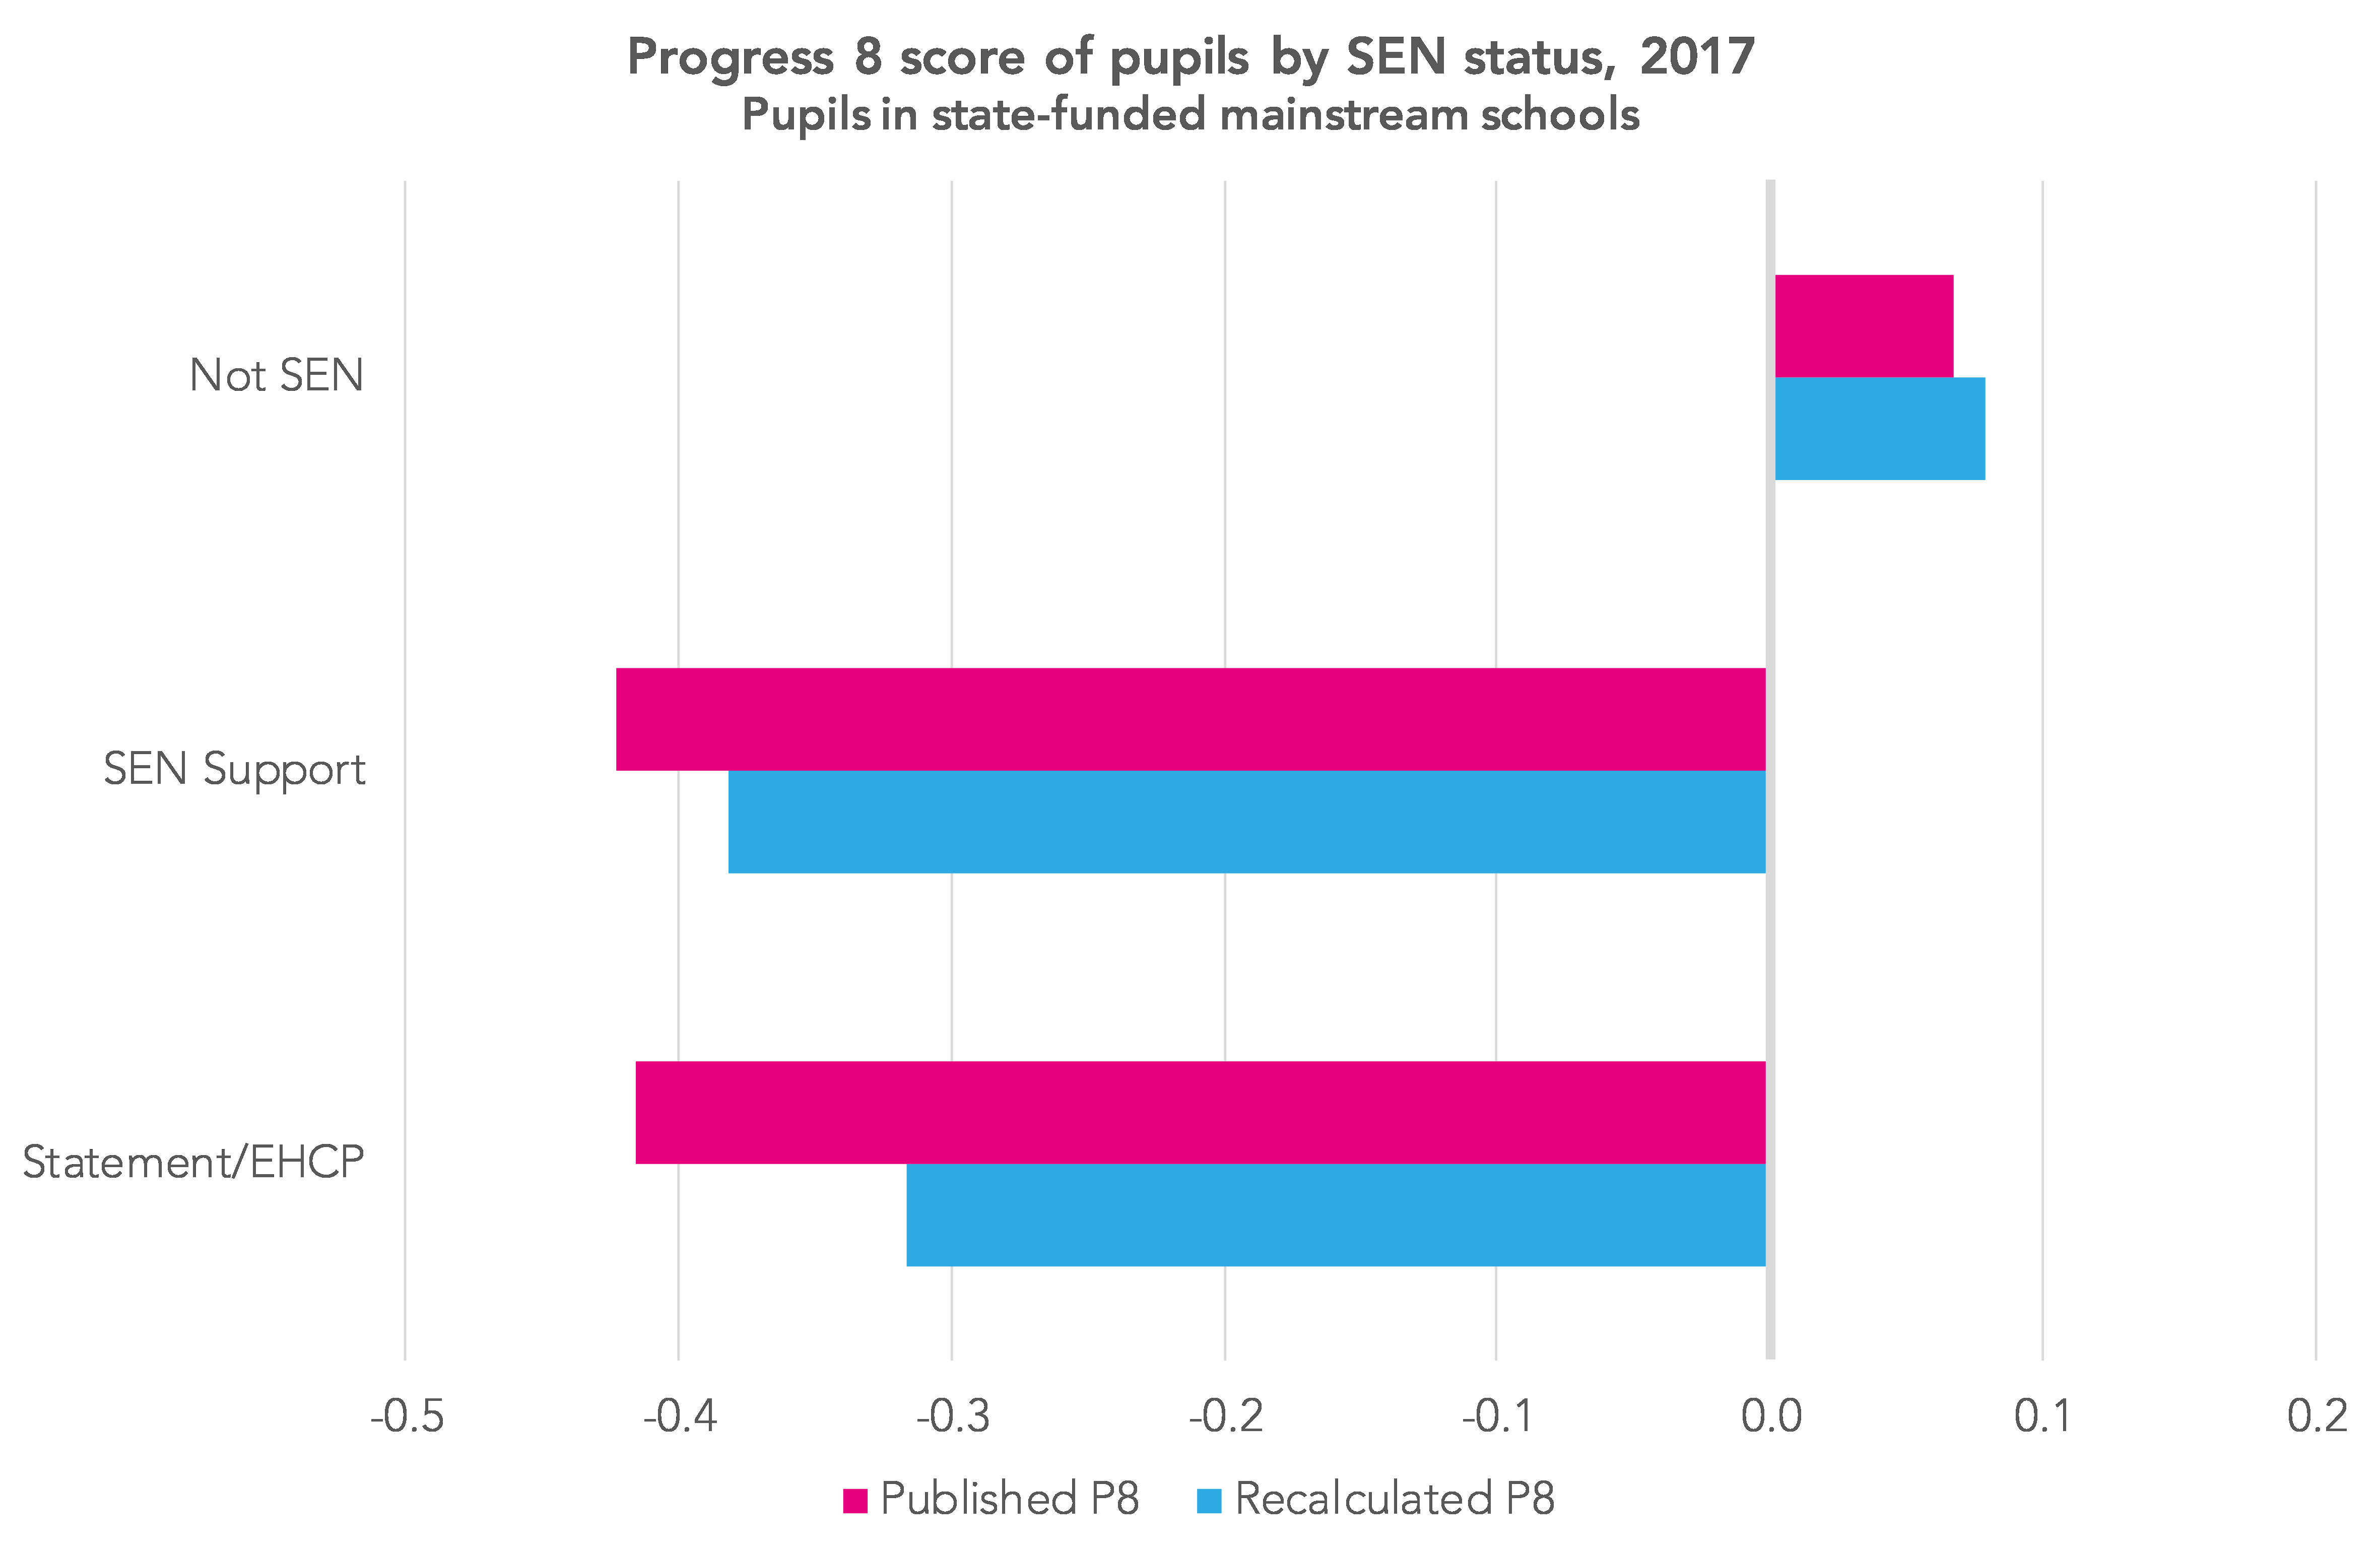
So their Attainment 8 scores are still lower than those of other pupils with similar prior attainment but the picture is perhaps not quite as stark as the figure of -1.09 in the 2018 statistics suggests.
What should be done about this?
If Attainment 8 is considered a suitable metric for pupils in special schools then let’s include them in the calculation of national expected scores. However, this will tend to raise the scores of mainstream schools.
If not, then let’s not calculate P8 for them at all, and let’s report a fairer score for pupils with statements/EHCPs in mainstream schools.
Want to stay up-to-date with the latest research from FFT Education Datalab? Sign up to Datalab’s mailing list to get notifications about new blogposts, or to receive the team’s half-termly newsletter.


Many thanks for another interesting piece of analysis.
A further issue that has cropped up for us is the discrepancy between A8 scores for students doing Double Science compared to those doing separate sciences.
Student A,doing Double Science, achieving 54, with History grade 4 and Geography grade 4 as their only other Ebacc grades would get 12.5 points in “bucket 2”
Student B, doing separate sciences, with Bio 5, Ch 3 and Ph 2, with History (4) and Geography (4) as their only other EBacc grades would get 13 points in “bucket 2”.
It looks like student A is the better scientist, but student b wins on points.
Thanks Jon. So in your example, double science is being treated as filling a single slot. Is that right? I’d have expected Student A to get 13 points (4.5*2 + 4).
That was my reading of it as well. There are issues with the 5+4 in double science elsewhere downplaying the 5, but for the middle bucket of P8 I’m sure it is 13 in student A? Intrigued
Hi Dave, I was wondering where did you get the data to progress 8 scores in special schools?
Hi Niamh. You can download them from here https://www.compare-school-performance.service.gov.uk/download-data?download=true®ions=0&filters=KS4&fileformat=xls&year=2018-2019&meta=false
Filter the data using the RECTYPE column- special schools have the value 2. Progress 8 scores can be found in the P8MEA column.
Thank you so much 🙂
Hi Dave. Do you have any data sources for either the average Attainment 8 or Progress 8 scores of pupils with SEND according to their SEN need type rather than their SEN stage? There is potential for their to be huge differences between pupils with MLD at SEN Support and those with an EHCP who might have SpLD or Autism but who have a relatively high underlying cognitive ability. This is something I’m keen to have some more concrete data on.
Hi David. Yes, DfE publishes P8 (and other headline performance measures) by primary SEN need here (note that it does not distinguish between pupils with EHCPs and those with SEN support) https://assets.publishing.service.gov.uk/government/uploads/system/uploads/attachment_data/file/863939/2019_KS4_revised_national_characteristics_tables.xlsx