The recent solutions report of the Who’s Losing Learning Coalition recognised that measures of school performance at Key Stage 4 are based on pupils on roll in Year 11 in the January School Census each year. This introduces a perverse incentive to move pupils who may not achieve well off roll.
As a result, they included a recommendation that “all pupil movements (off the school roll) should be equally visible and accountable.”.
Readers who have been around for the ten years of our blog will know that this is an idea that we have kicked about in the past.
We thought it was about time we updated this work using more recent data.
In this article, we set out the issue and present some basic statistics about movements off the school roll between Year 7 and Year 11, together with a simple option for producing some summary statistics about pupil mobility alongside the current Key Stage 4 measures.
In part 2 we then calculate some new measures for schools that include pupils who have left.
We also set out some of the limitations of the measures.
Whether any is ultimately adopted will depend on an assessment of whether they result in fairer measures than those currently published in School Performance Tables.
The problem
Key Stage 4 performance tables base their calculations on pupils on roll in schools in January of Year 11.
This leaves open the possibility a perverse incentive to either exclude pupils or encourage them to leave before then.
Performance tables count all pupils equally, regardless of the length of time a pupil has been on roll at a school. Most schools included in Key Stage 4 performance tables admit pupils in Year 7 and most pupils, as we shall see, spend all 5 years between Year 7 and Year 11 on roll at the same school. However, some pupils spend less than 5 years on roll at the school where they complete Key Stage 4.
To give some sense of the effect of pupil mobility on attainment, the Department for Education includes attainment measures for the “non-mobile” cohort, in short those who have spent the whole of Key Stage 4 (Year 10 and Year 11) on roll.
Nonetheless, these measures do not give a sense of how many pupils have left a school since Year 7, let alone their attainment.
This is what we look at in this article.
Data
We use School Census data from Autumn 2020 to Spring 2024. This provides a term-by-term record of pupil enrolments for 13 terms. It should have covered 14 but the 2020 Summer Census was cancelled due to the pandemic.
We also use Key Stage 4 data for 2024. This provides us not only with measures of attainment but also end of Key Stage 4 destinations for pupils. It includes state-funded schools (mainstream, special, AP), pupils in local authority alternative provision, and pupils in independent schools provided they have taken at least one qualification. Some private candidates also appear in the data (e.g. those who may be in home schooling but take their exams at a school).
Our main interest is in the set of over 3,000 state-funded mainstream secondary schools that cover the full Year 7 to Year 11 range. This means we leave to one side (for now at least) schools that admit in Year 8 (or later).
Option 1: Report joiners and leavers
The first option is the simplest.
As is the case now, Performance measures would continue to be based on the end of Year 11 cohort. But alongside them the number of pupils who have left or joined each school since the start of Year 7 is also published.
Across the cohort as a whole, 609 thousand pupils were in Year 7 in January 2020 and 587 thousand were counted in the end of Key Stage 4 performance tables in 2023/24, a net loss of 22 thousand pupils.
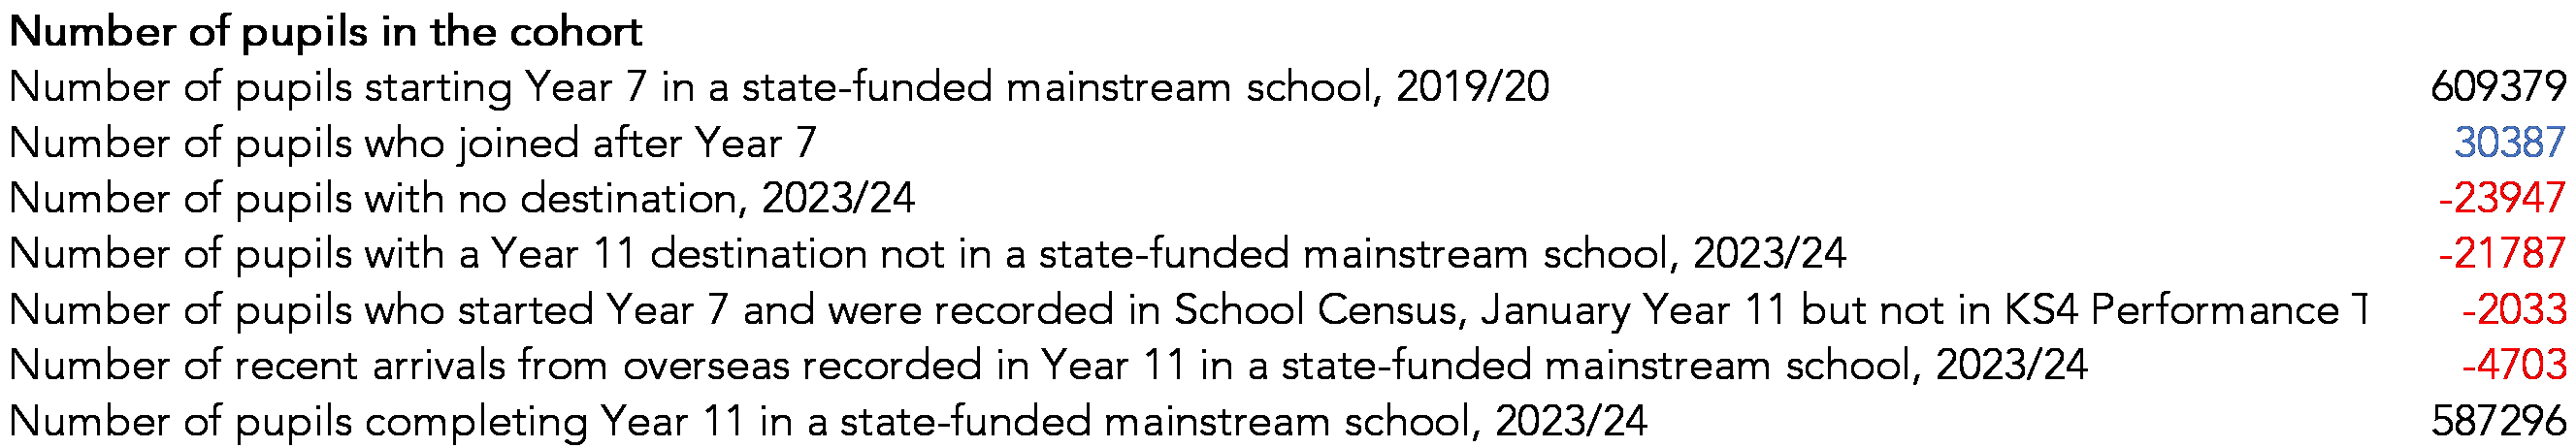
Beneath the headline numbers, we see around 30 thousand pupils joining the cohort after January of Year 7. This will include pupils moving in from outside England and from the independent sector. Of these, 4,700 were recent arrivals from overseas with a first language other than English who were not counted in performance tables[1].
46 thousand pupils left the national cohort after Year 7. This includes 22 thousand pupils for whom a destination outside the state-funded mainstream sector can be established, and 24 thousand for whom a destination cannot be found. The destinations, as recorded in end of Key Stage 4 performance tables data (where available) in 2023/24 are as follows:

Of those who start in Year 7 and remain in the mainstream sector, 44 thousand pupils move within it between Year 7 and Year 11. 518 thousand (85%) of the 609 thousand who start Year 7 complete Key Stage 4 at the same school.

The indicators presented in the table above can be calculated for each school and presented alongside end of Key Stage 4 performance measures.
In particular, the net change in pupil numbers between Year 7 and Year 11 can be presented as a percentage of the number of pupils who start Year 7. We saw earlier that the national number of Year 11 finishers was 22 thousand lower than the number of Year 7 starters, a net change of -3.7%.
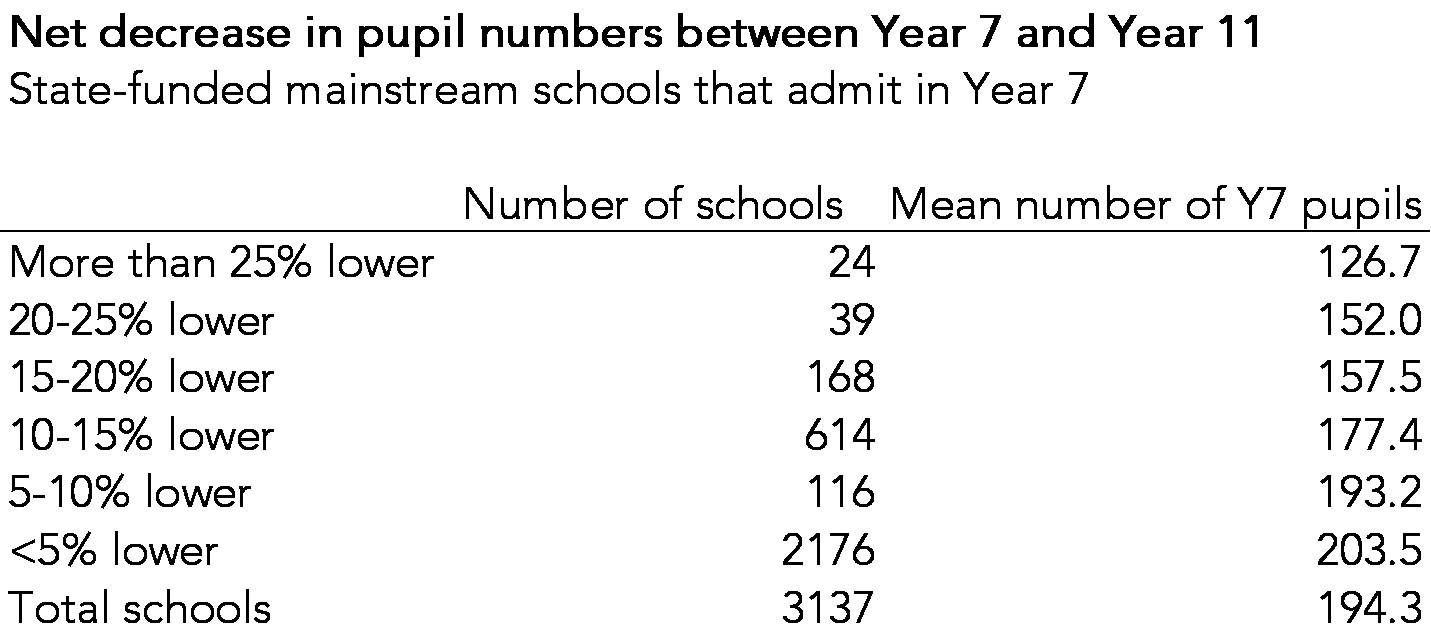
For 2,176 schools, the number of Year 11 finishers is no more than 5% lower than the number of Year 7 starters. However, there were 24 schools where the number of finishers was more than 25% lower than the number of starters. These schools tend to be a bit smaller than other schools, with an average of 127 Year 7 starters.
Sign up to our newsletter
If you enjoy our content, why not sign up now to get notified when we publish a new post, or to receive our half termly newsletter?
Some of these schools are close to specialist schools that admit at age 14 (studio schools, university technical colleges and some FE Colleges). This is why also reporting data on destinations will be important.
The percentage of Year 7 starters who finish Key Stage 4 at the same school could also be published. These rates would be lower in areas with higher levels of residential mobility, such as schools close to military bases.
As with all measures relating to schools, context plays a part. In the following charts, we show the percentage of pupils who start Year 7 at a state-funded mainstream school who subsequently either a) change mainstream school or b) leave the mainstream sector by a range of pupil characteristics.
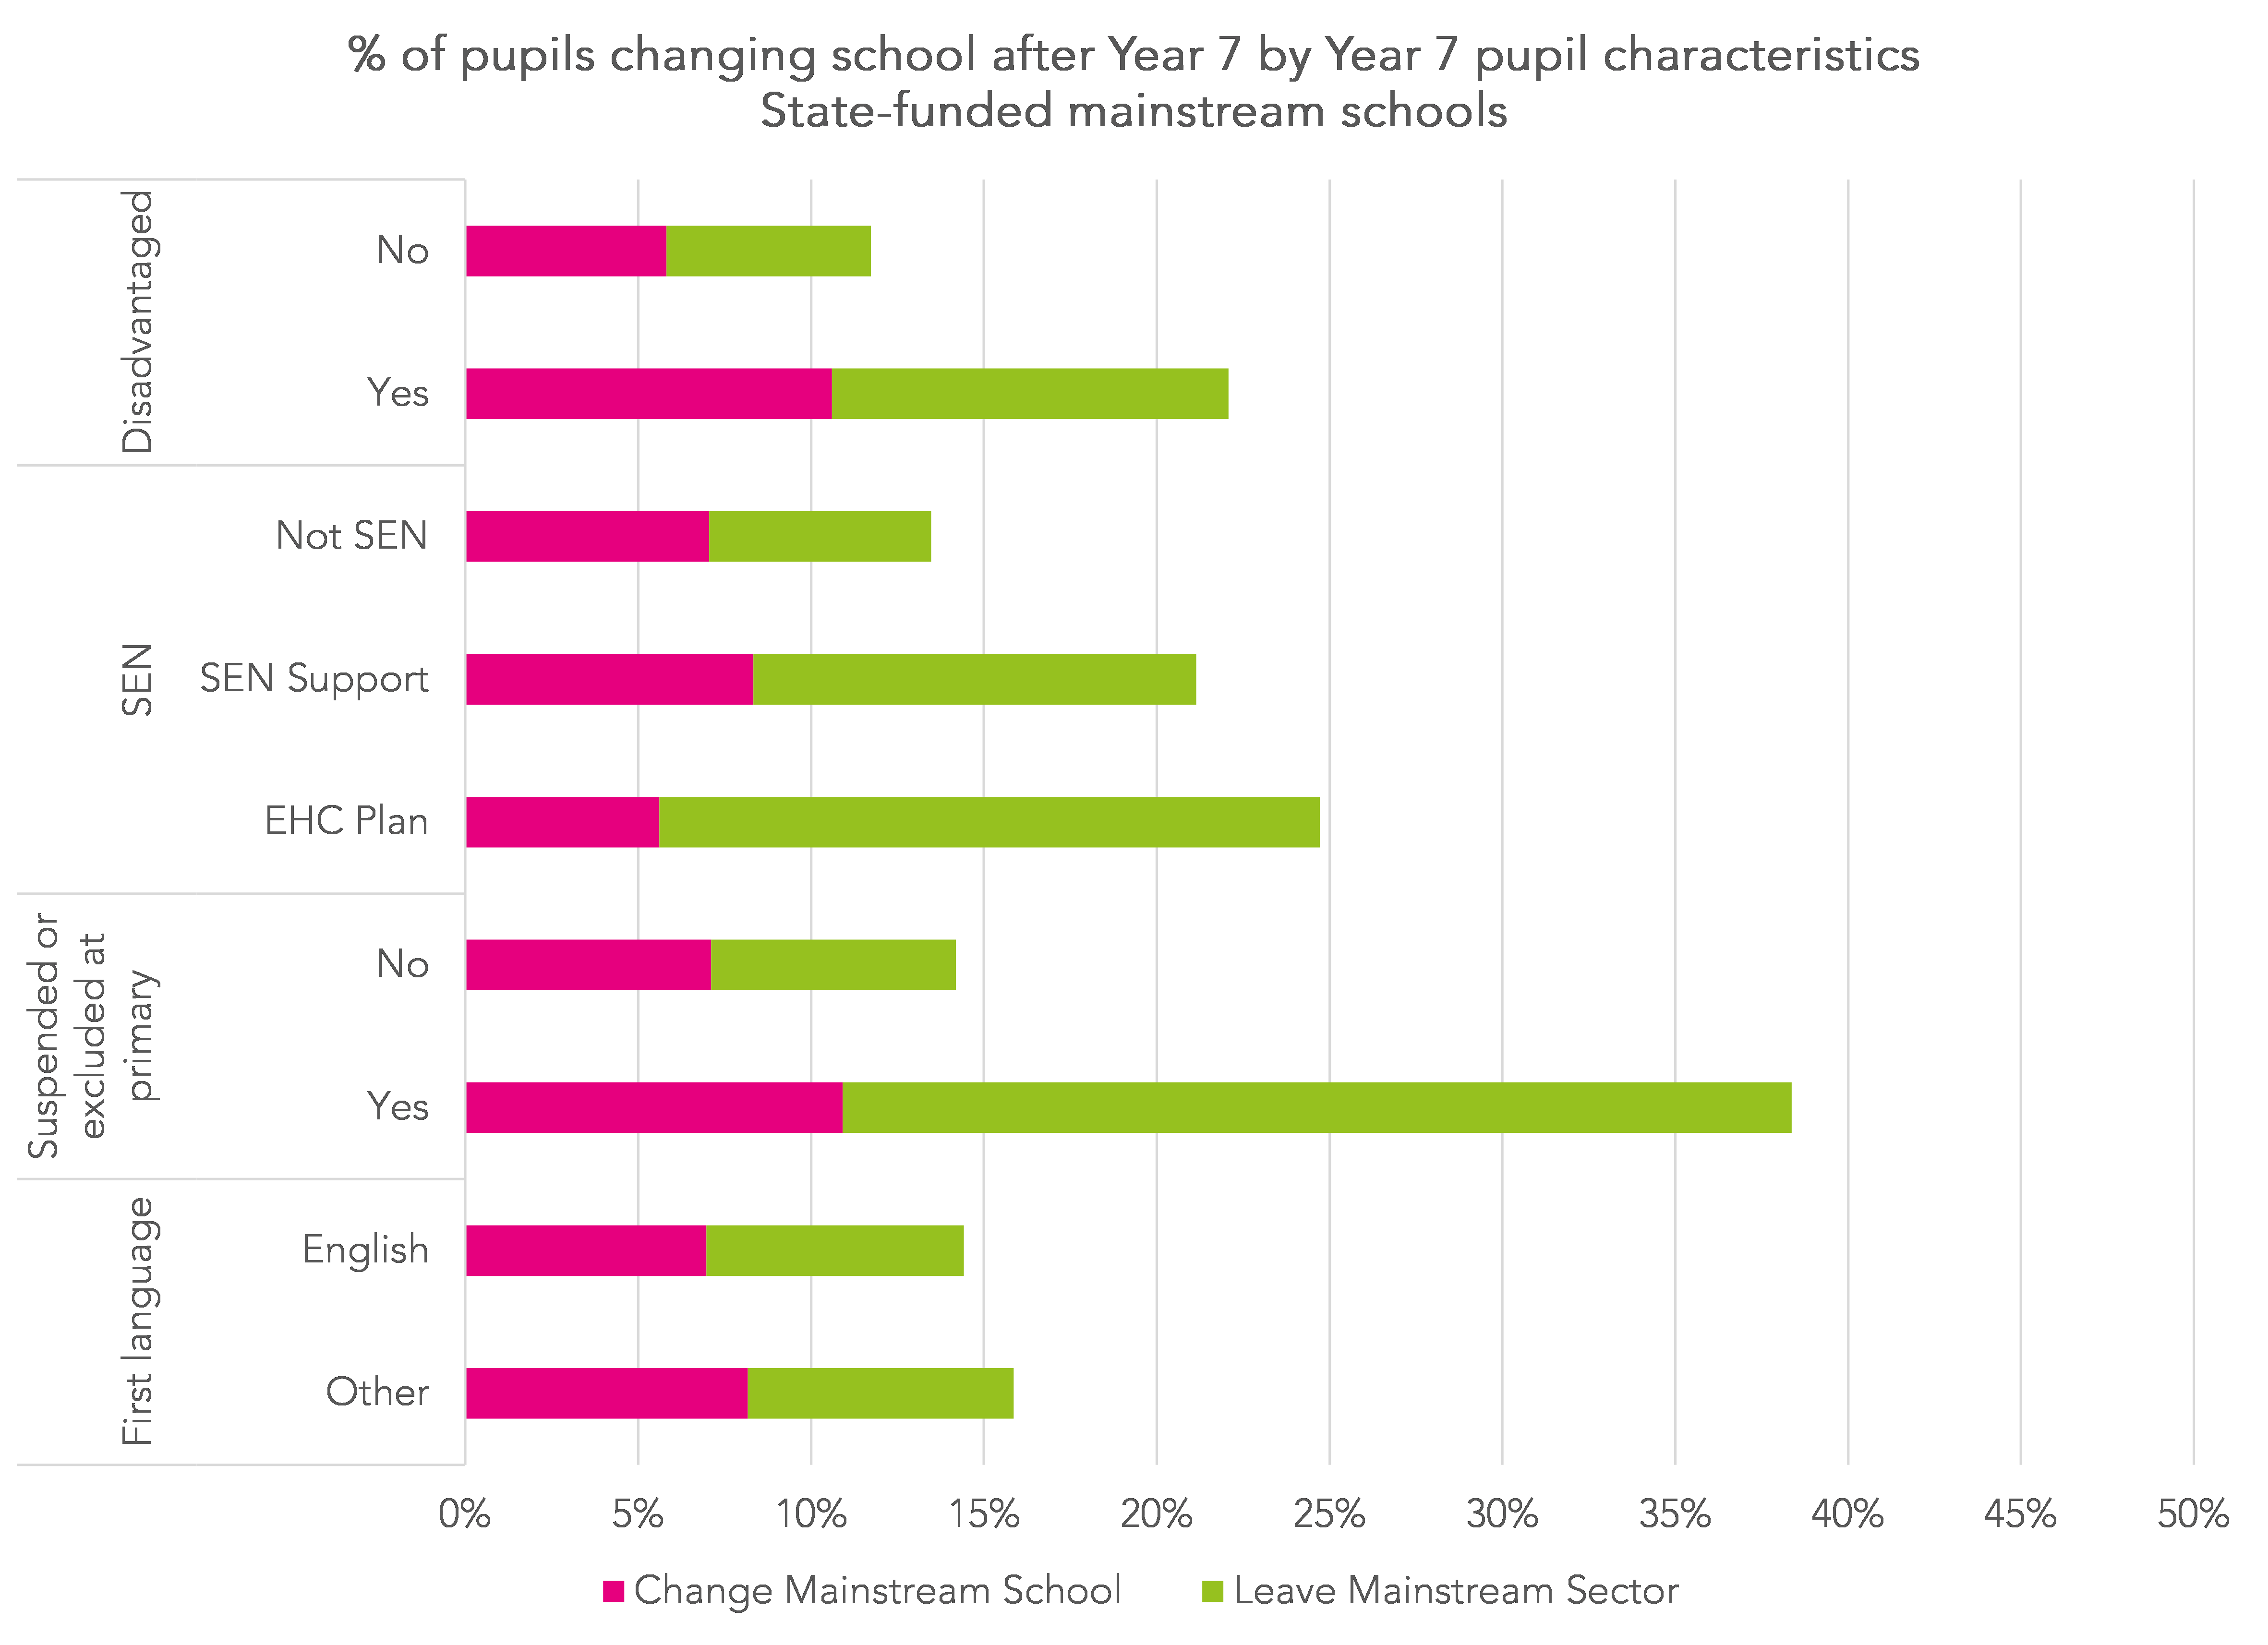
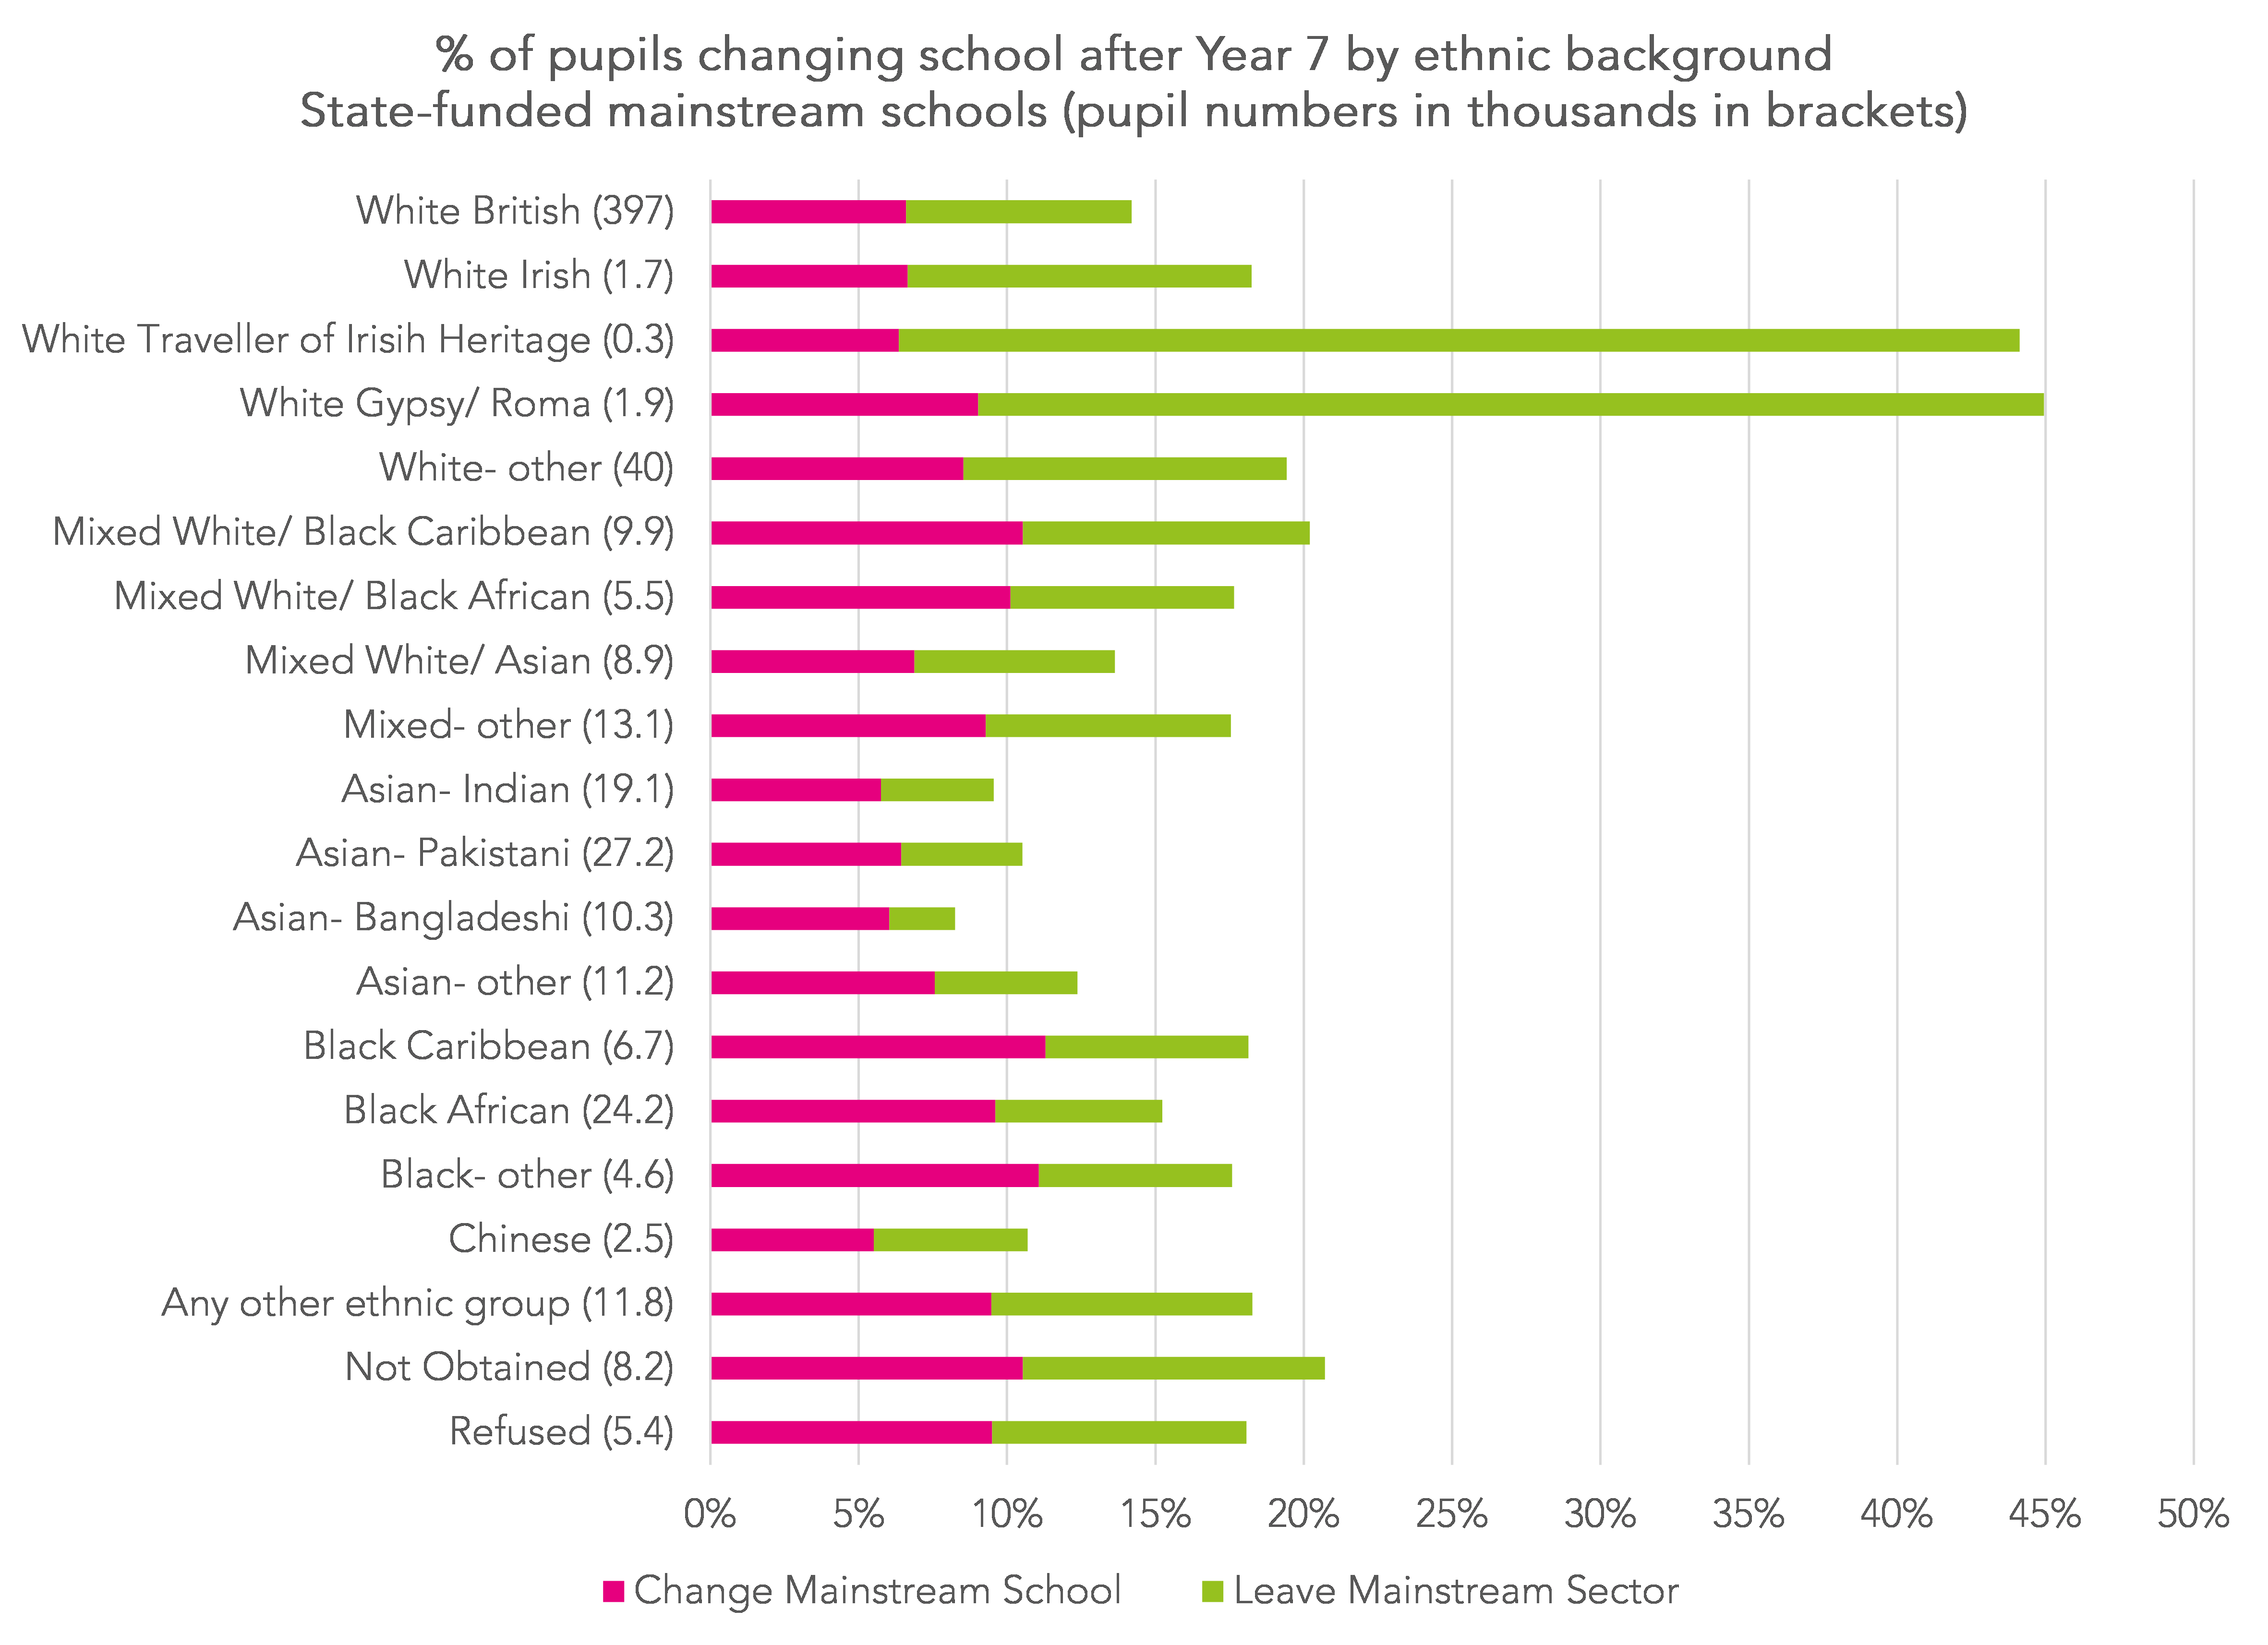
Pupils classified as disadvantaged in Year 7 were twice as likely to either change schools or leave the mainstream sector as other pupils. Rates of leaving were also much higher than average among pupils who had EHC plans in Year 7, those with a history of suspension / exclusion at primary school and the small number of pupils from Irish Heritage Traveller or Gypsy / Roma ethnic backgrounds.
Schools disproportionately serving pupils from these backgrounds will tend to experience higher levels of pupil movements between Year 7 and Year 11.
Summing up (so far)
Some pupils move schools between Year 7 and Year 11. 15% of pupils who started Year 7 at a state-funded mainstream school in 2019/20 had left by 2023/24.
Whilst some of these pupils were replaced by pupils joining schools after January of Year 7, the number of joiners was less than the number of leavers, resulting in a net loss of around 22 thousand pupils between Year 7 and Year 11.
Simple data on pupil movements and the destinations of leavers could be published in School Performance Tables (or the Ofsted Inspection Data Summary Report) alongside the existing measures.
In part 2 we will look at two further options, both of which involve calculating some new measures.
- Schools can request that these pupils are removed from Performance Tables via the checking exercise. DfE approve such requests if suitable evidence is provided.
Want to stay up-to-date with the latest research from FFT Education Datalab? Sign up to Datalab’s mailing list to get notifications about new blogposts, or to receive the team’s half-termly newsletter.
[npd_ident_ons}


Leave A Comment