In part one we set out some initial thoughts and basic statistics about pupils leaving secondary schools between Years 7 and 11.
This was in response to the solutions report of the Who’s Losing Learning Coalition, which recognised that measures of school performance at Key Stage 4 are based on pupils on roll in Year 11 in the January School Census each year. This introduces a perverse incentive to move pupils who may not achieve well off roll.
In this second part, we present two further options for reflecting pupil movements in Key Stage 4 performance measures:
- Calculate indicators for pupils who start Year 7 as well as those who finish Year 11
- Reweight the performance indicators based on the number of terms pupils spend on roll between Year 7 and Year 11.
Option 2: Performance measures for Year 7 starters
The second option is to calculate a small number of performance measures for pupils who start Year 7 at each school to publish alongside end of Key Stage 4 measures.
These could be the current “headline” indicators (Progress 8, Attainment 8, percentage of pupils achieving grade 5 or above in English and maths, percentage of pupils entering the EBacc, EBacc average point score) or whatever might replace them. Progress 8 will not be published for this academic year (2024/2025) or next year.
The main methodological issue with doing this is what to do about the 24 thousand pupils for whom a Key Stage 4 destination cannot be found, or the 2 thousand pupils who are still on roll but who were not included in Performance Tables in 2023/24. Some of this latter group may be included in future. In fact, some of them may have achieved some qualifications in 2023/24 but they are not included in the Key Stage 4 data that DfE make available to researchers (although they are included in the data they collect for Performance Tables).
For the purposes of this illustration, we assume no attainment. For those remaining on roll at a school, their inclusion in performance tables could be deferred by schools until the following year during the performance tables checking exercise.
Those leaving the state-funded school system entirely will have their results included if they subsequently enter exams at an independent school, or as a private candidate at a state school. This latter category will include some pupils who have been home educated.
Some pupils, including those who emigrate, will not have any results recorded at all. Again we assume no attainment.
The overall effect of this is that the attainment indicators for the Year 7 starters will be lower than those for the Year 11 finishers.

We have recalculated Progress 8 based on Year 7 starters for all 3,134 mainstream schools that admit pupils in Year 7. These figures can be compared to the published measures based on Year 11 finishers.
We summarise the difference between Progress 8 based on Year 11 pupils and Progress 8 based on Year 7 pupils in the following chart.
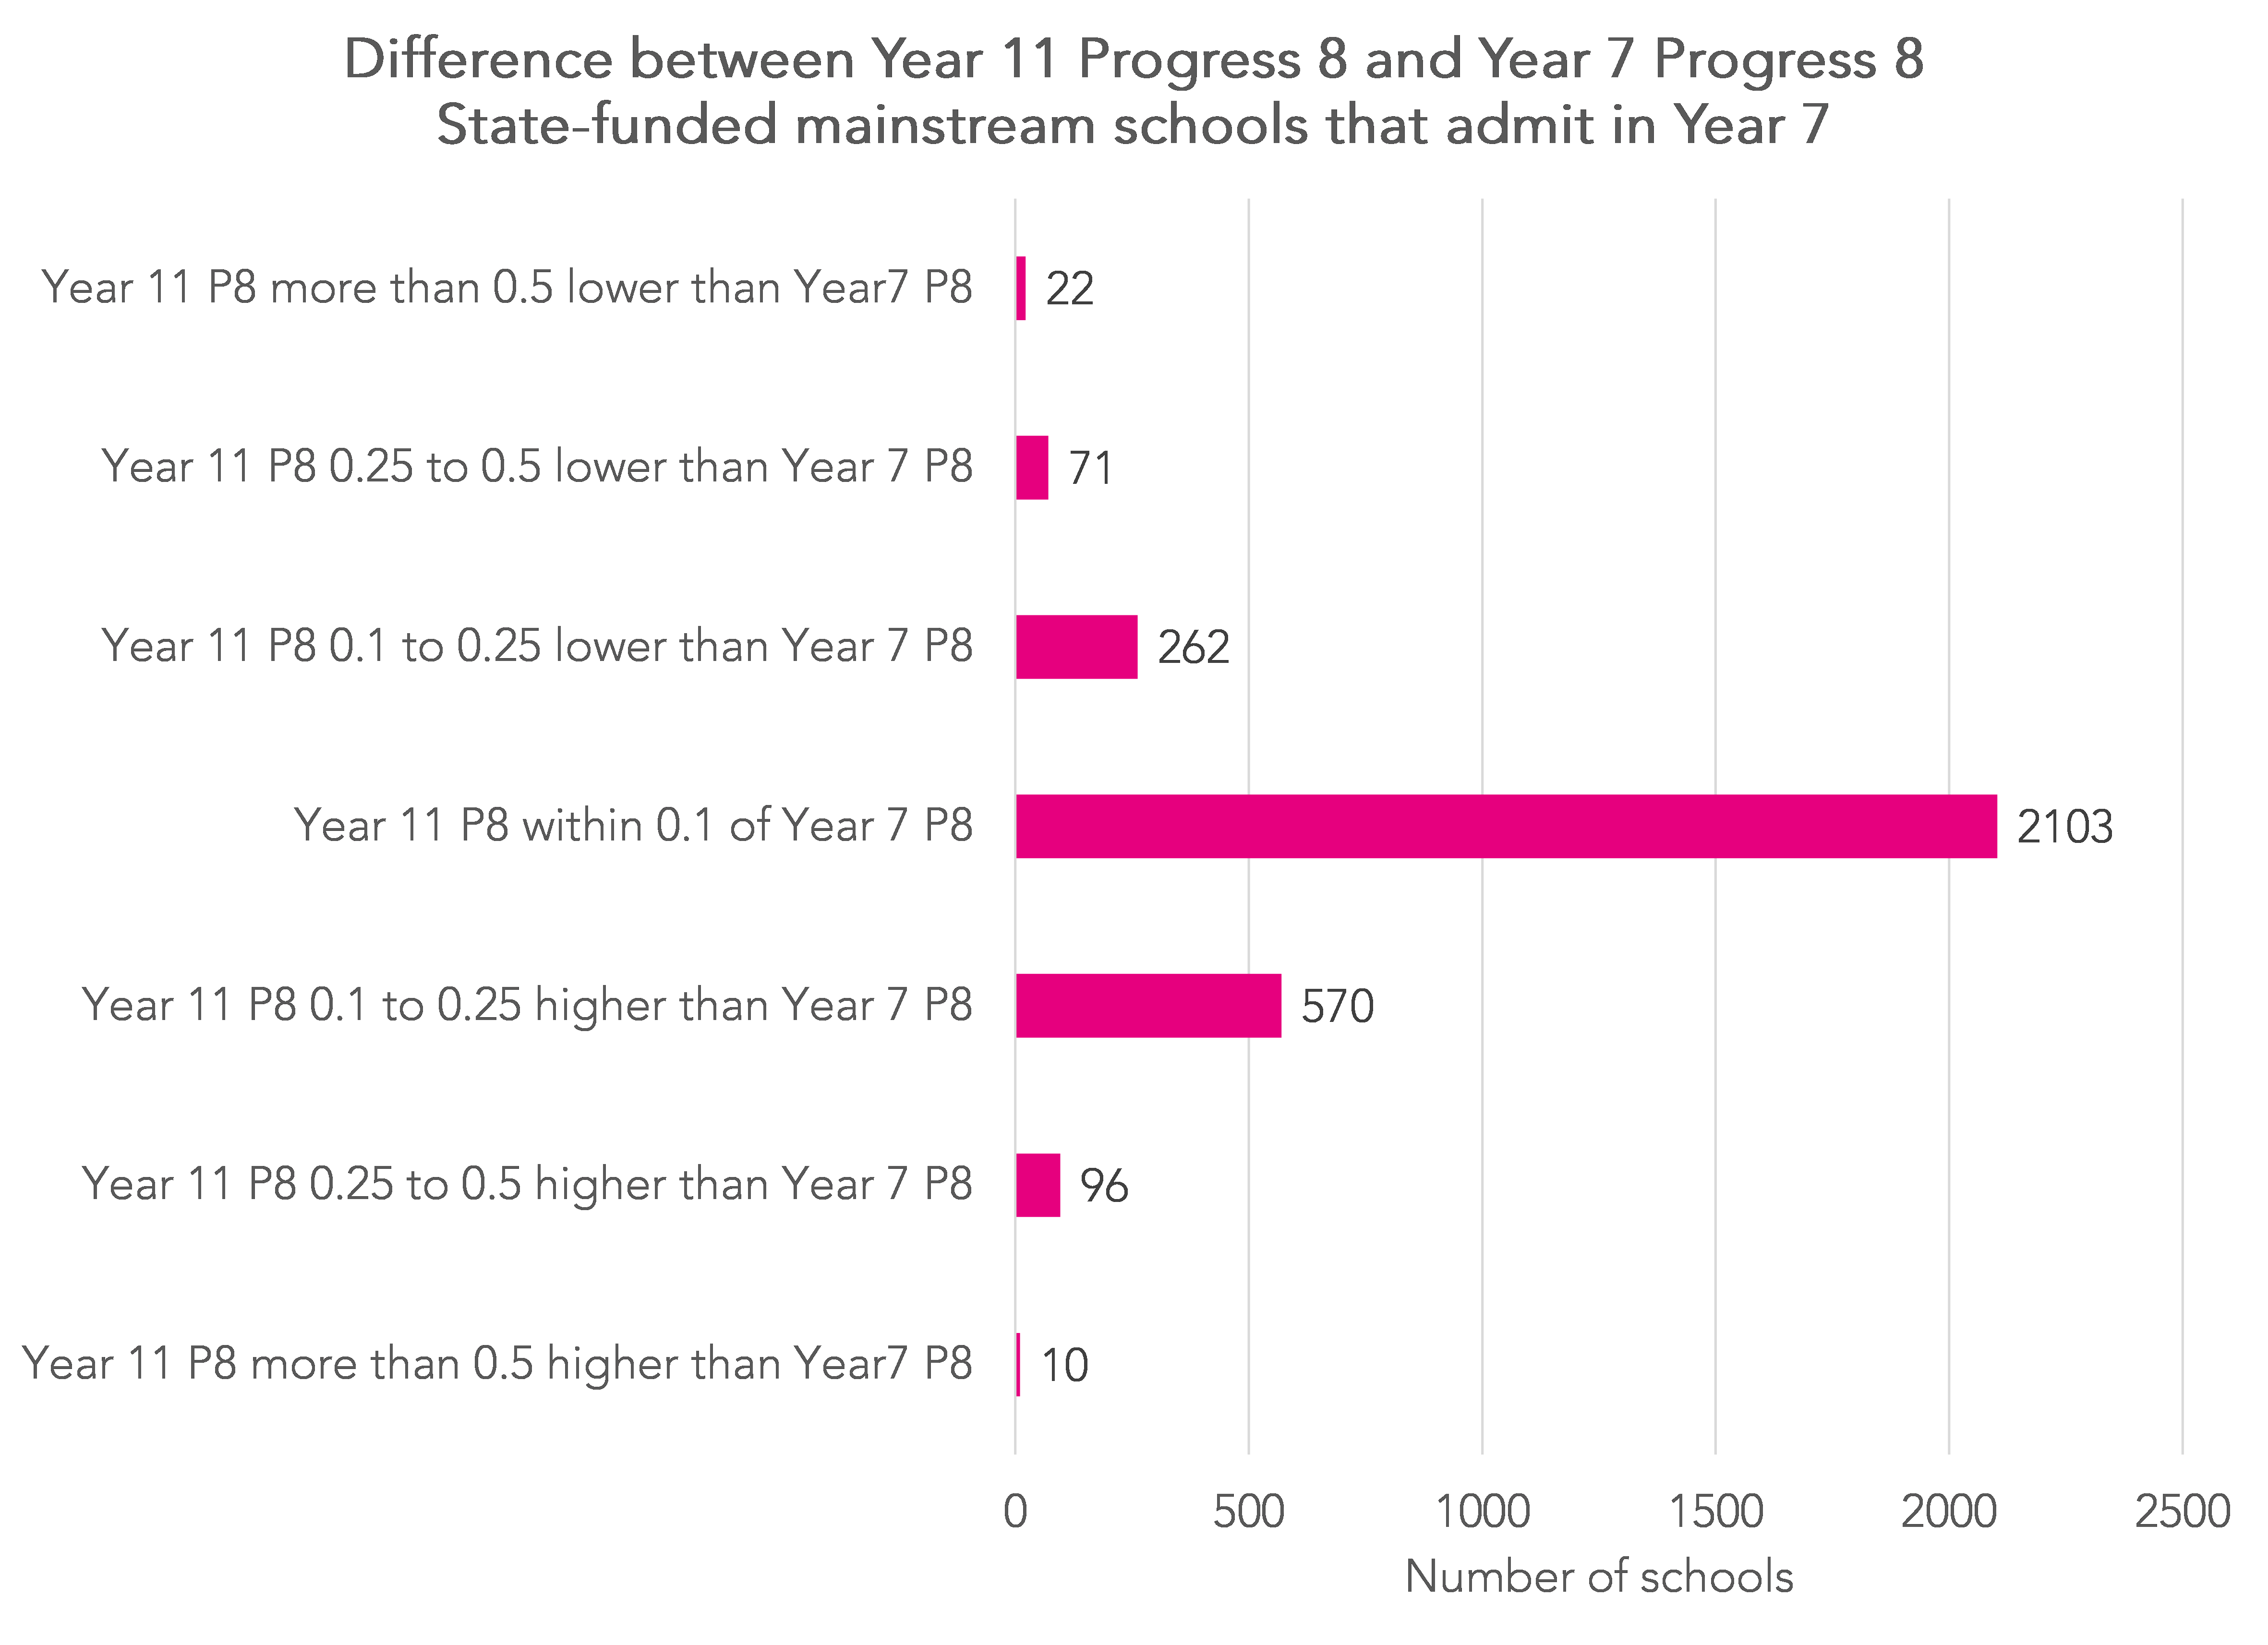
For most schools (over 2,100) the two scores are within 0.1 points of each score, the equivalent of one grade across the ten subjects that comprise Attainment 8[1].
However, the scores of some schools can be quite different.
At 10 schools, Progress 8 would be 0.5 or more lower if calculated based on the pupils who started Year 7. This is equivalent to half a grade per subject.
Conversely, at 22 schools Progress 8 would be 0.5 higher if calculated based on pupils who started Year 7.
Option 3: Reweight performance measures
For this option, we include all pupils who attend a school between Year 7 and Year 11, including those who both join and leave between Year 7 and Year 11, a group we have not considered in options 1 and 2.
Sign up to our newsletter
If you enjoy our content, why not sign up now to get notified when we publish a new post, or to receive our half termly newsletter?
However, we weight pupils according to the number of terms they spend on roll according to School Census.
A pupil who spends the whole of the period from Autumn Year 7 to Spring Year 11 will have a weight of one.
A pupil who is on roll between Autumn Year 7 and Autumn Year 9 but who leaves before Spring Year 9 will have spent 7 of a possible 14 terms on roll and so have a weight of 0.5.
In other words, we divide the number of terms a pupil is recorded as being on roll at a school between Autumn Year 7 and Spring Year 11 by 14 and use this as a weight in our calculations.
Once again we recalculate Progress 8, this time accounting for the pupil weights.
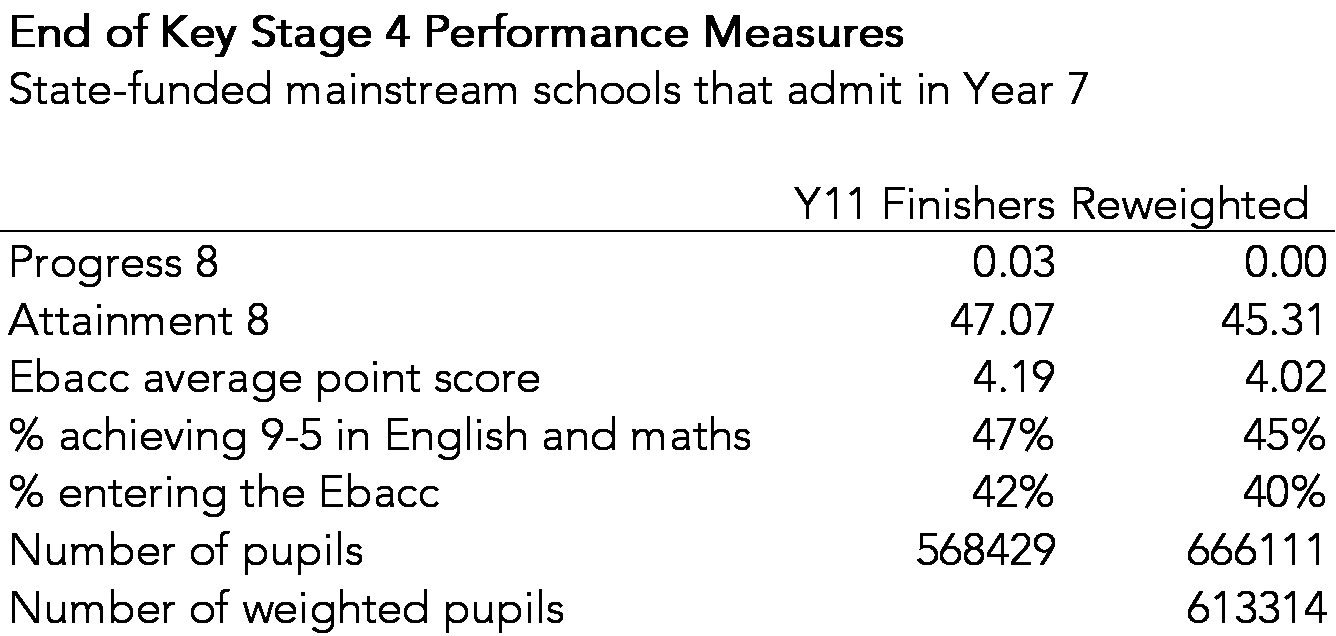
End of Key Stage 4 headline indicators following reweighting are lower than the measures for the Year 11 finishers but less so than the measures for Year 7 starters (option 2). Although there are 666 thousand pupils who appear in the cohort at least once between Autumn Year 7 and Spring Year 11, the number of weighted pupils is 613 thousand.
As for option 2, we calculate the difference between each school’s published Progress 8 score for 2023/24 with their reweighted score. These two scores are compared in the following chart.
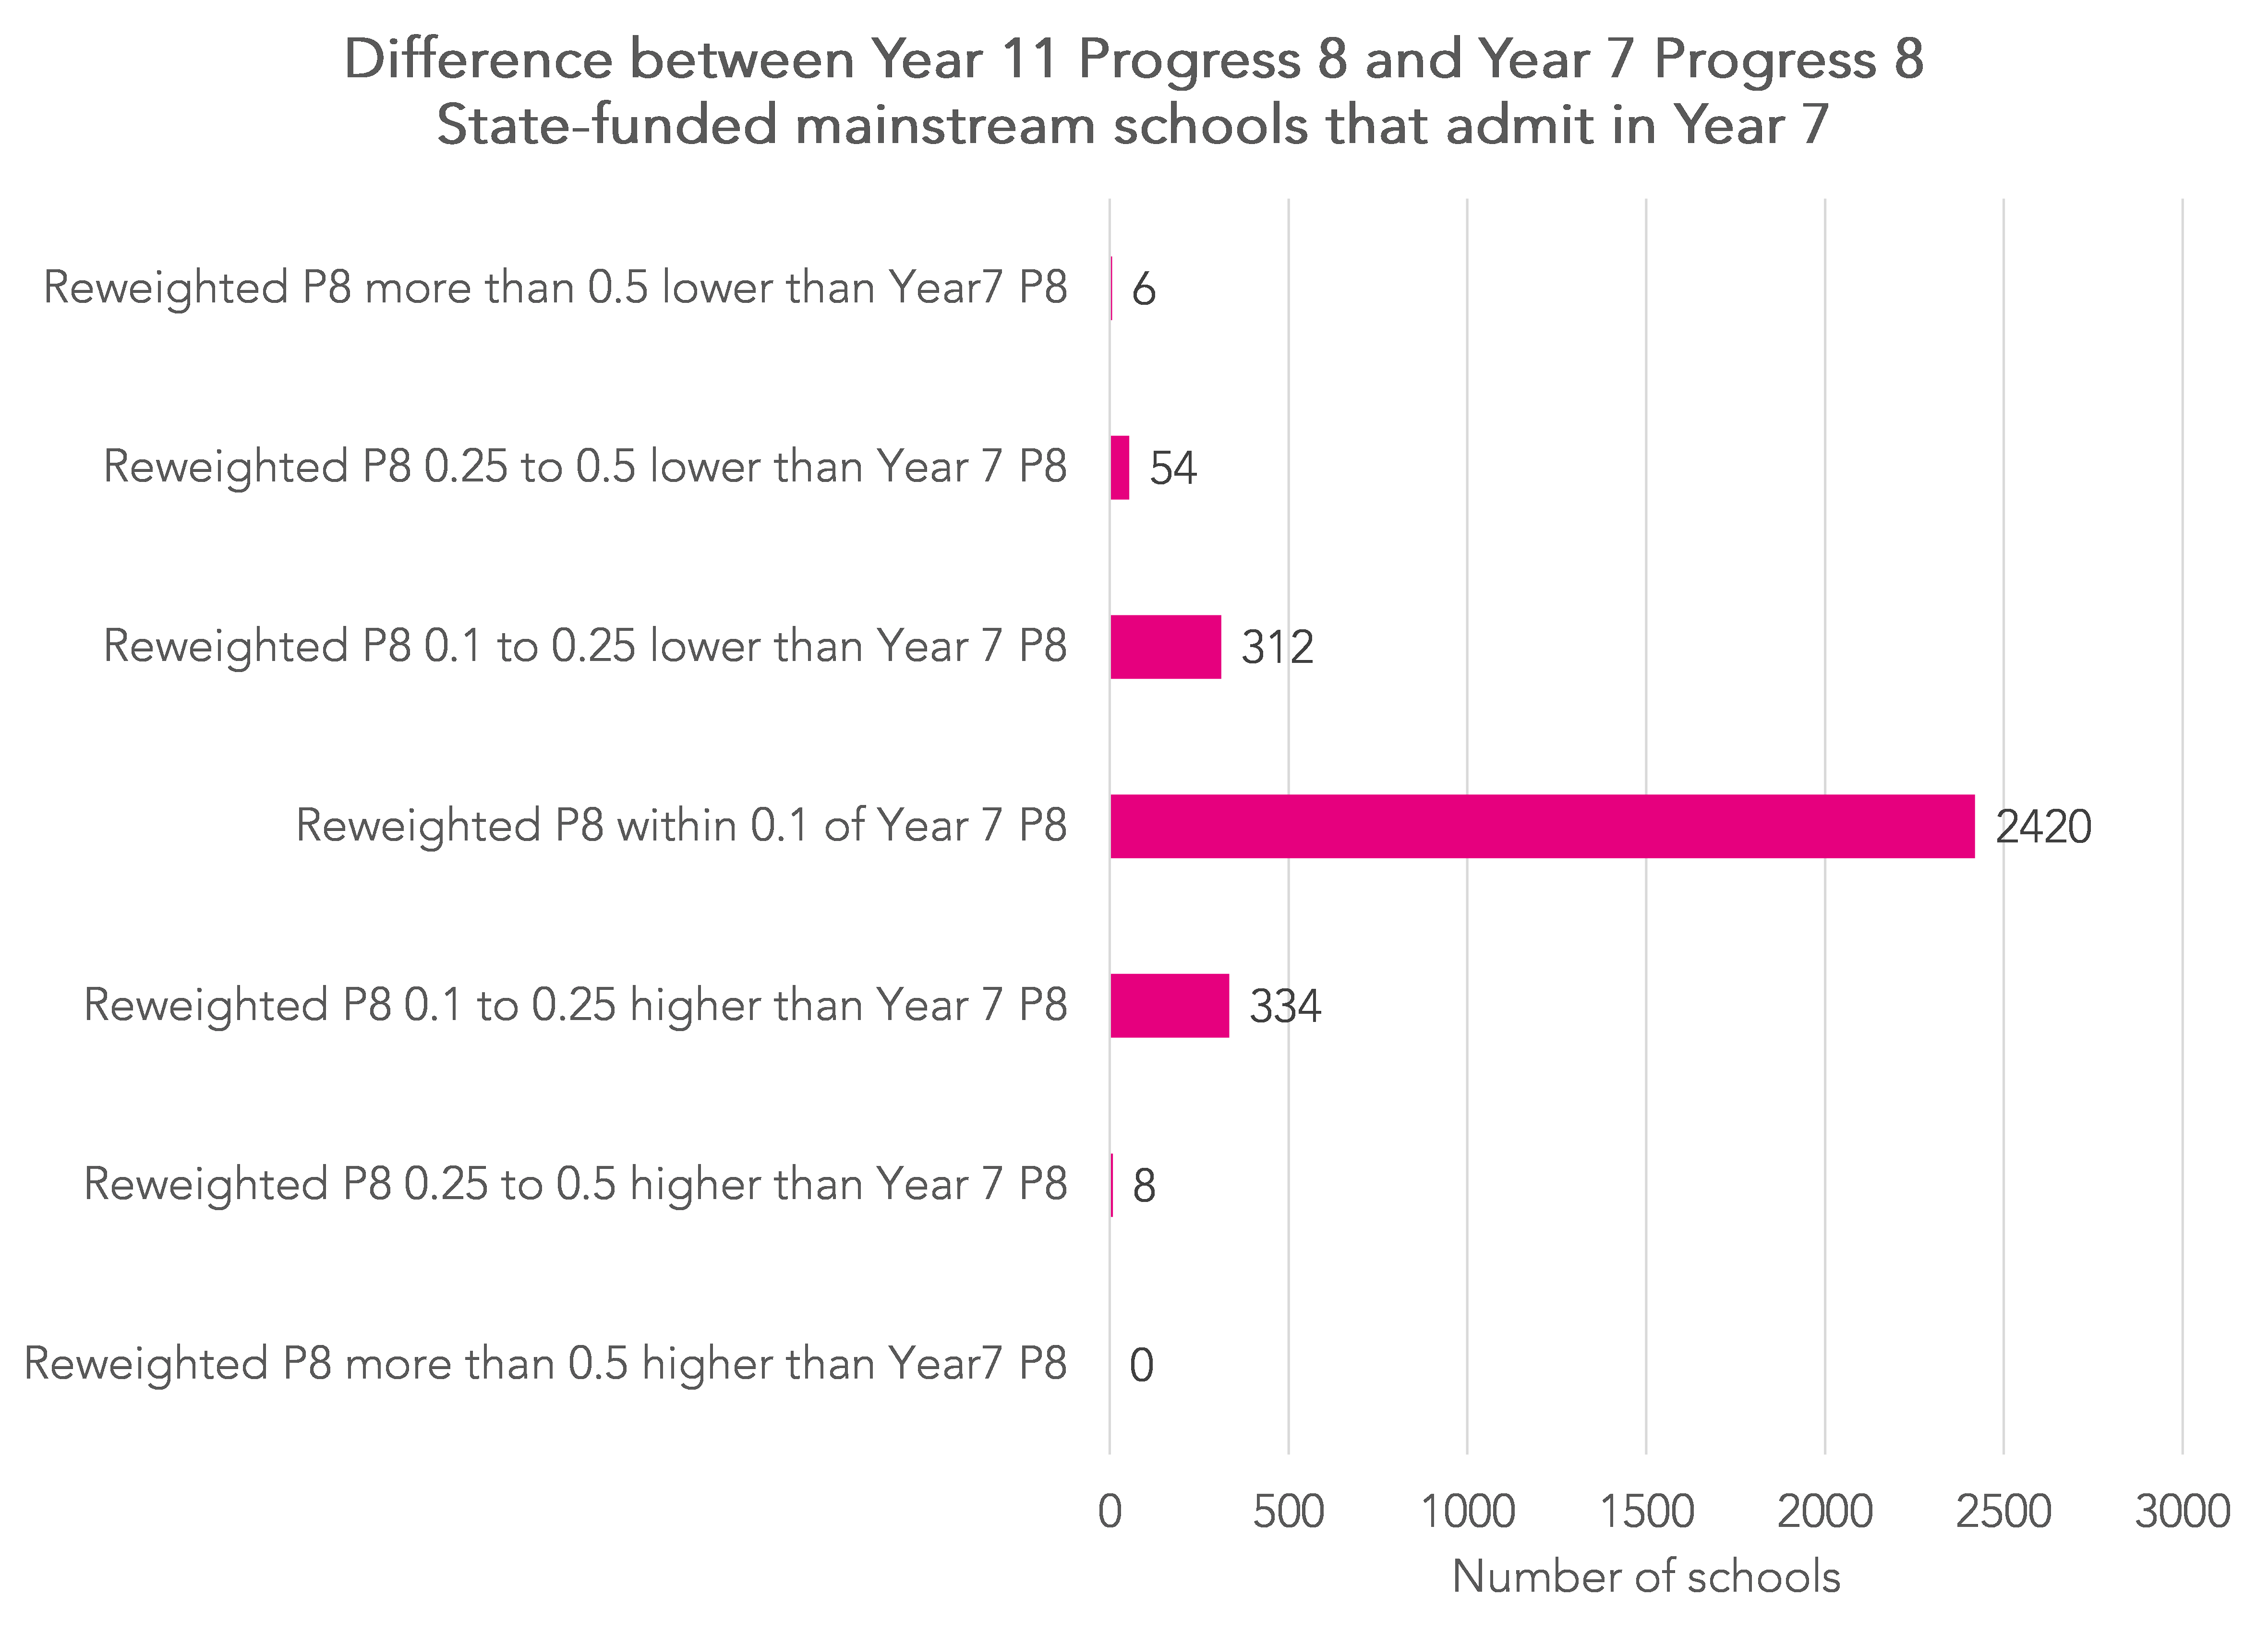
Again, for the vast majority of schools, changes in P8 score are relatively modest. 2,420 (77%) change by no more than 0.1.
Some change by a large margin. There are 6 where the reweighted score is 0.5 or lower than the published score. This could be because a lot of pupils who were subsequently low attaining left after Year 7, or a lot of pupils who made high progress joined. Either way, publishing data on pupil movements alongside the indicators will be crucial in understanding the reweighted scores.
Summing up
Across both part 1 and part 2 here we have looked at three options for reflecting pupil movements in performance measures:
- Present data on pupil movements alongside the current Key Stage 4 measures
- Calculate indicators for pupils who start Year 7 as well as those who finish Year 11
- Reweight the performance indicators based on the number of terms pupils spend on roll between Year 7 and Year 11.
Existing measures, based on pupils who finish Year 11, could still be published in addition to one of the above options.
For the vast majority of schools, the recalculated measures reveal little in the way of substantive difference compared to published measures.
However, for a small number of schools they are very different to published measures. This may occur when a school is in an area of high residential mobility (especially with high rates of emigration) or when there are schools that admit at age 14 (such as studio schools, university technical colleges and direct entry FE colleges) nearby. But it also may occur as a result of a high number of exclusions and / or managed moves.
Whether it is worth adopting any of the 3 options depends on weighing up the potential harms and benefits. If it results in fairer performance measures and more equitable practice, great.
But all measures have risks of perverse incentives. Option 3, for example, could still result in some schools trying to lose pupils to reduce their weighting in calculations.
If any option is pursued, we would suggest taking context into account. Just as school performance measures are related to pupil context so too is the propensity to move school after Year 7.
- English and maths are double-weighted, hence there are 10 slots in Attainment 8 rather than 8.
Want to stay up-to-date with the latest research from FFT Education Datalab? Sign up to Datalab’s mailing list to get notifications about new blogposts, or to receive the team’s half-termly newsletter.
[npd_ident_ons}


Leave A Comment