How do qualification entry rates differ between schools and multi-academy trusts?
Including details of a new report for FFT Aspire users.
Including details of a new report for FFT Aspire users.
Announcing a new report for secondary schools that gives a different way of looking at value added.
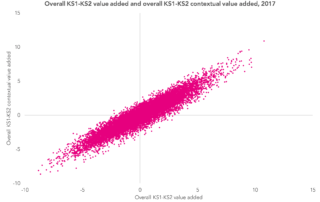
Announcing a new report for primary schools that gives a different way of looking at value added.

A look at how Progress 8 scores would change if they were calculated purely based on those pupils on-roll in Year 7.

This research explores Progress 8 scores by feeder primary school – including a resource allowing secondary schools to see their own data.
Is it real underperformance, or something else? The Datalab team take a look at the issue.
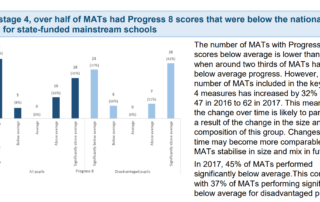
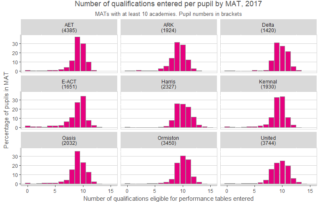
Answer: It isn’t. So why ask the question? Well, among the glut of statistics published by the Department for Education on Thursday was a statistical first release on the performance of multi-academy trusts (MATs) [PDF]. At the top of the second page was this curious chart. At first glance, this looks rather alarming. It seems to [...]
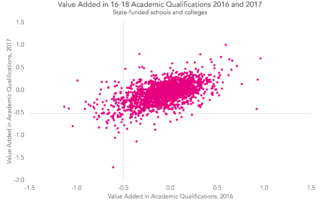
Minimum performance standards for 16-18 Level 3 (A-Level and equivalent) attainment were first introduced in 2016. Separate standards were defined for academic qualifications (primarily A-Levels) and applied general qualifications (primarily BTECs). The standards are based on value added measures that control for pupil attainment at Key Stage 4. For academic qualifications, the minimum standard in [...]
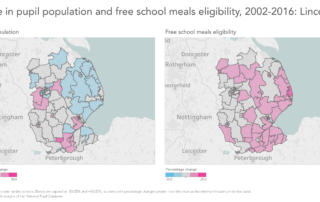
Most of the time our work involves using the National Pupil Database to examine particular aspects of the education system. However, it can also throw up interesting insights into the state of the nation more generally. Last year, we wrote about how the percentage of pupils eligible for and claiming free school meals (FSM) had [...]