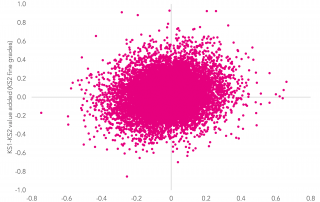
About Dave Thomson

Dave Thomson is chief statistician at FFT with over fifteen years’ experience working with educational attainment data to raise attainment in local government, higher education and the commercial sector. His current research interests include linking education and workplace datasets to improve estimates of adult attainment and study the impact of education on employment and benefits outcomes.

Pupil moves to the independent sector: why are there more late moves in some areas than others?

We have previously examined the extent to which pupils leave the roll of state-funded mainstream secondary schools. In this post, we look at one of the destinations of pupils who leave the roll of a state-funded mainstream school: the independent sector. (Today Ofsted has spoken out about unregistered alternative provision. To be clear, all of [...]

By |2016-12-07T12:55:02+00:008th November 2016|Pupil demographics, School accountability|

Should KS2 floor standards be based on an overall value added score?

From this year, the secondary school accountability framework will be predominately based around a single value added measure, Progress 8, although a small number of headline attainment indicators will be published alongside it. However, there is no single equivalent measure for primary schools. Three value added (VA) measures have been calculated in reading, writing and maths. [...]

By |2018-02-23T15:17:46+00:0026th October 2016|Exams and assessment, School accountability|

The greatest challenge

The starkest figure published in last week’s Key Stage 4 statistical first release (SFR) was the Progress 8 score for Knowsley, a small unitary authority in Merseyside. Pupils attending its six secondary schools achieved on average almost a grade per subject lower than pupils with similar prior attainment elsewhere in the country. All six schools [...]

Provisional KS4 data 2016: What can we learn from destinations data?

Alongside the publication this morning of data covering EBacc entries and Attainment 8/Progress 8, a statistical first release (SFR) has been published on the destinations of the 2014/15 Key Stage 4 cohort. This shows that 91 per cent were in a “sustained education destination” during the first two terms of 2015/16, and 94 per cent [...]

By |2017-10-23T12:43:42+01:0013th October 2016|Post-16 provision, Pupil demographics, School accountability|

Provisional KS4 data 2016: Low take-up of languages will make the government’s 90% EBacc goal hard to achieve

This is the seventh year that English Baccalaureate (EBacc) data has been published. It was first launched in January 2011 when retrospectively applied to 2010 Key Stage 4 data. Since then, much has been written about its impact on take-up of creative subjects, its suitability for less academically-gifted pupils, and even whether it risks failing [...]

By |2018-09-27T18:01:01+01:0013th October 2016|Exams and assessment, School accountability|

How should we define KS4 floor standards?

The question of how floor standards are defined is one that – to all heads, but particularly those who might be at risk of not meeting them – is obviously of great importance. And there are clearly numerous ways in which a floor standard could be defined. (We leave to one side the question of [...]

By |2017-10-23T12:44:21+01:004th October 2016|School accountability|

What Progress 8 tells us about how the curriculum has changed in schools

Secondary schools today received provisional Progress 8 data for 2016. This is a significant milestone given the importance attached to Progress 8 in the secondary school accountability framework. The rest of us will have to wait until provisional data is published in October. In the meantime DfE has published some very useful technical information that [...]

By |2016-12-07T12:55:08+00:0026th September 2016|Exams and assessment, School accountability|

How did this year’s Key Stage 2 reading test compare to last year’s?

So now we know. The new Key Stage 2 tests in reading and maths were harder than their predecessors. And there was also substantial variation in writing teacher assessment between local authorities. In this post we examine which pupils met the expected standards in 2016, and how that compares to 2015. We also look at [...]

Go to Top