GCSE results 2018: How widespread is early entry in English language and English literature?
The second of two preview posts ahead of this year's GCSE results day.
The second of two preview posts ahead of this year's GCSE results day.
The first of two preview posts ahead of this year's GCSE results day.
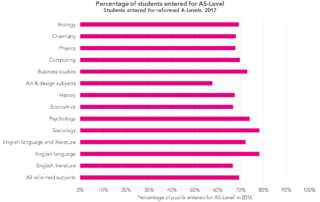
A detailed look at which pupils seem to have taken AS-Levels this year.
Our first look at this year’s data.
The second of two preview posts ahead of this year's A-Level results day.
The first of two preview posts ahead of this year's A-Level results day.
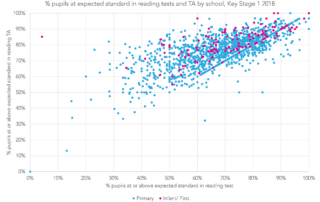
What we can learn from FFT's KS1 Early Results Service.

Looking at inspections since the introduction of Progress 8.

New analysis of the School Workforce Census and responses to Teacher Tapp survey questions reveals four reasons why the pay gap emerges between male and female teachers.