The relationship between Progress 8 and Ofsted judgments for disadvantaged schools
Looking at inspections since the introduction of Progress 8.

Looking at inspections since the introduction of Progress 8.
This is part three in a series of blogposts exploring long-term disadvantage. Other posts in the series can be found here. The previous post touched on the relationship between ethnicity, disadvantage and KS2-to-KS4 progress. It made a simple distinction, with white British pupils in one group and all other minority ethnic pupils in another group. [...]
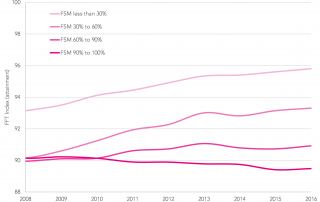
This is part two in a series of blogposts exploring long-term disadvantage. Other posts in the series can be found here. The first post in this series showed how the attainment and progress of pupils varied according to how often they had been FSM-eligible – with pupils who are FSM-eligible on almost every occasion (90% [...]
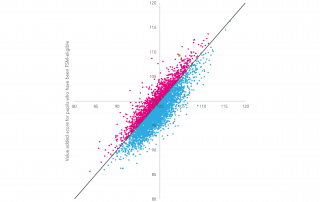
This is part one in a series of blogposts exploring long-term disadvantage. Other posts in the series can be found here. Pupil Premium pupils are defined as those claiming free school meals at least once in the previous six years. Given that there are three school census returns each year, the Pupil Premium group varies [...]
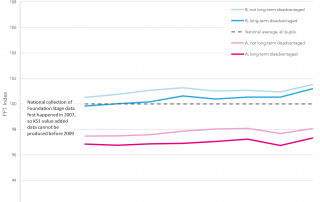
Figures came out recently that showed that the proportion of children eligible for free school meals (FSM) was at its lowest level since 2001 [PDF], when pupil-level information on this was first collected nationally. This is likely to be for a combination of reasons: an economy that has improved since the early 2010s, meaning fewer parents [...]

One of the most interesting figures in Tuesday’s statistical first release on pupils in state-funded schools was the fall in the percentage of pupils eligible for free school meals to the lowest level recorded since the introduction of the School Census in January 2002. Of course, it's well-known that free school meal eligibility is an [...]
FFT research paper number five explored how the attainment and the value added scores of children varies by the amount of time which they have been eligible for free school meals. Download the report here [PDF].