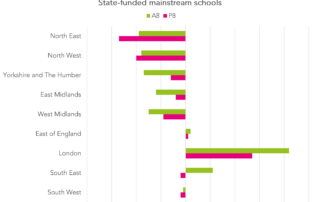
Differences in school performance are local not regional (mostly)
The north/south divide in school performance is mostly a distraction. Most of the variation in school performance is very local, between nearby schools.
The north/south divide in school performance is mostly a distraction. Most of the variation in school performance is very local, between nearby schools.
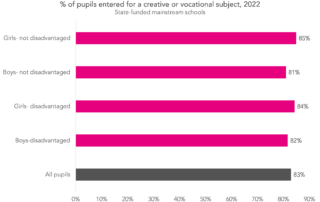
Labour have announced plans to include a "slot" for a creative or vocational subject in Progress 8. We investigate the possible impact.
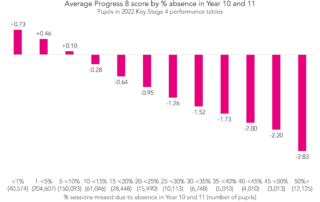
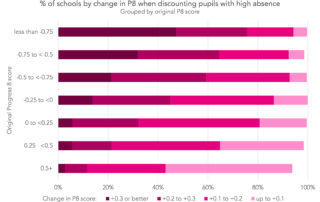
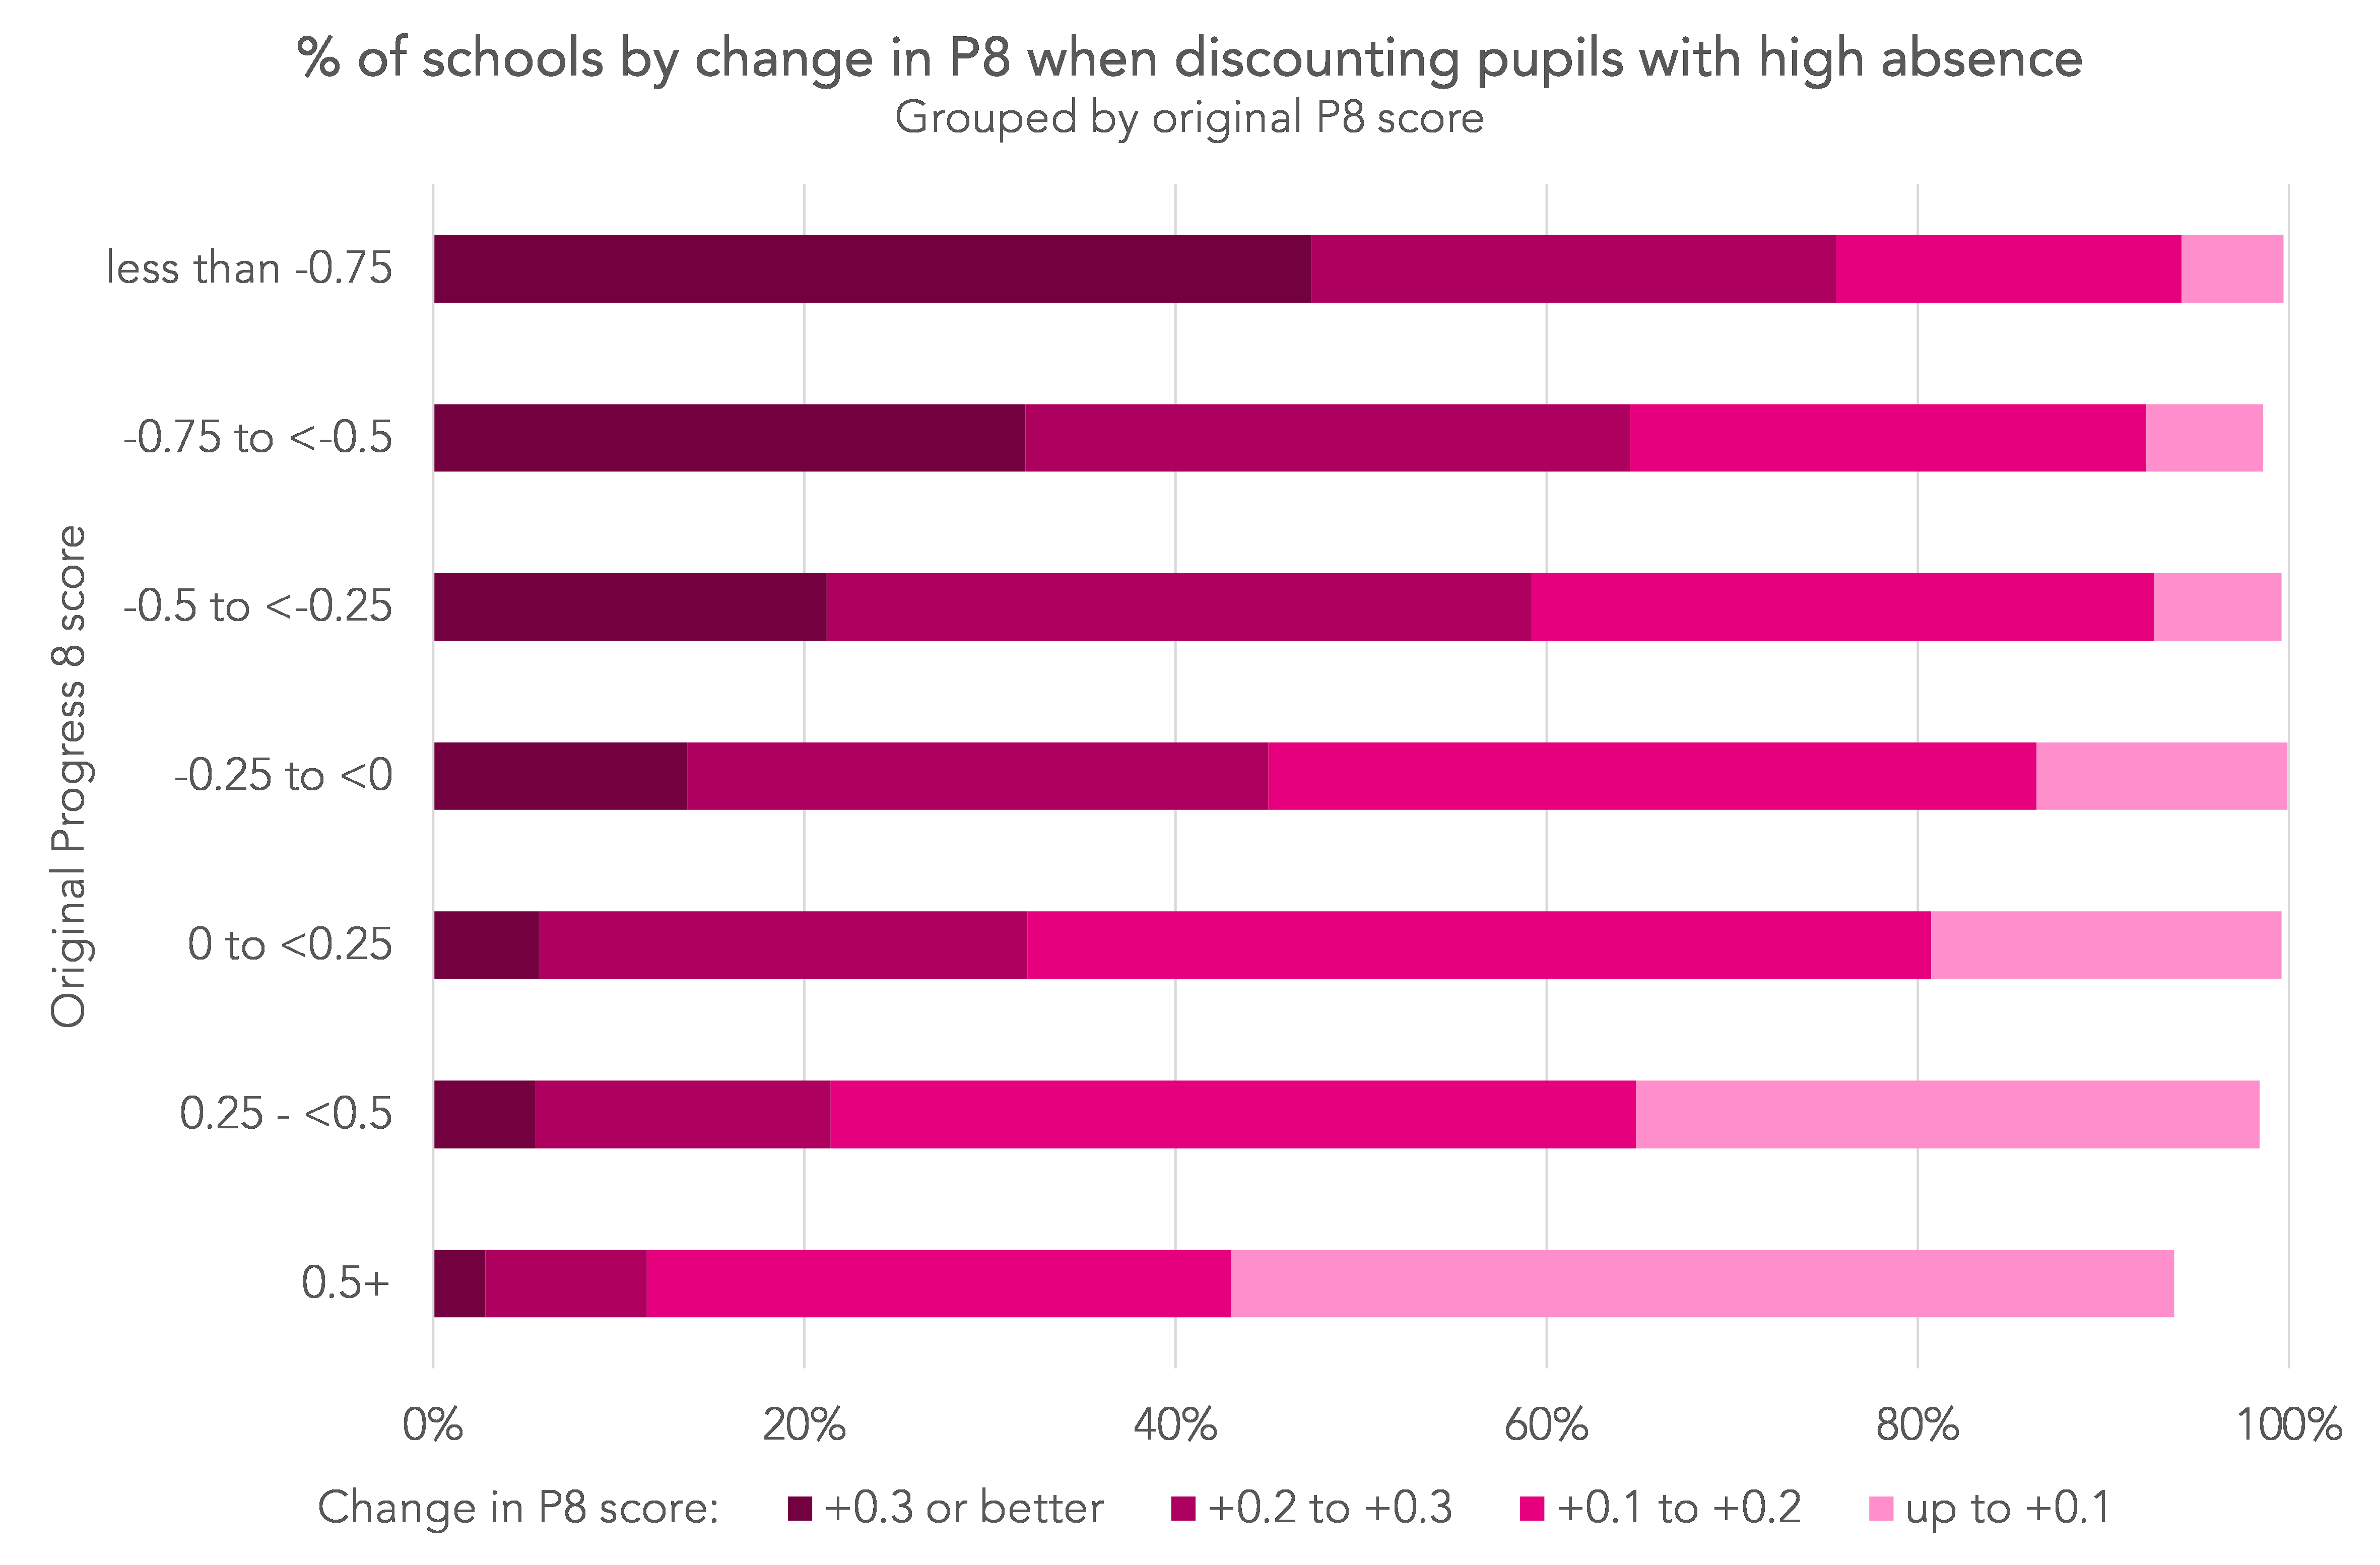
We show the correlation between pupil absence in Years 10 and 11 and Progress 8 scores and explore how this relates to the disadvantage gap
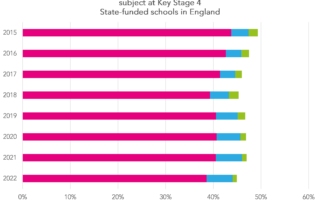
There has been a small decrease in the proportion of young people entered for one or more qualifications in creative subjects since Progress 8 was introduced in 2016. But is Progress 8 to blame?
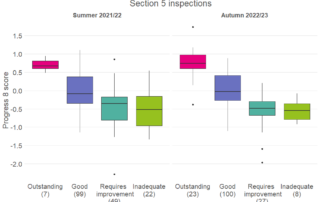
Both inspection outcomes and Progress 8 scores are imperfect proxies of school quality. We examine how strongly they are related.
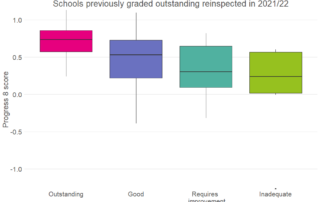
104 previously outstanding secondary schools were re-inspected last year- and just 25% kept their outstanding rating.
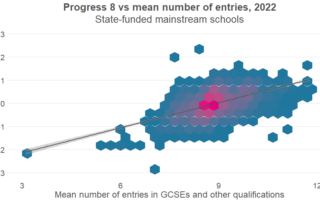
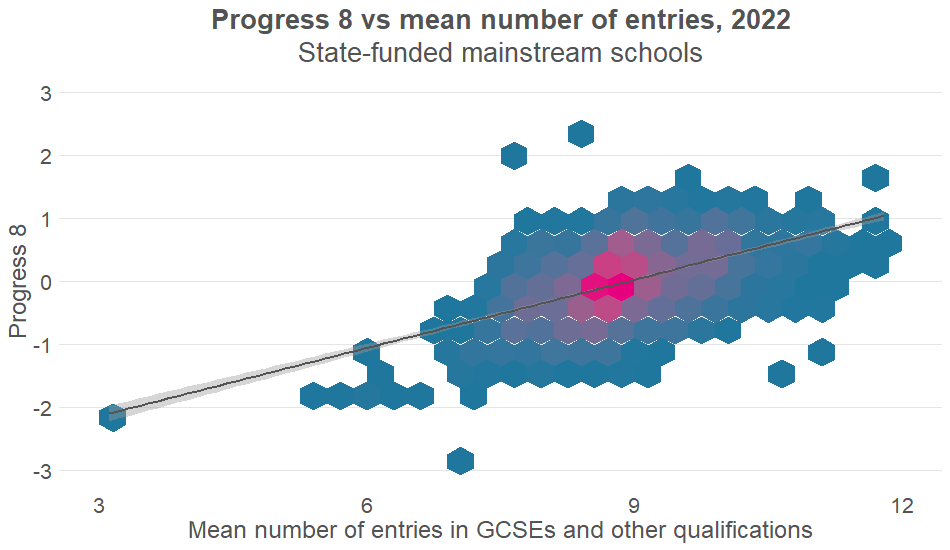
Progress 8 scores are positively correlated with the average number of entries in GCSEs and other approved qualifications. We dig into the relationship in more detail.

In the second part of a two-part post, we look at what the latest Key Stage 4 data tells us about the national picture.

In the first part of a two-part post, we look at what the latest Key Stage 4 data tells us about schools.