This is the first part of a two-part post on the latest Key Stage 4 data, published earlier today. You can read the second part here.
Today the government has published the latest data on secondary school performance. This is, of course, the first time that performance data has been published at school level since before the pandemic.
The government is being cautious about reading too much into the published measures of performance this year. They have even renamed their website from compare school performance to find school performance data. We know that the disruption caused by the pandemic varied hugely between schools – we’ve written extensively about the effects on attendance, for example.
So this year’s Progress 8 scores may be more useful as a proxy for how much disruption schools faced than as a measure of school performance.
Having said all that, let’s see what we can learn from today’s release.
Progress 8 scores haven’t changed that much since 2019
We would expect schools’ Progress 8 scores to change over time, and certainly over a period of three years.
The chart below shows how this year’s Progress 8 scores compare to the last set of published scores from 2019. To get an idea of how much we’d usually expect scores to have changed over a three year period, we also show the same chart comparing scores in 2016 to 2019.
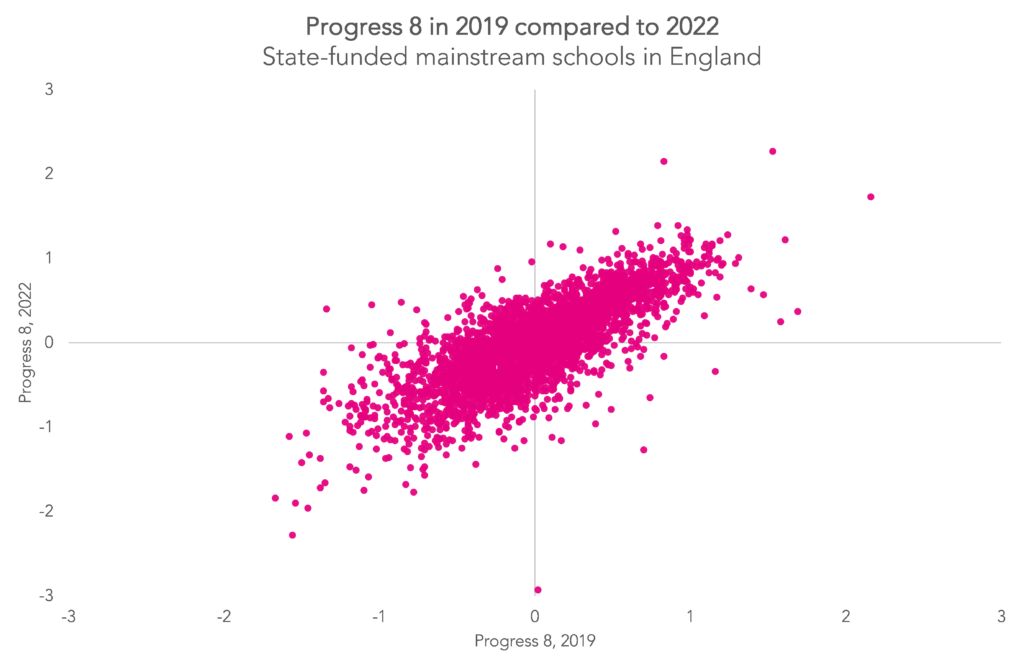
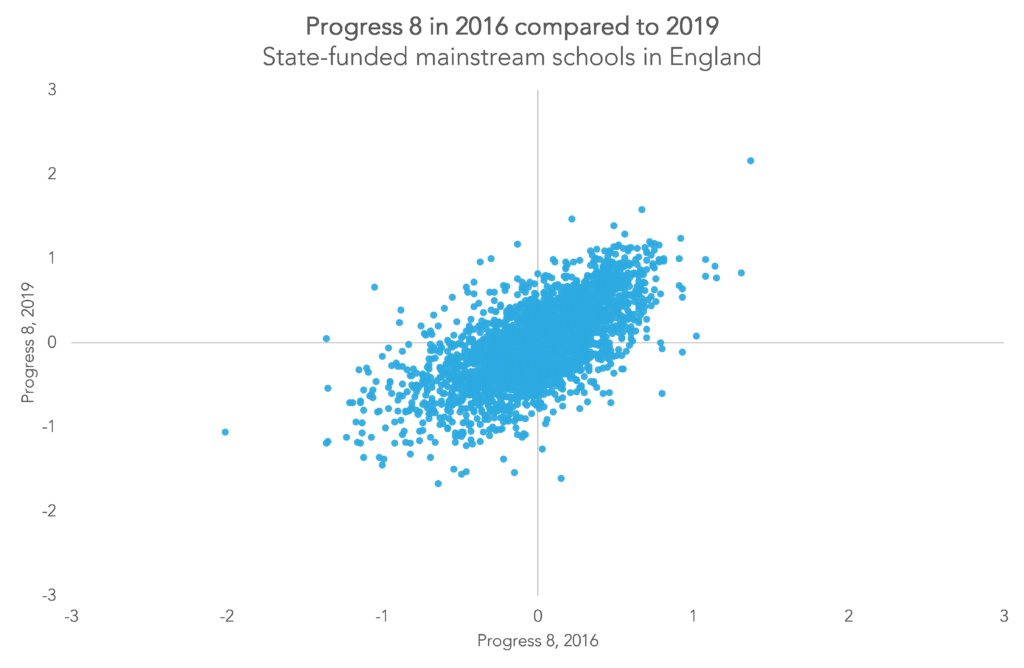
The correlation between this year’s scores and the 2019 scores is 0.77 – while the correlation between the 2019 and 2016 scores is a little lower, at 0.66.
This may be partly explained by the fact that 2016 was in some ways an exceptional year – qualification reforms were kicking in and Progress 8 was a new measure. To try and control for some of that, we’ve also looked at the correlations for just the English and maths elements of Progress 8.
But these correlations show a similar pattern, with higher correlation (0.76) between this year and 2019 than between 2019 and 2016 (0.63).
So despite the disruption caused by the pandemic, there appears to be less change in schools’ Progress 8 scores than in the past.
Having said that, there have been methodological changes to Progress 8 to incorporate the switch the baseline measure from the “old” Key Stage 2 tests measured in levels to the “new” tests measured in scaled scores.
Progress 8 scores for most schools (still) aren’t that different
We’ve said before that Progress 8 scores for most schools aren’t that different. And it’s true this year as well.
These charts show the Progress 8 scores of schools by rank, this year and in 2019. Schools are ranked from lowest score on the left to highest score on the right.


In both years, the majority of schools had Progress 8 scores between -0.5 and 0.5. There’s more variation between the scores for schools ranked at the very top or very bottom.
Scores have changed more for the lowest ranked schools
As shown below, many schools’ scores haven’t changed that much since 2019 – as we’d expect given we’ve already talked about the high correlation between this year’s scores and the 2019 scores.[1]
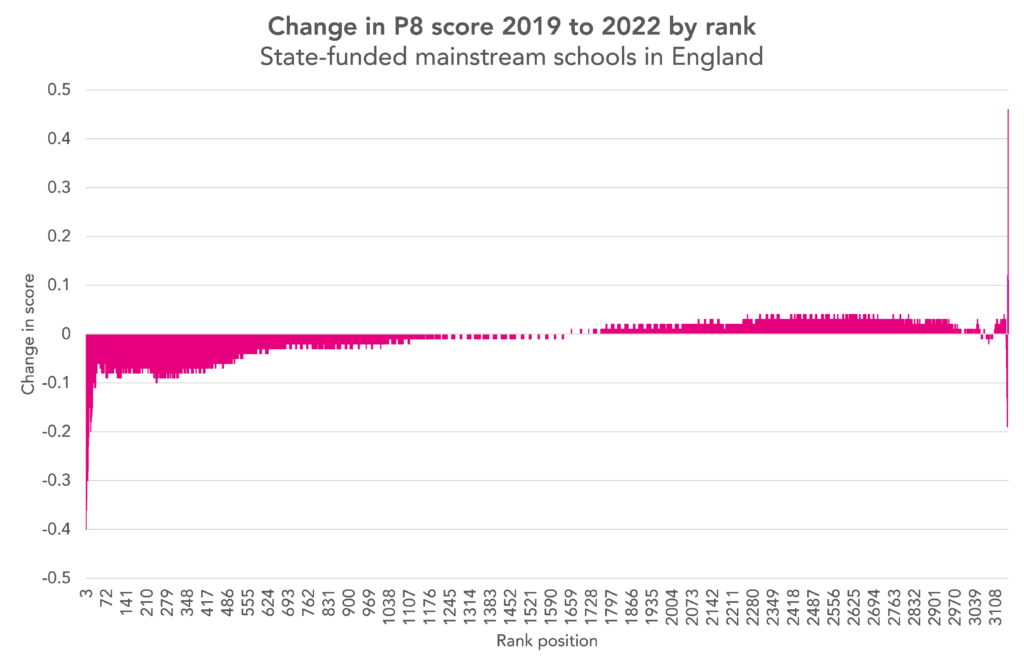
We can see here that the schools with the biggest changes in scores were those ranked at the lower end this year. The schools ranked in the top and middle had – with a few exceptions – quite similar scores in 2019.
When we look back at the change in scores between 2016 and 2019, we see a somewhat different picture.
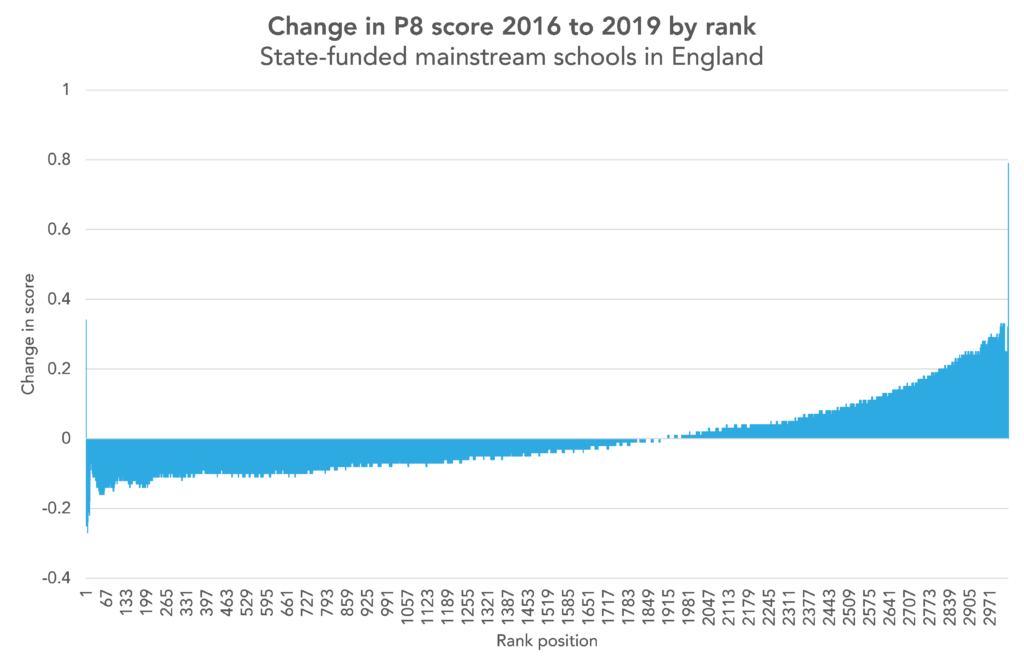
Schools with high rankings in 2019 tended to have improved on their scores in 2016 by quite some distance. Similarly, those with low 2019 rankings tended to have lower scores than in 2016. But the absolute difference in scores was higher for those with high rankings; they tended to have improved their scores by more than lower ranking schools’ scores had fallen.
Schools with a higher proportion of disadvantaged pupils tend to have lower P8 scores
Schools with a higher proportion of pupils eligible for free schools meals are more likely to get a low Progress 8 score, as shown below.
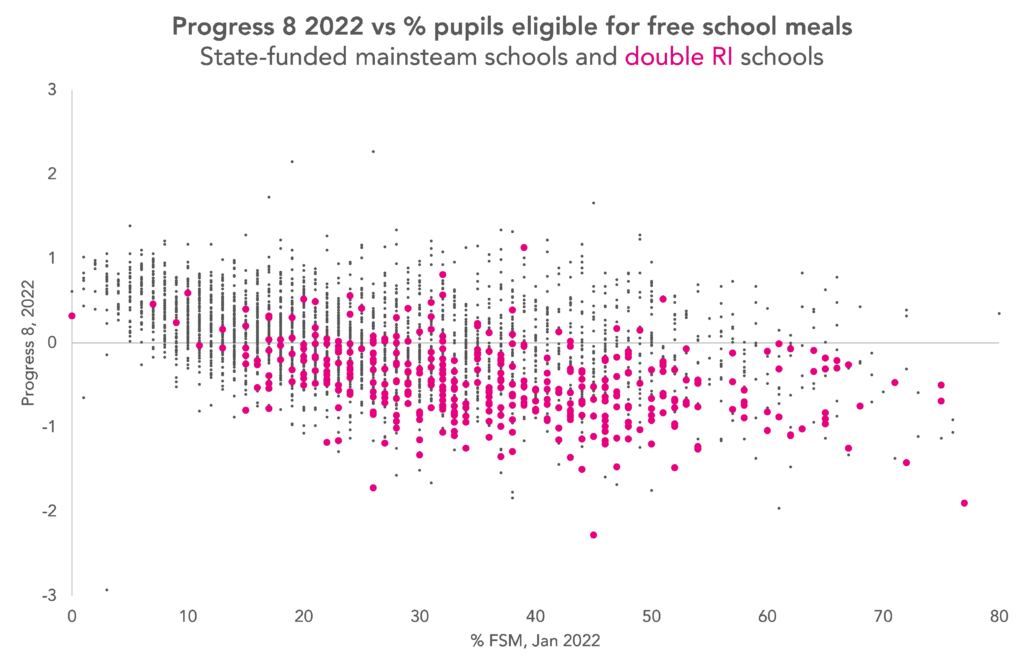
On the chart, we’ve picked out those schools that have received two consecutive ‘requires improvement’ Ofsted ratings. These schools – which also tend to have low P8 scores – are driving a lot of the correlation between the proportion of FSM pupils and P8 scores.
Of course, this is nothing new. The picture in 2019 was similar.
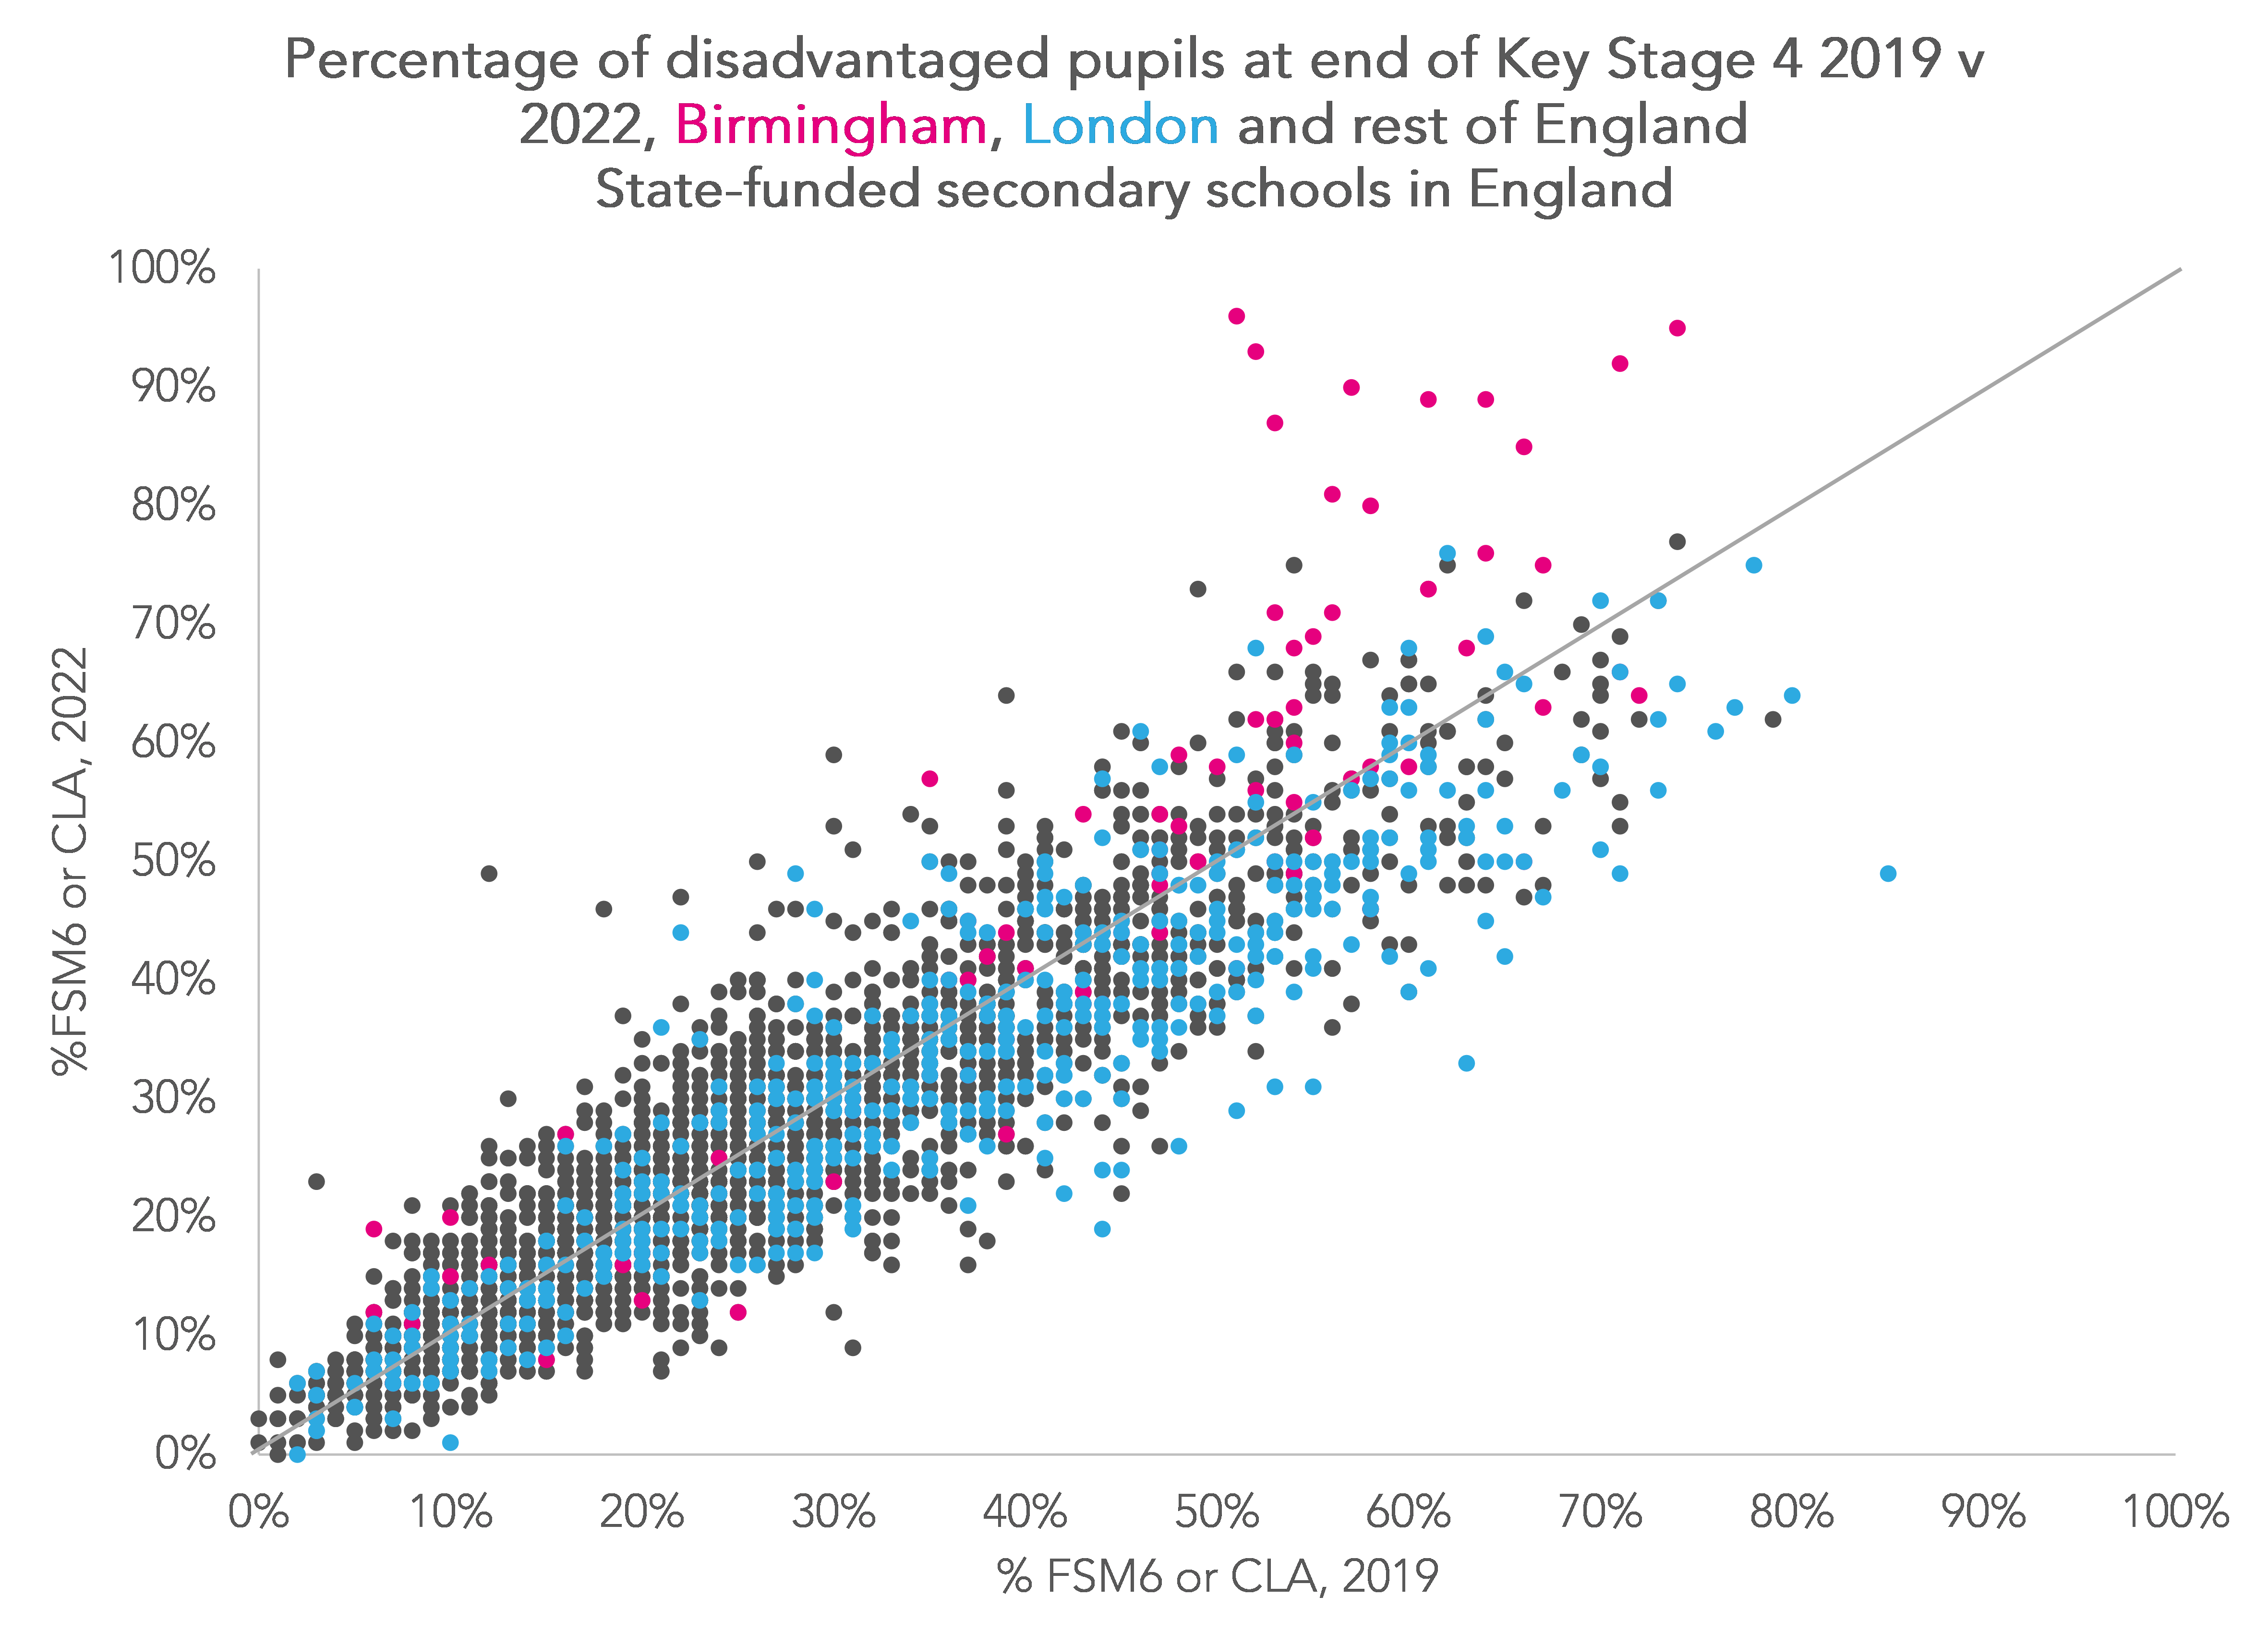
We should note that recent changes to free school meals eligibility mean that the group claiming free school meals isn’t directly comparable across years. We discuss this in more detail in the second post in this series.
But we also note that although the percentage of disadvantaged pupils nationally fell slightly between 2019 and 2022, there was a group of schools in Birmingham where the percentage of disadvantaged pupils increased markedly.
Schools with lots of early entries have low P8 scores, mixed picture for others
We wrote earlier this year about the decision to discount qualifications taken early from performance tables. We concluded it would have a small impact on results overall, but a large impact for particular schools.
The chart below shows the average Progress 8 score for pupils in schools with differing rates of early entry.
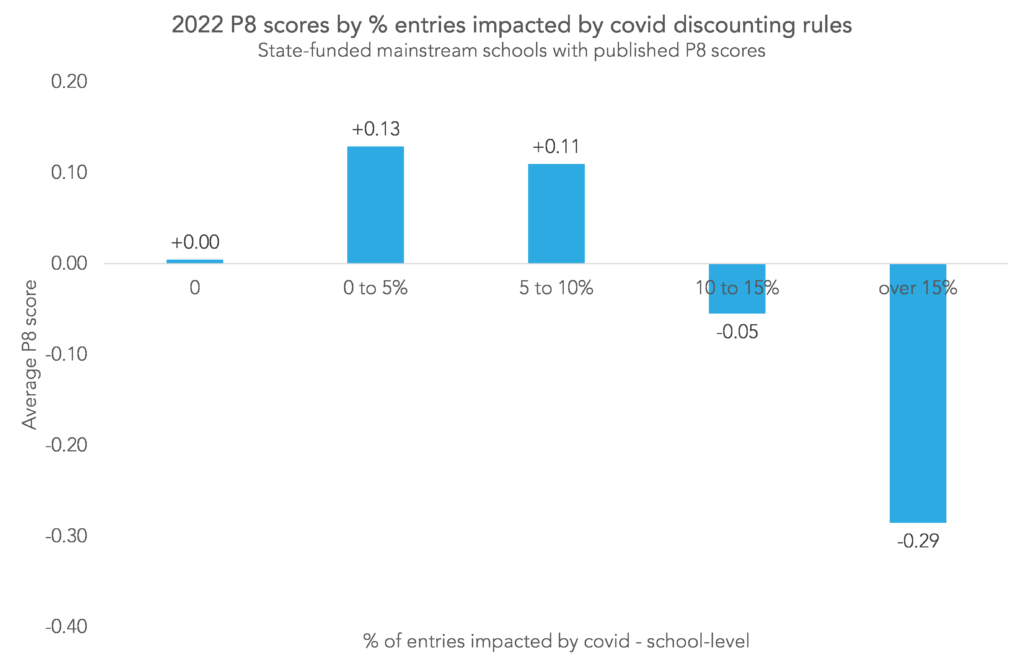
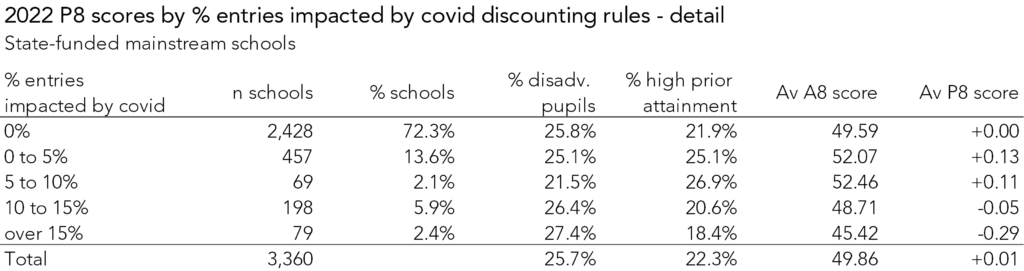
The results seem a little strange. We might have expected that schools with a greater proportion of early entries would have lower P8 scores. And indeed this is the case for schools where at least 10% of entries were early. But schools with a small proportion of early entries actually saw higher P8 scores than schools with no early entry at all.
This is likely related to the characteristics of pupils in these schools. Adding in some extra details, we see that schools with a small proportion of early entries tended to have a higher proportion of pupils with high prior attainment than is the case nationally, and a slightly lower proportion of disadvantaged pupils.
Read the second post in this series, which looks at the national picture, here.
[1]: We have excluded schools with extreme differences in score of above 0.5 or below -0.5.


Are the “progress 8 score by rank” charts the wrong way round? As in, 2019 chart is 2022 data and vice versa
Hi Ben. The good news is that the charts were the right way round. The bad news is that, on checking, we found that the 2022 chart was missing a chunk of the most highly ranked schools. The chart’s now been updated to include these schools – hopefully it now looks more like what you were expecting to see!
In the “progress 8 by rank” charts, is the change in P8 from 2019 to 2022 or vice versa? A negative surely can’t mean an increase in P8 over the period, can it? Are the ranks highest to lowest ranking schools or the other way round?
Hi Alex. Perhaps confusingly, the school with the *lowest* P8 is ranked as 1 on these charts. And the change is from 2019 to 2022. So if their P8 score went down between 2019 and 2022, we’d probably expect their rank position to be lower in 2022 than it was in 2019. Might be worth us redoing them with the ranks the other way around TBH!
Hi Alex. It shows the [2022]-[2019]. So a positive number indicates a rank position with a higher score in 2022 than in 2019. Schools are ranke d from lowest to highest (so lower ranks to the left, higher ranks to the right). We should have made this clearer so have amended the text in the post.