*This post was updated on 16 November 2022 to correct an error in the average Progress 8 score by gender, disadvantage status and year table.*
This is the second part of a two-part post on the latest Key Stage 4 data, published earlier today. You can read the first part here.
Today the government has published the latest data on secondary school performance, along with other data on KS4 performance, including breakdowns of performance by pupil characteristics. In this post, we’ll look at what we can learn from this data at the national level.
The disadvantage gap has widened again, especially for girls
The DfE’s own figures show that the KS4 disadvantage gap index has widened again this year, and is now at its highest level since 2012.
The DfE measure is based on changes in average rank in English and maths grades between disadvantaged pupils and their peers. Consequently, the figures are hard to interpret. However, we can look at changes in average grade in the subjects that go into the Attainment 8 measure, which is then used in Progress 8.

This shows that gaps in English and maths increased by around 0.1 of a grade (i.e. 10% of a grade). There was a slightly larger change (0.2) in the “open” slots consisting of subjects not counted in the English, maths and EBacc slots.
Looking at other pupil characteristics, analysis of average P8 scores by gender and disadvantage suggests that girls have been particularly affected.
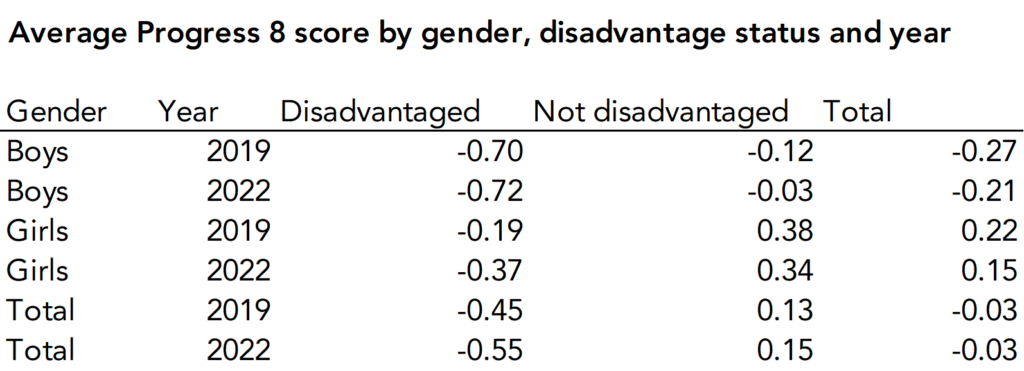
The average score for disadvantaged boys has fallen by just 0.02, from -0.7 to -0.72. While the score for disadvantaged girls has fallen by 0.18, from -0.19 to -0.37.
But girls’ Progress 8 scores remain far higher than boys’ on average.
But we should sound a note of caution when comparing to previous years. Recent changes to free school meals eligibility mean that the group claiming free school meals isn’t directly comparable across years.
As a result (at least in part), the percentage of pupils nationally classified as disadvantaged this year (26.3%) was lower than in 2019 (26.5%). This seems rather surprising given the pandemic. Perhaps it just shows how stringent the eligibility criteria for free school meals are nowadays.
Regional differences haven’t changed much
We had feared that regional differences had widened, as we’ve shown that Year 11 pupils in some regions – the North East, North West and Yorkshire – missed more school during the pandemic than those in others.
But average P8 scores at the regional level have changed very little since 2019, as shown below.

Existing differences between regions remain, but do not appear to have widened during the course of the pandemic.
The relative popularity of non-GCSE subjects
This year’s Key Stage 4 statistics show the relative popularity of GCSE and non-GCSE subjects in state schools in England.
We’re used to seeing data on numbers of entrants in different GCSE subjects when JCQ publish national data on results day. But data on non-GCSE subjects, such as BTEC and OCR national certificates, is harder to come by.
The 20 most popular GCSE subjects in mainstream schools this year are shown below. EBacc subjects reigned supreme – history was the most popular non-core subject (267k entries), with geography close behind (261k). The only non-EBacc subject in the top 10 was religious studies (207k).

There were many fewer entries to non-GCSE subjects across the board. The most popular non-GCSE subject was OCR computer appreciation / introduction (42k), which had fewer entries than the twentieth most popular GCSE – drama and theatre studies (47k).

If we aggregate all non-GCSE qualifications at subject level (as suggested by a helpful commenter – so that, for example, BTEC 1st in sports studies and BTEC sports studies are grouped together as sports studies) the picture changes slightly. Sports studies, the most popular non-GCSE subject, had around the same number of entries (65k) as GCSE PE (63k). Non-GCSE qualifications in computer appreciation had around the same number of entries (61k) as GCSE art (62k).

EBacc entries remain low
The government may have bigger things to worry about at the moment, but their ambition to see 75% of pupils taking the EBacc by 2022 has not been realised. Just 38.7% were entered for the EBacc this summer, the same figure as last year.
Read the first post in this series, which looks at the picture at school level, here.


When comparing GCSE and non-GCSE the GCSE entries cover multiple boards whereas the non-GCSE are separately counting e.g. BTEC and OCR qualifications. Maybe the non-GCSE subjects should be aggregated by Discount code (e.g. BTEC and OCR Sport qualification together) before drawing conclusions about relative popularity of GCSE v Vocational pathway subjects.
Hi Mike. I think we were a bit cautious about aggregating different quals together because we don’t know a great deal about the extent to which they have similar content. But just for you we’ve added another chart….
Could you confirm I’m reading your table correctly the P8 for boys in 2022 was -0.38 and girls -0.02
Hi Bill. I can confirm that you are reading the table correctly, but the bad news is that we’d made an error in the ‘Total’ column that you were looking at! Sorry about that, we’ve now corrected the figures. The P8 for boys in 2022 was -0.21 and for girls 0.15.
Hello – are you able to share the progress 8 breakdown by SEN too? (All/None/School support/EHCP)
Hi Georgina, sure, I pulled these figures from the DfE KS2 performance data, which might be worth looking at if you’re interested in any further breakdowns.
The figures for P8 in 2019 were:
No SEN 0.08
EHCP -1.17
School support -0.43
Any SEN -0.62
And for 2022:
No SEN 0.1
EHCP -1.33
School support -0.47
Any SEN -0.69
Hi, do you happen to have the 2022 national P8 scores for English and Maths by gender? Thanks.
Sure – so overall P8 was 0.15 for girls and -0.21 for boys, on average. The English element was 0.29 for girls and -0.37 for boys, and maths 0.04 for girls and -0.09 for boys.
Would love to see a similar piece for the 2023 results. Particularly the average P8 scores across gender and disadvantage – is this information available yet?
Hi Maria. Sorry not yet. Should be available towards end of the month.
Do you have the comparison figures for boys and girls Progress 8 in English?
Hi Mike. +0.26 for girls and -0.33 for boys provisionally (revised figures due in a couple of weeks).