Just before half-term the Department for Education published Progress 8 scores for secondary schools for the first time since 2019.
We’ve written before about the problems with Progress 8 and offered solutions for some of them. We’ll revisit some of these as the year progresses.
In this blogpost, we’re going to look at the relationship between Progress 8 scores and the number of qualifications entered by pupils.
Do schools which enter pupils for more qualifications tend to achieve higher (or lower) Progress 8 scores?
Data
I use the school-level data published by the Department for Education. This contains a number of aggregate (average) measures for each Year 11 cohort in each school in the 2021/22 academic year. In particular, I am interested in the average Progress 8 score for a school and the mean number of qualifications entered by pupils.
Entries in GCSEs, AS-levels and up to 3 other approved qualifications are included for each pupil in Performance Tables. Progress 8 is based on a subset of these qualifications[1].
In 2022, exams entered in 2021 (or earlier) were not eligible for inclusion. We wrote about that here. It is also the case that some other qualifications approved for 16 year olds which are still taught in schools have not been eligible for inclusion in Performance Tables since 2014.
Although the average number of entries per pupil in GCSEs, AS-levels and up to 3 other approved qualifications is presented in the published school-level data, entries in GCSE double science only count as one entry. However, under Progress 8 they count as two entries. So to try and make things consistent, I adjust the average number of entries per pupil at each school to include an extra entry for pupils taking double science.
It is also worth mentioning that I am just looking at school averages and examining the variation between schools. At this stage, we don’t have any data on variation within schools. And there’s usually more variation within schools than between schools, which is something that tends to get missed when Performance Tables are published.
Entries per pupil
With our adjustment for double science, we find that pupils entered on average 8.9 eligible qualifications in 2022.
However, there are some small differences between regions. Pupils in London entered 8.7 GCSEs on average, compared to 7.7 in Yorkshire and Humber and 7.8 in the North East. There will be a number of reasons for this, including a higher rate of entry in community languages in London, but that’s a story for another day.
They also entered fewer “other” qualifications (0.4 per pupil in London compared to 1.0 in Yorkshire and the Humber and the North East).

The relationship between entries and Progress 8
The heatmap below shows the relationship between the mean number of entries per pupil and Progress 8 in 2022.
We’ve used a heatmap in place of a scatterplot to give a sense of where there are concentrations of schools. Red indicates larger clusters of schools. This feature tends to get lost in a 2-D plot.
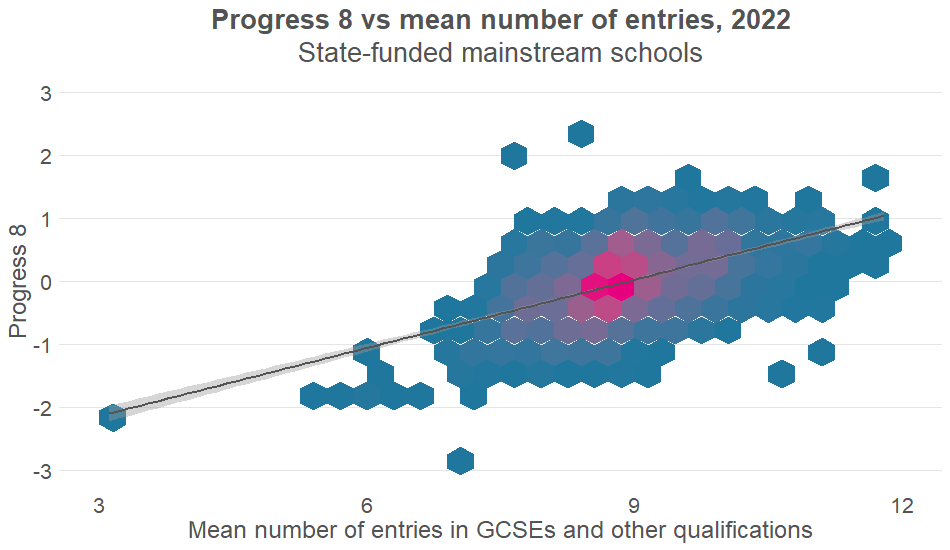
This shows that schools that tend to enter pupils for more qualifications tend to achieve higher P8 scores. The correlation (r=0.51) is moderate. On the whole, the mean number of entries per pupil is between 7.5 and 10.5 at most schools, with some smaller schools offering curricula not well-aligned with Progress 8 (such as university technical colleges and studio schools) tending to have fewer entries.
Clearly, this is correlation rather than causation. At this stage at least.
We’ve shown in the past that some qualifications are graded more favourably than others. So Progress 8 is related to which subjects qualifications pupils take as well as how many.
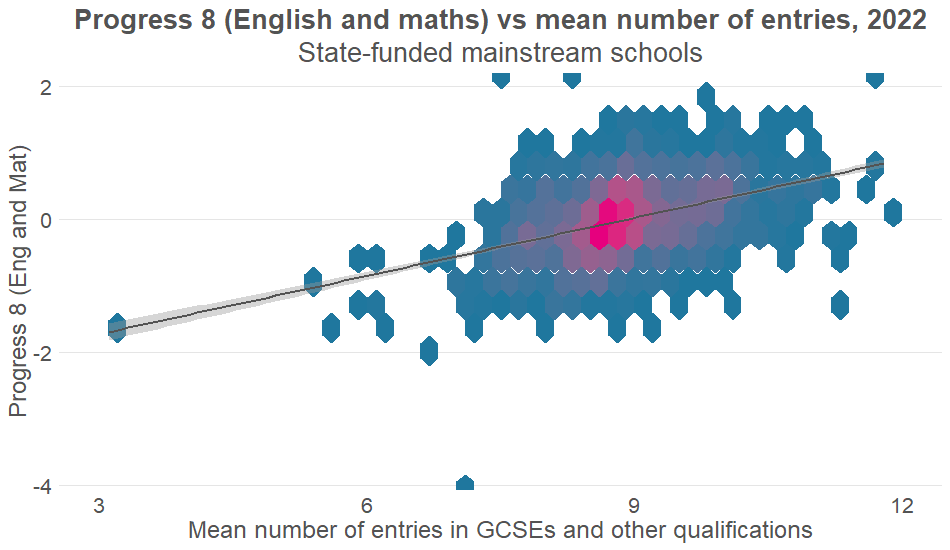
But if we only include the sub-scores for English and maths in the Progress 8 measure (the two subjects that almost all pupils take), the heatmap looks remarkably similar albeit with a slightly lower correlation (r=0.41).
What explains the difference?
If we were to fit straight lines through the clouds of points in the heatmaps above, it would imply that an increase of 1 GCSE (or alternative) qualification is associated with an increase of 0.36 in Progress 8 overall and 0.29 in English and maths.
Of course, other factors are at play. We know that Progress 8 is also associated negatively with the proportion of disadvantaged pupils and associated positively with the proportion of pupils with a first language other than English. Schools with higher attaining intakes (which includes grammar schools) also tend to achieve higher scores.
In the table below, we look at the school-level correlations between
- Progress 8 (overall)
- Progress 8 (English and maths)
- Mean number of entries per pupil
- Number of Year 11 pupils
- Mean KS2 scaled score in reading and maths
- % pupils with a first language other than English (%EAL)
- % disadvantaged pupils (%FSM6)

There is small to moderate correlation between most pairs of measures. In particular, mean entries is associated positively with mean Key Stage 2 scaled score and negatively with disadvantage.
We use a simple linear regression to see how the relationship between Progress 8 and mean number of entries per pupil changes as we include other factors[2].
Prior to adding in the other factors, an increase of 1 GCSE per pupil was associated with an increase of 0.36 in Progress 8 overall.
Adding in the other factors, this falls to 0.20. In real terms, from roughly a third of a grade per subject to a fifth of a grade per subject.
Using the Progress 8 English and maths measure, the initial difference of 0.29 grades per subject falls to 0.12 grades per subject.
Summing up
On the surface, school-level Progress 8 scores appear to be correlated with the mean number of qualifications entered by pupils at each school.
However, this correlation reduces (but does not disappear) once we control for basic demographic differences between schools and limit the analysis to English and maths, thereby ignoring differences in the subjects offered by schools.
So why does the slight correlation remain?
Clearly, a pupil who only enters 8 eligible subjects will have all of them counted. But pupils who enter more will have their lowest grades discounted if their Progress 8 slots have been filled by other qualifications. The fact that some subjects are graded more reliably than others also plays a part here.
But that’s only a suggestion. There may well be other explanations. We’d be interested to hear them.
- GCSE English (best of language or literature, double-weighted if both are entered), GCSE maths, up to 3 EBacc subjects (science, humanities, languages) and any 3 other subjects.
- Number of Year 11 pupils, mean KS2 scaled score, % disadvantaged pupils, % pupils with a first language other than English
Want to stay up-to-date with the latest research from FFT Education Datalab? Sign up to Datalab’s mailing list to get notifications about new blogposts, or to receive the team’s half-termly newsletter.


Discounting when the number of entries is higher has an effect,
Would be interested to look at the differerence in P8 for maths and English, with the inherent discounting of the lower Engish grade if lang and lit are done, or looking at the P8 vallue for the 2 english quals seperately. and comparing to maths. Dom all schools have higher P8 for English than maths due to this?
always an interstng read, thank you.
I wonder if the higher achieving schools have more students taking triple science and therefore naturally progress 8 increases with the higher entries? Does that make sense?
Hi Rich. It’s certainly a contributory factor- taking triple gives an extra grade to play with compared to taking double.