This blogpost supports a new report available to secondary schools in FFT Aspire, but may be of interest to a wider audience.
We see four main issues with Progress 8, the value added measure rolled out to all secondary schools in 2016.
- It takes no account of school context.
- It only includes pupils who were on roll in the January of Year 11.
- It offers incentives to pursue particular qualifications.
- It can be disproportionately affected by outliers.
Context
As the chart below shows, some groups of pupils achieve better P8 scores than others. Such pupils are not uniformly distributed among schools, and consequently, we don’t think that you can compare the effectiveness of schools with different intakes.
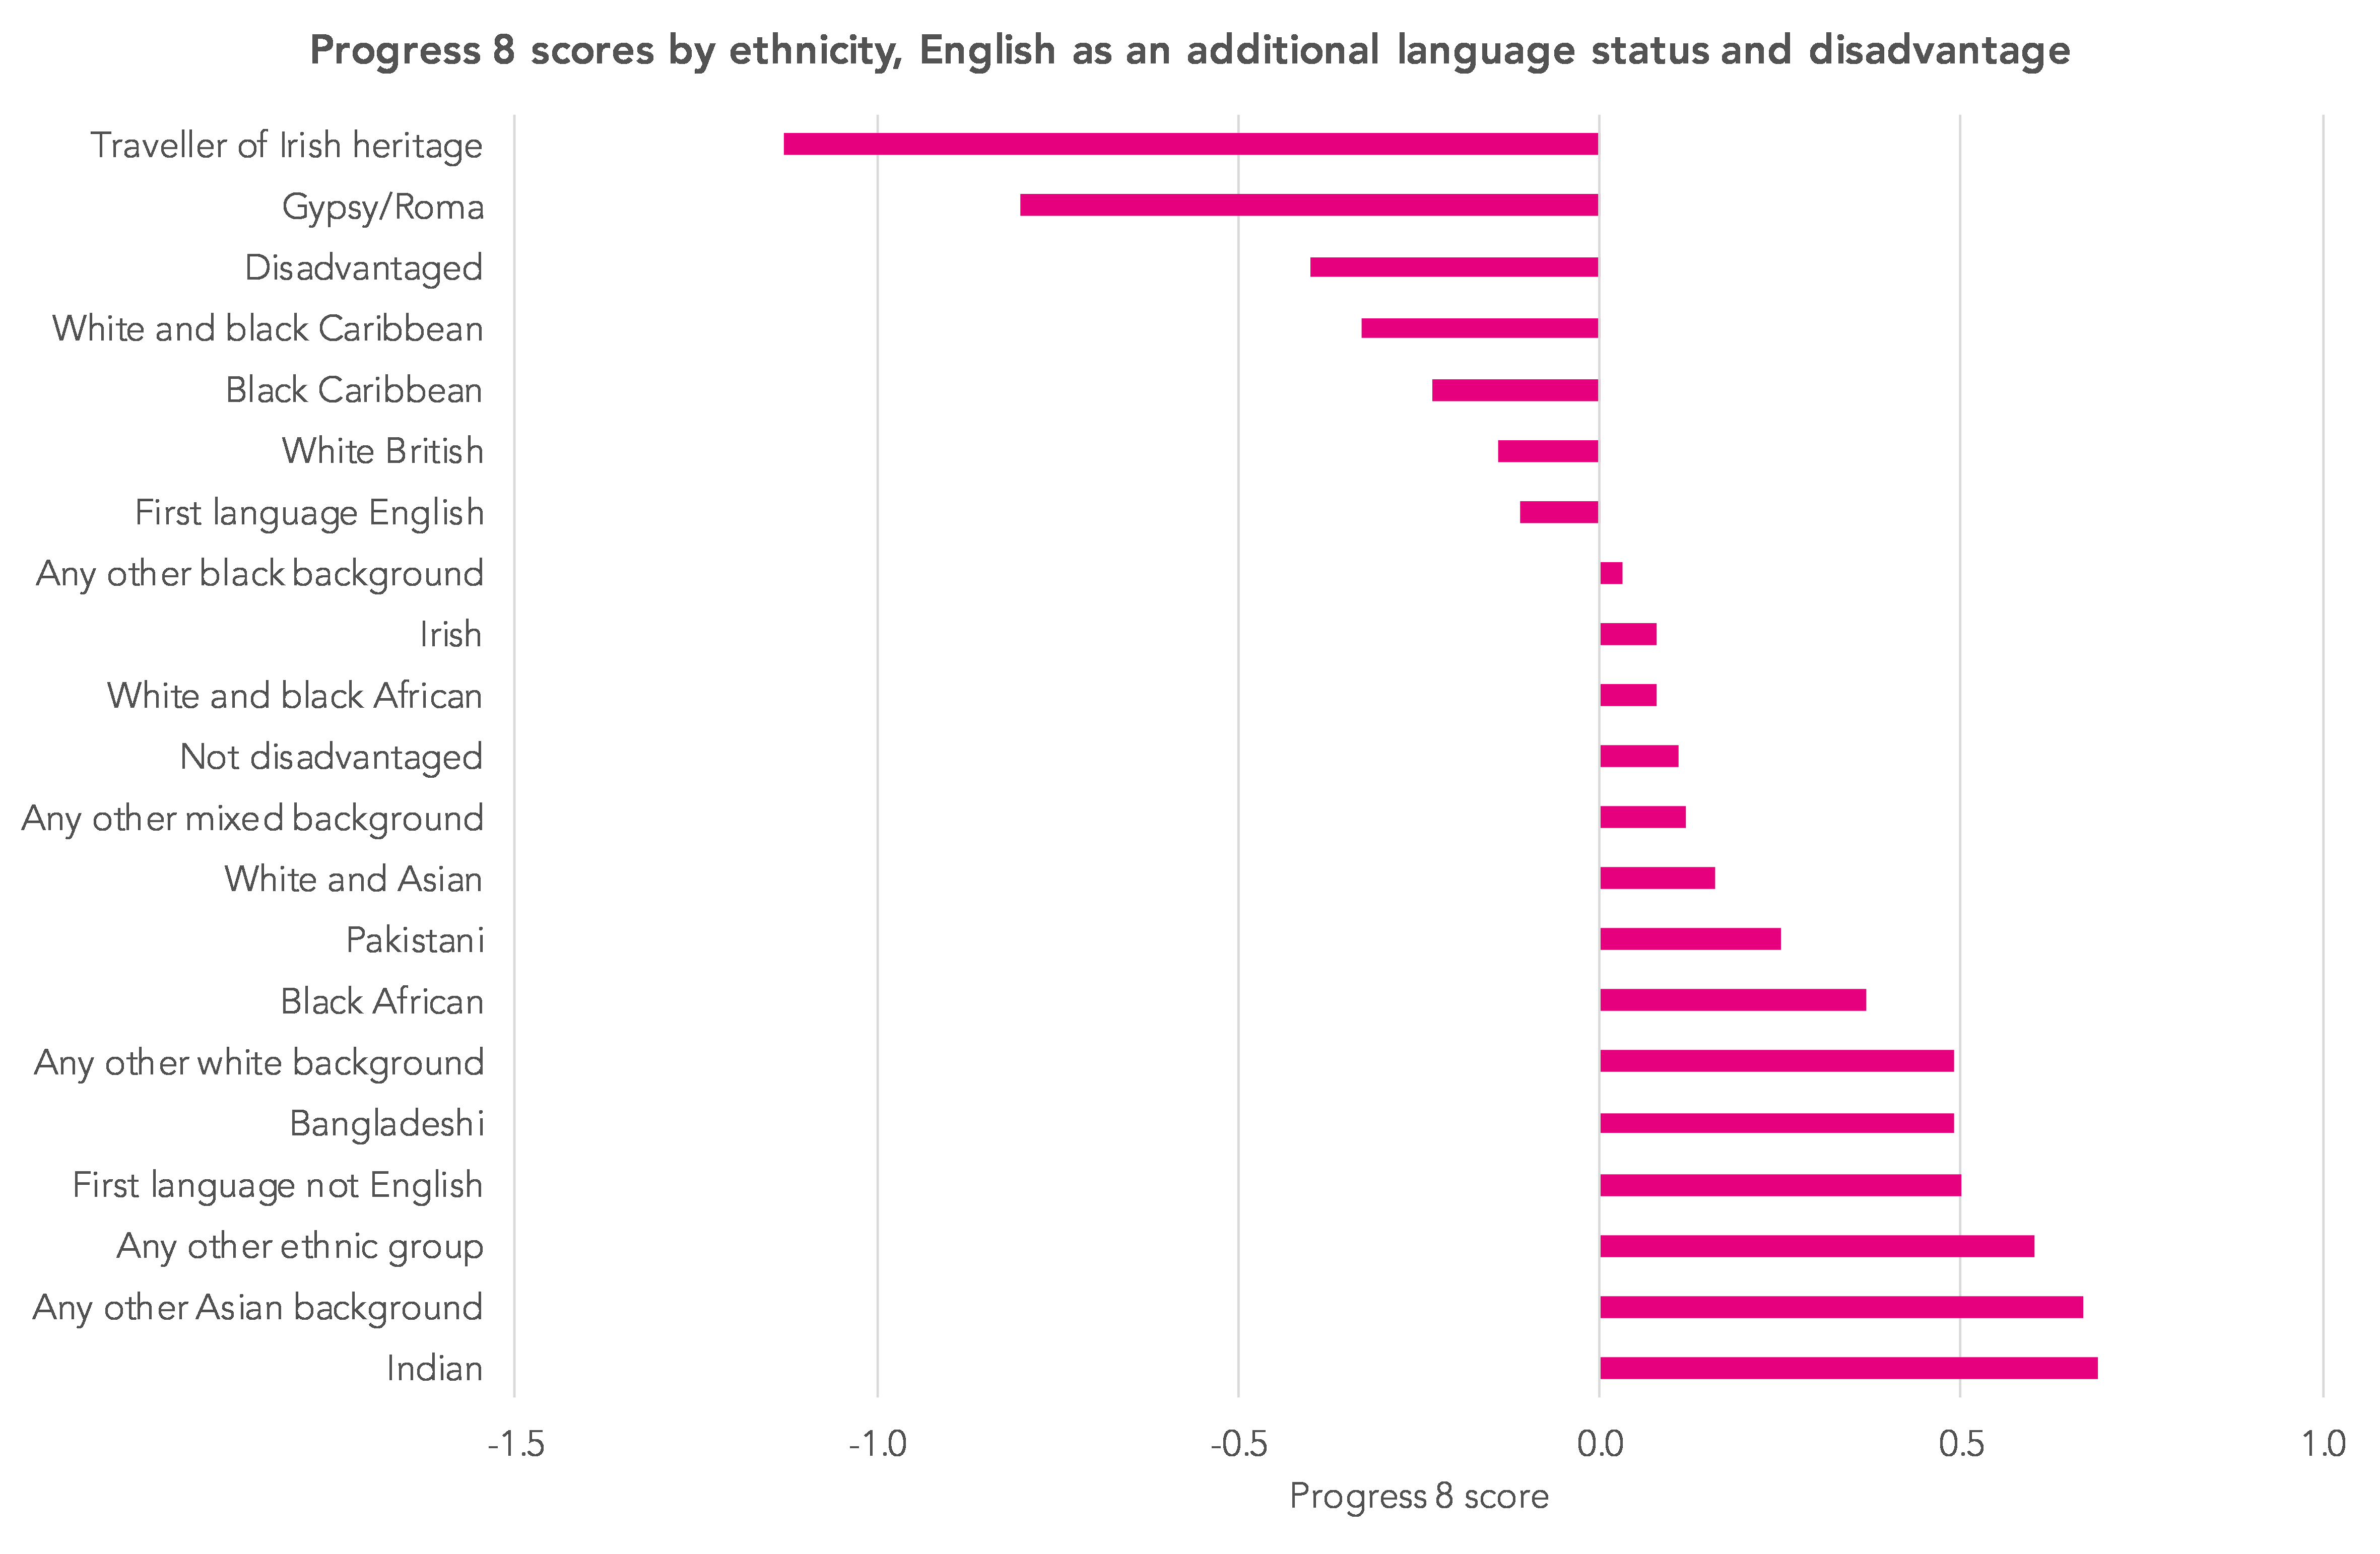
Source: DfE SFR01/2018 [XLSX]
(Tom Perry from Birmingham University has also published some interesting analysis showing how measurement error in Key Stage 2 results may be driving at least some of the P8 advantage in favour of grammar schools.)
Calculating a contextual value added (CVA) measure based on Attainment 8 alleviates the bias with respect to observed pupil characteristics and the mean KS2 score of a school’s intake.
It would still fall short of being a measure of school effectiveness, as schools would still vary in other ways that couldn’t be captured in the measure (for example, levels of parental support and tutoring, and resources). But it nonetheless shows that differences in attainment between the majority of schools are actually tiny once context and prior attainment is taken into account.
Leavers
Broadly speaking, P8 only includes pupils recorded in the January school census of Year 11. Anyone who leaves before then, as a result of moving to another school, leaving the country, permanent exclusion or otherwise being off-rolled, is therefore not included.
This means there is a perverse incentive to manage any pupils who might achieve a large negative P8 score off-roll before Year 11 (see the section on outliers below), which a minority of schools might be tempted to take advantage of.
In this blogpost we show the effect of measuring P8 based on pupils on roll in the January of Year 7. Other methods of including leavers, such as reweighting, are also possible. We plan to return to this shortly.
Qualification incentives
Under P8, pupils’ grades in the various qualifications counted in performance tables are converted into points.
The scoring system tacitly assumes that all passes at the same grade represent the same level of challenge. However, Ofqual’s own reports on inter-subject comparability in GCSEs shows that this doesn’t appear to be the case at present (and may never have been the case).
On top of that, the equivalence of non-GCSE qualifications to GCSEs has yet to be established.
The net result is that some qualifications appear to be graded more (or less) severely than others.
Consequently, we have been examining how schools’ qualification choices influence their P8 scores and, vice versa, how P8 has changed schools’ qualification choices.
FFT Aspire users
If you are a secondary school using FFT Aspire, log in to the site, go to the downloads menu in the top right-hand corner (↓) and choose ‘FFT special reports’.
Not an FFT Aspire user?
If the points scoring system were ‘fair’, there would be no incentive to pursue particular qualifications just because they were considered to be less severely graded (or “easier” in more pejorative terms).
In 2016 we published this blogpost which proposed a method of rescaling the points awarded to different qualifications. Under our ‘qualification-neutral’ method, a grade C in modern foreign languages, for example, yields more points than a grade C in other subjects because it tends to be more severely graded.
This work has now been updated for 2017, with the points for each subject being determined by pupils’ grades in English and maths GCSEs.
On the whole, this rescaling work makes little difference. The qualification-neutral P8 score correlates strongly with the published P8 score (r=0.97). For a group of schools, however, there are some large changes – around 150 schools change by 0.2 or more (either positively or negatively).
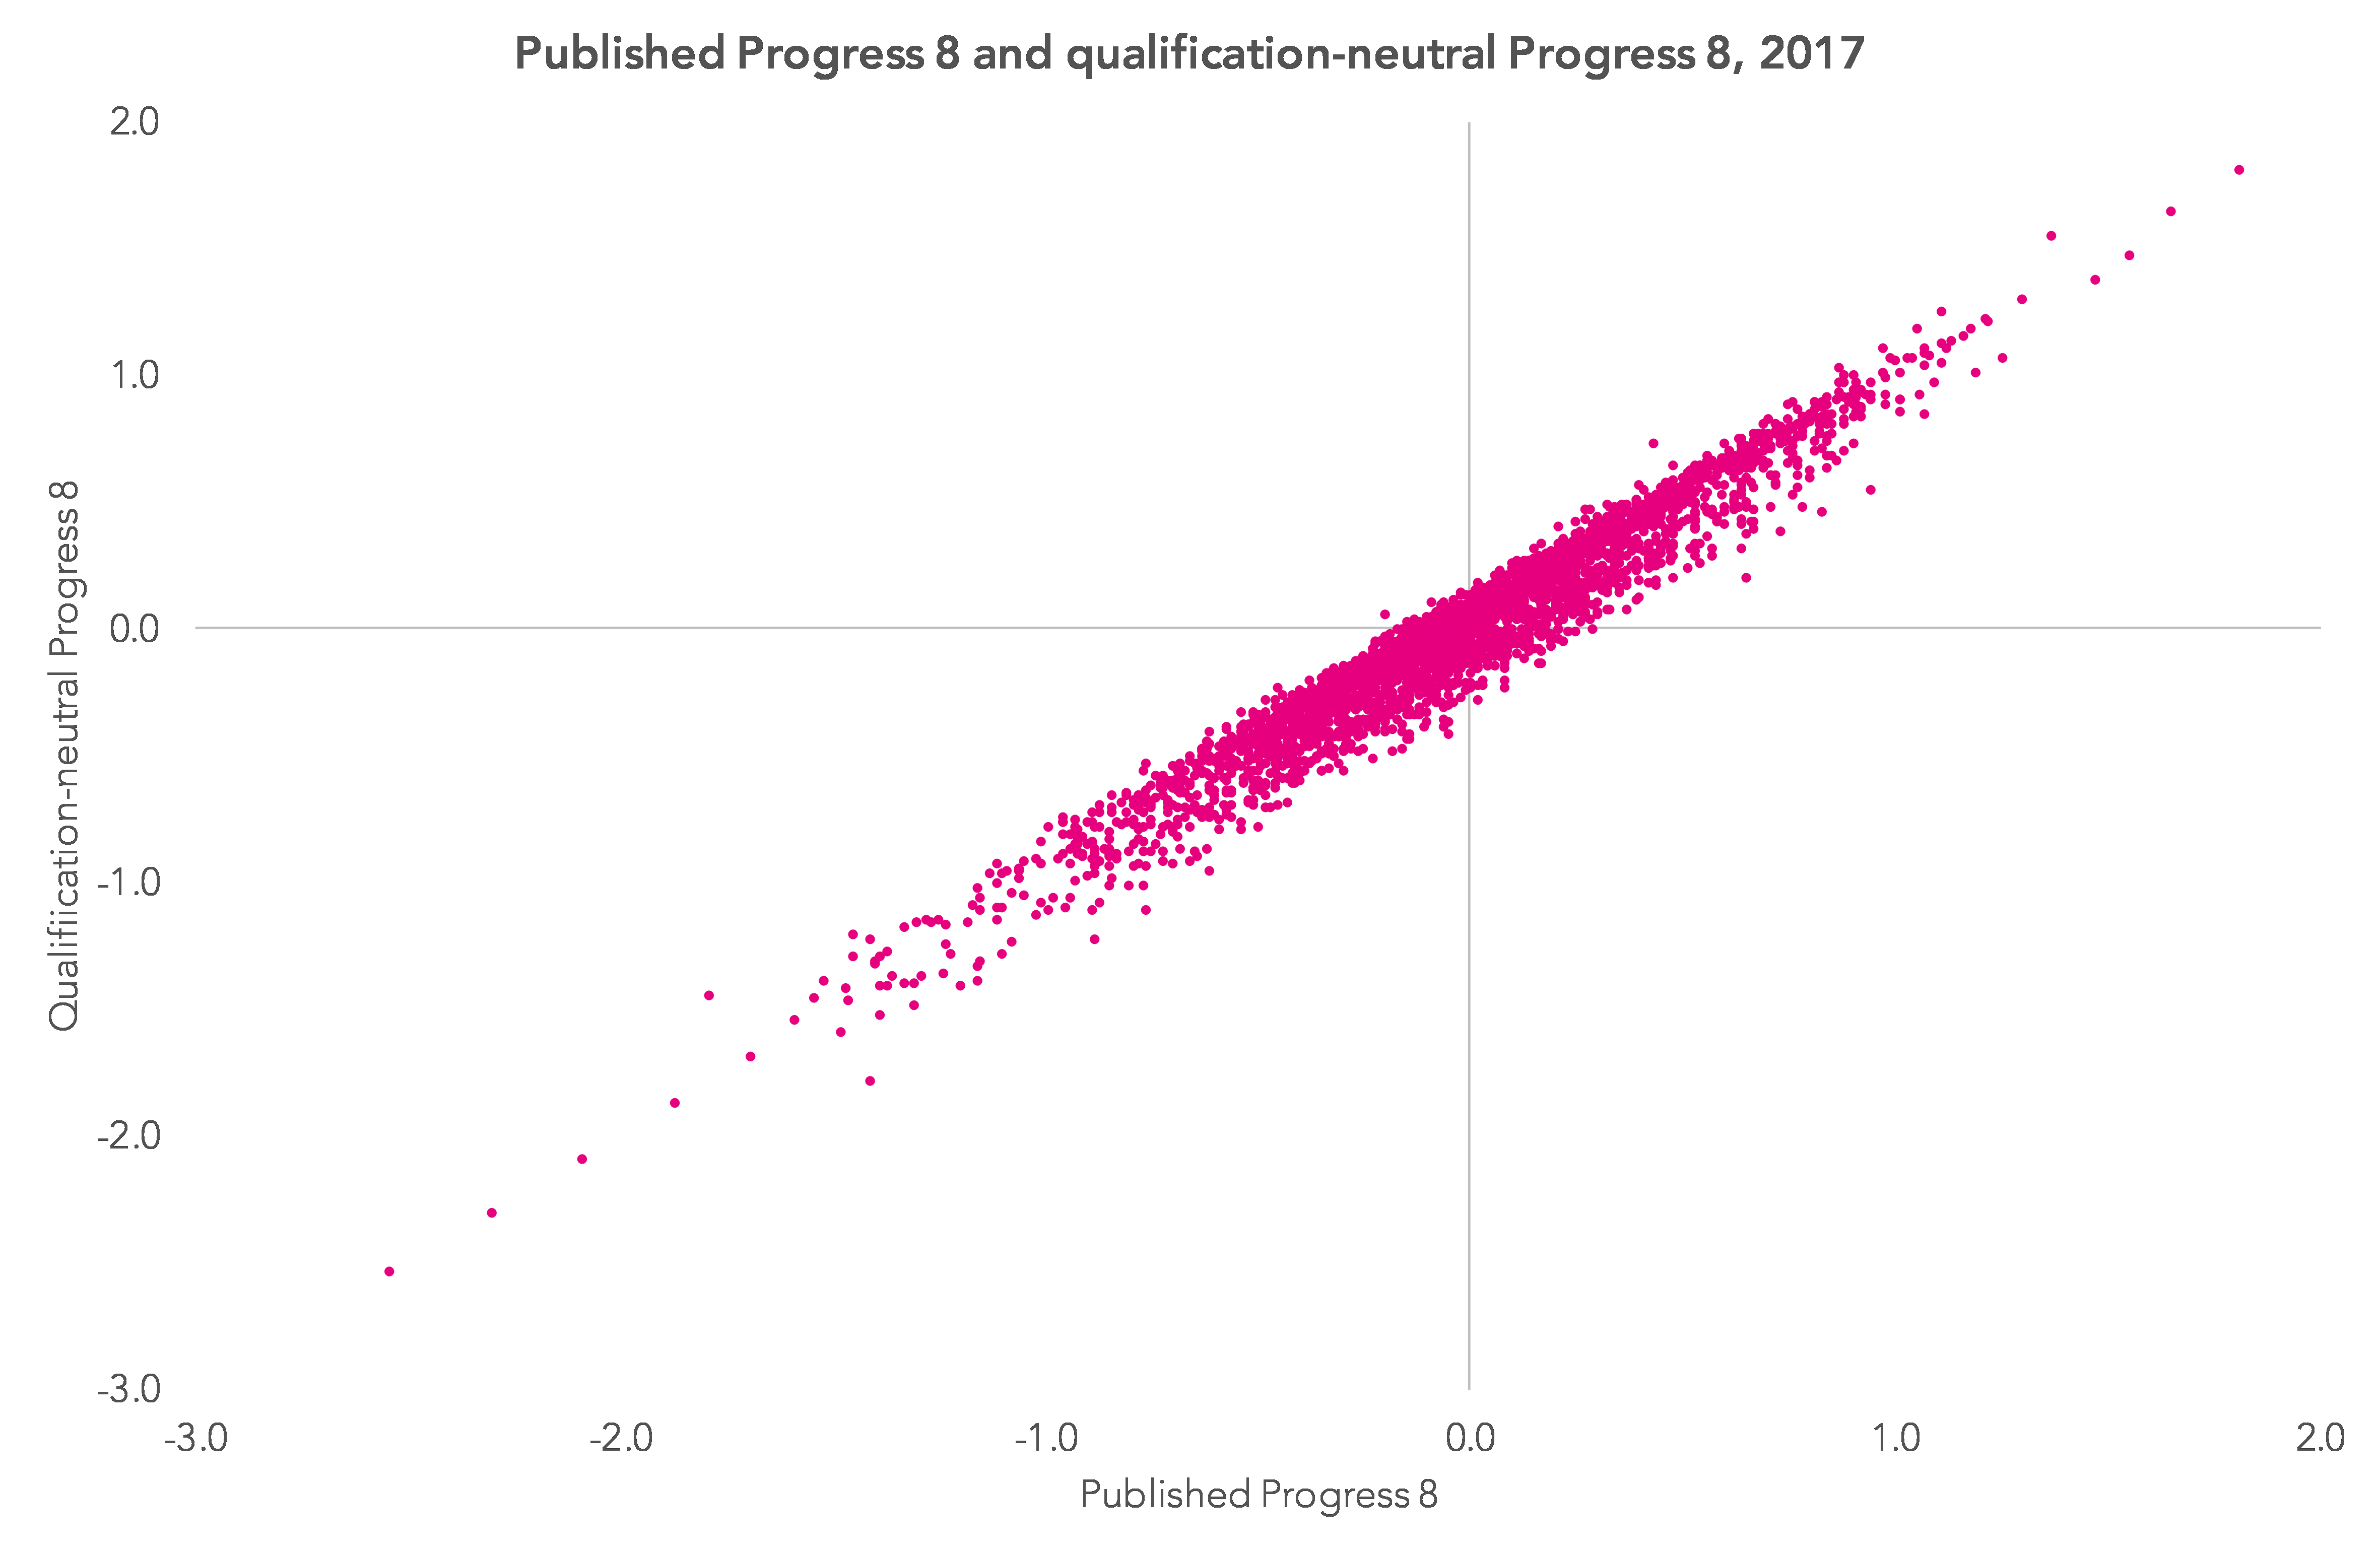
This method ensures that the P8 points attached to grades in different subjects are comparable. What we do not consider, however, is whether individual qualifications are comparable in size to a GCSE.
If a qualification can be fast-tracked in a matter of days then perhaps it should not be approved for performance tables purposes. This is a matter firstly for the exams regulator, Ofqual, to accredit the guided learning hours when an awarding body registers a qualification, and secondly for the Department for Education when deciding which applied and technical qualifications to approve [PDF].
Outliers
Finally, a quick word on outliers. These are pupil P8 scores that are extremely large (and usually negative), and which can have a disproportionate effect on a school’s average P8 score. These tend to be pupils who for a variety of reasons, including illness and refusal, achieve no, or very few, qualifications.
The DfE has announced that for 2018 it will cap extremely negative P8 scores [PDF]. It will do this by calculating a minimum score for each prior attainment group a set number of standard deviations below the mean. The DfE suggests that around 1% of pupils nationally will have their scores capped.
In practice, this will make very little difference to schools scores. If we assume the minimum score is set at -2.75 standard deviations then fewer than 20 schools would see their 2017 score P8 change by more than 0.1 (i.e. one grade in one of the 10 subjects counted in P8, including double-counted English and maths). All of these 20 schools would remain below the DfE’s floor standard of -0.5 in any event, even after capping.
There are other ways of determining a floor standard based on P8 that are not affected by extremely negative scores. There is an example in this blogpost. The DfE seem wedded to the average P8 score method, however.
We have not made any adjustment for outliers in the new reports we have made available in FFT Aspire. However, users can make use of the system to see the effect of removing individual pupils from their school’s P8 score.
Conclusions
As we’ve often said, value added measures do not provide an index of school effectiveness that ranks schools from best to worst. They are just descriptive statistics about attainment that take account of pupils’ prior attainment.
Unfortunately, they are sometimes interpreted as measures of school effectiveness, which can undermine their usefulness as descriptive statistics.
For that reason, we suggest inspecting value added scores alongside supplementary measures that deal with the issues known to bias them. And we will keep on trying to identify where bias may be affecting the measures.
Now, see the impact of these factors in your school in the new report available in FFT Aspire. To download a copy, log in to FFT Aspire, go to the downloads menu in the top right-hand corner (↓) and choose ‘FFT special reports’.
Want to stay up-to-date with the latest research from FFT Education Datalab? Sign up to Datalab’s mailing list to get notifications about new blogposts, or to receive the team’s half-termly newsletter.


Thank you for this valuable information – we now need to get to a place where the DfE and OfSTED make accountability a fairer reflection for all schools.