From this year, the secondary school accountability framework will be predominately based around a single value added measure, Progress 8, although a small number of headline attainment indicators will be published alongside it.
However, there is no single equivalent measure for primary schools. Three value added (VA) measures have been calculated in reading, writing and maths. All three will be used in the definition of floor standards along with a measure of attainment: the percentage of pupils achieving the expected standard in all three subjects.
Schools with more advantaged intakes will be very unlikely to fall below the floor due to the inclusion of the measure of attainment.
But what would things look like if there were an overall value added measure for primary schools?
On the one hand, giving too much importance to a single performance indicator is generally best avoided since it can lead to a narrowing of the curriculum.
School performance is complex and multi-dimensional and this can be lost by boiling it down to a single number. It also tends to encourage gaming.
That said, performance indicators in any individual subject for primary schools exhibit much year-on-year variability. An overall indicator can reduce this variability a touch.
Constructing an overall value added measure
We’ve chosen not to include writing in our overall VA measure. We highlighted a lack of consistency in results between local authorities in a previous blogpost. Ofsted has also urged caution in the interpretation of writing data.
For our overall VA score we include test results in grammar, punctuation and spelling (GPS); reading; and maths – we’ll refer to this as GRM.
We follow the DfE methodology for the three individual Key Stage 2 (KS2) VA measures, which looks at progress from KS1, but then calculate the average score for each pupil, giving maths double-weighting to balance out the measure.
Pupils working below the level of the GPS test are given a notional GPS score of 75. National averages for each prior attainment group are shown in the table at the end.
We then go a stage further and calculate an overall VA score for KS2 GRM on the basis of Foundation Stage Profile (FSP) assessments using a similar methodology to the KS1-KS2 VA calculation.
What do the results look like?
School KS1-KS2 VA scores ranged from a scaled score of -7 to +7 with a handful of outliers either side.
Over 500 out of 13,600 schools (with at least 11 pupils) achieved an overall VA score of -4 or lower. Just over 700 schools achieved an overall VA score of +4 or higher.
We have written previously [PDF] about the differences in VA scores between all-through primary schools and junior/middle schools. The latter remain at a disadvantage when it comes to defining floor standards and “coasting” schools.
However, the FSP-KS2 “progress gap” between junior/middle schools and all-through primary schools is much narrower than the KS1-KS2 gap. Nonetheless, junior and middle schools still tend to achieve slightly lower VA scores even when based on FSP.

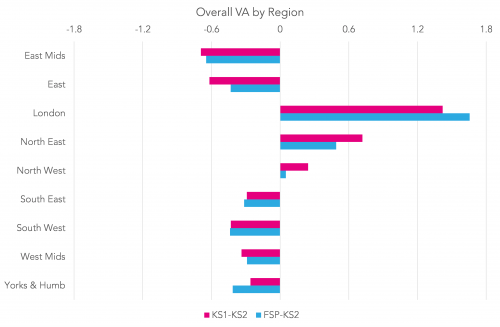
London leads the way on both VA measures. Pupils attending London schools achieved overall KS2 scores two scaled score points higher than pupils with similar prior attainment in the lowest performing region, the east Midlands.
While it’s interesting to look at both a FSP-KS2 and a KS1-KS2 VA measure, the FSP-KS2 measure might still be considered less desirable than the KS1-KS2 measure.
In total, 64 per cent of the variation in pupils’ overall KS2 outcomes can be explained by their KS1 attainment. The remaining 36 per cent is due to all the other factors that contribute to pupil attainment, including what happens at both home and school.
By contrast, FSP attainment only explains around 40 per cent of the variation in KS2 outcomes – lower than the equivalent figure based on KS1, not surprisingly, since a) there is a longer timespan (six years) between assessments at FSP and KS2 and b) FSP and KS1 measure different things.
But if we must have floor standards at KS2, would it not be better to define them using an overall FSP-KS2 VA measure, which appears not to put junior and middle schools at such a disadvantage?
KS1 prior attainment groups and KS2 average GRM scores

Want to stay up-to-date with the latest research from Education Datalab? Follow Education Datalab on Twitter to get all of Datalab’s research as it comes out.


Dave – you’re the data expert so you might be able to explain to me. Is this kind of data analysis only useful when describing data in large groups and then subsequently trying to find possible patterns? If we are looking at any value added data for individual schools, aren’t the groups too small and the data too course to be able to draw any meaningful information from them?