This blogpost supports a new report that is available to secondary schools in FFT Aspire, but may be of interest to a wider audience.
We are also making an Excel workbook containing more multi-academy trust-level data available for download by all here [XLS].
Multi-academy trust (MAT) league tables have started to be a regular feature of the Department for Education’s release of performance table data each January.
As our analysis at the time found, there is considerable variation in the performance of the largest MATs when judged using the DfE’s main secondary school measure, Progress 8.
But how does the qualification offer differ between MATs?
Multi-academy trusts
First, a quick note on definitions: we have used the same definition of trust membership as the DfE’s multi-academy trust performance tables [PDF] – namely, schools that had been with a MAT for at least three years, in the 62 MATs with at least three such schools.
The MATs vary considerably in size. The Seckford Foundation Free Schools Trust runs three schools in Suffolk at which 105 pupils completed Key Stage 4 in 2017. By contrast, Academies Enterprise Trust (AET) had 29 schools and over 4,000 pupils. In total, some 54,000 pupils completed Key Stage 4 at a school in one of the 62 MATs in 2017, a shade over 10% of the total population in the state-funded mainstream sector.
EBacc entry rates
Our analysis shows some substantial variation between MATs in the number and types of qualification entered. (There is also variation between schools within MATs but that’s a story for another day.)
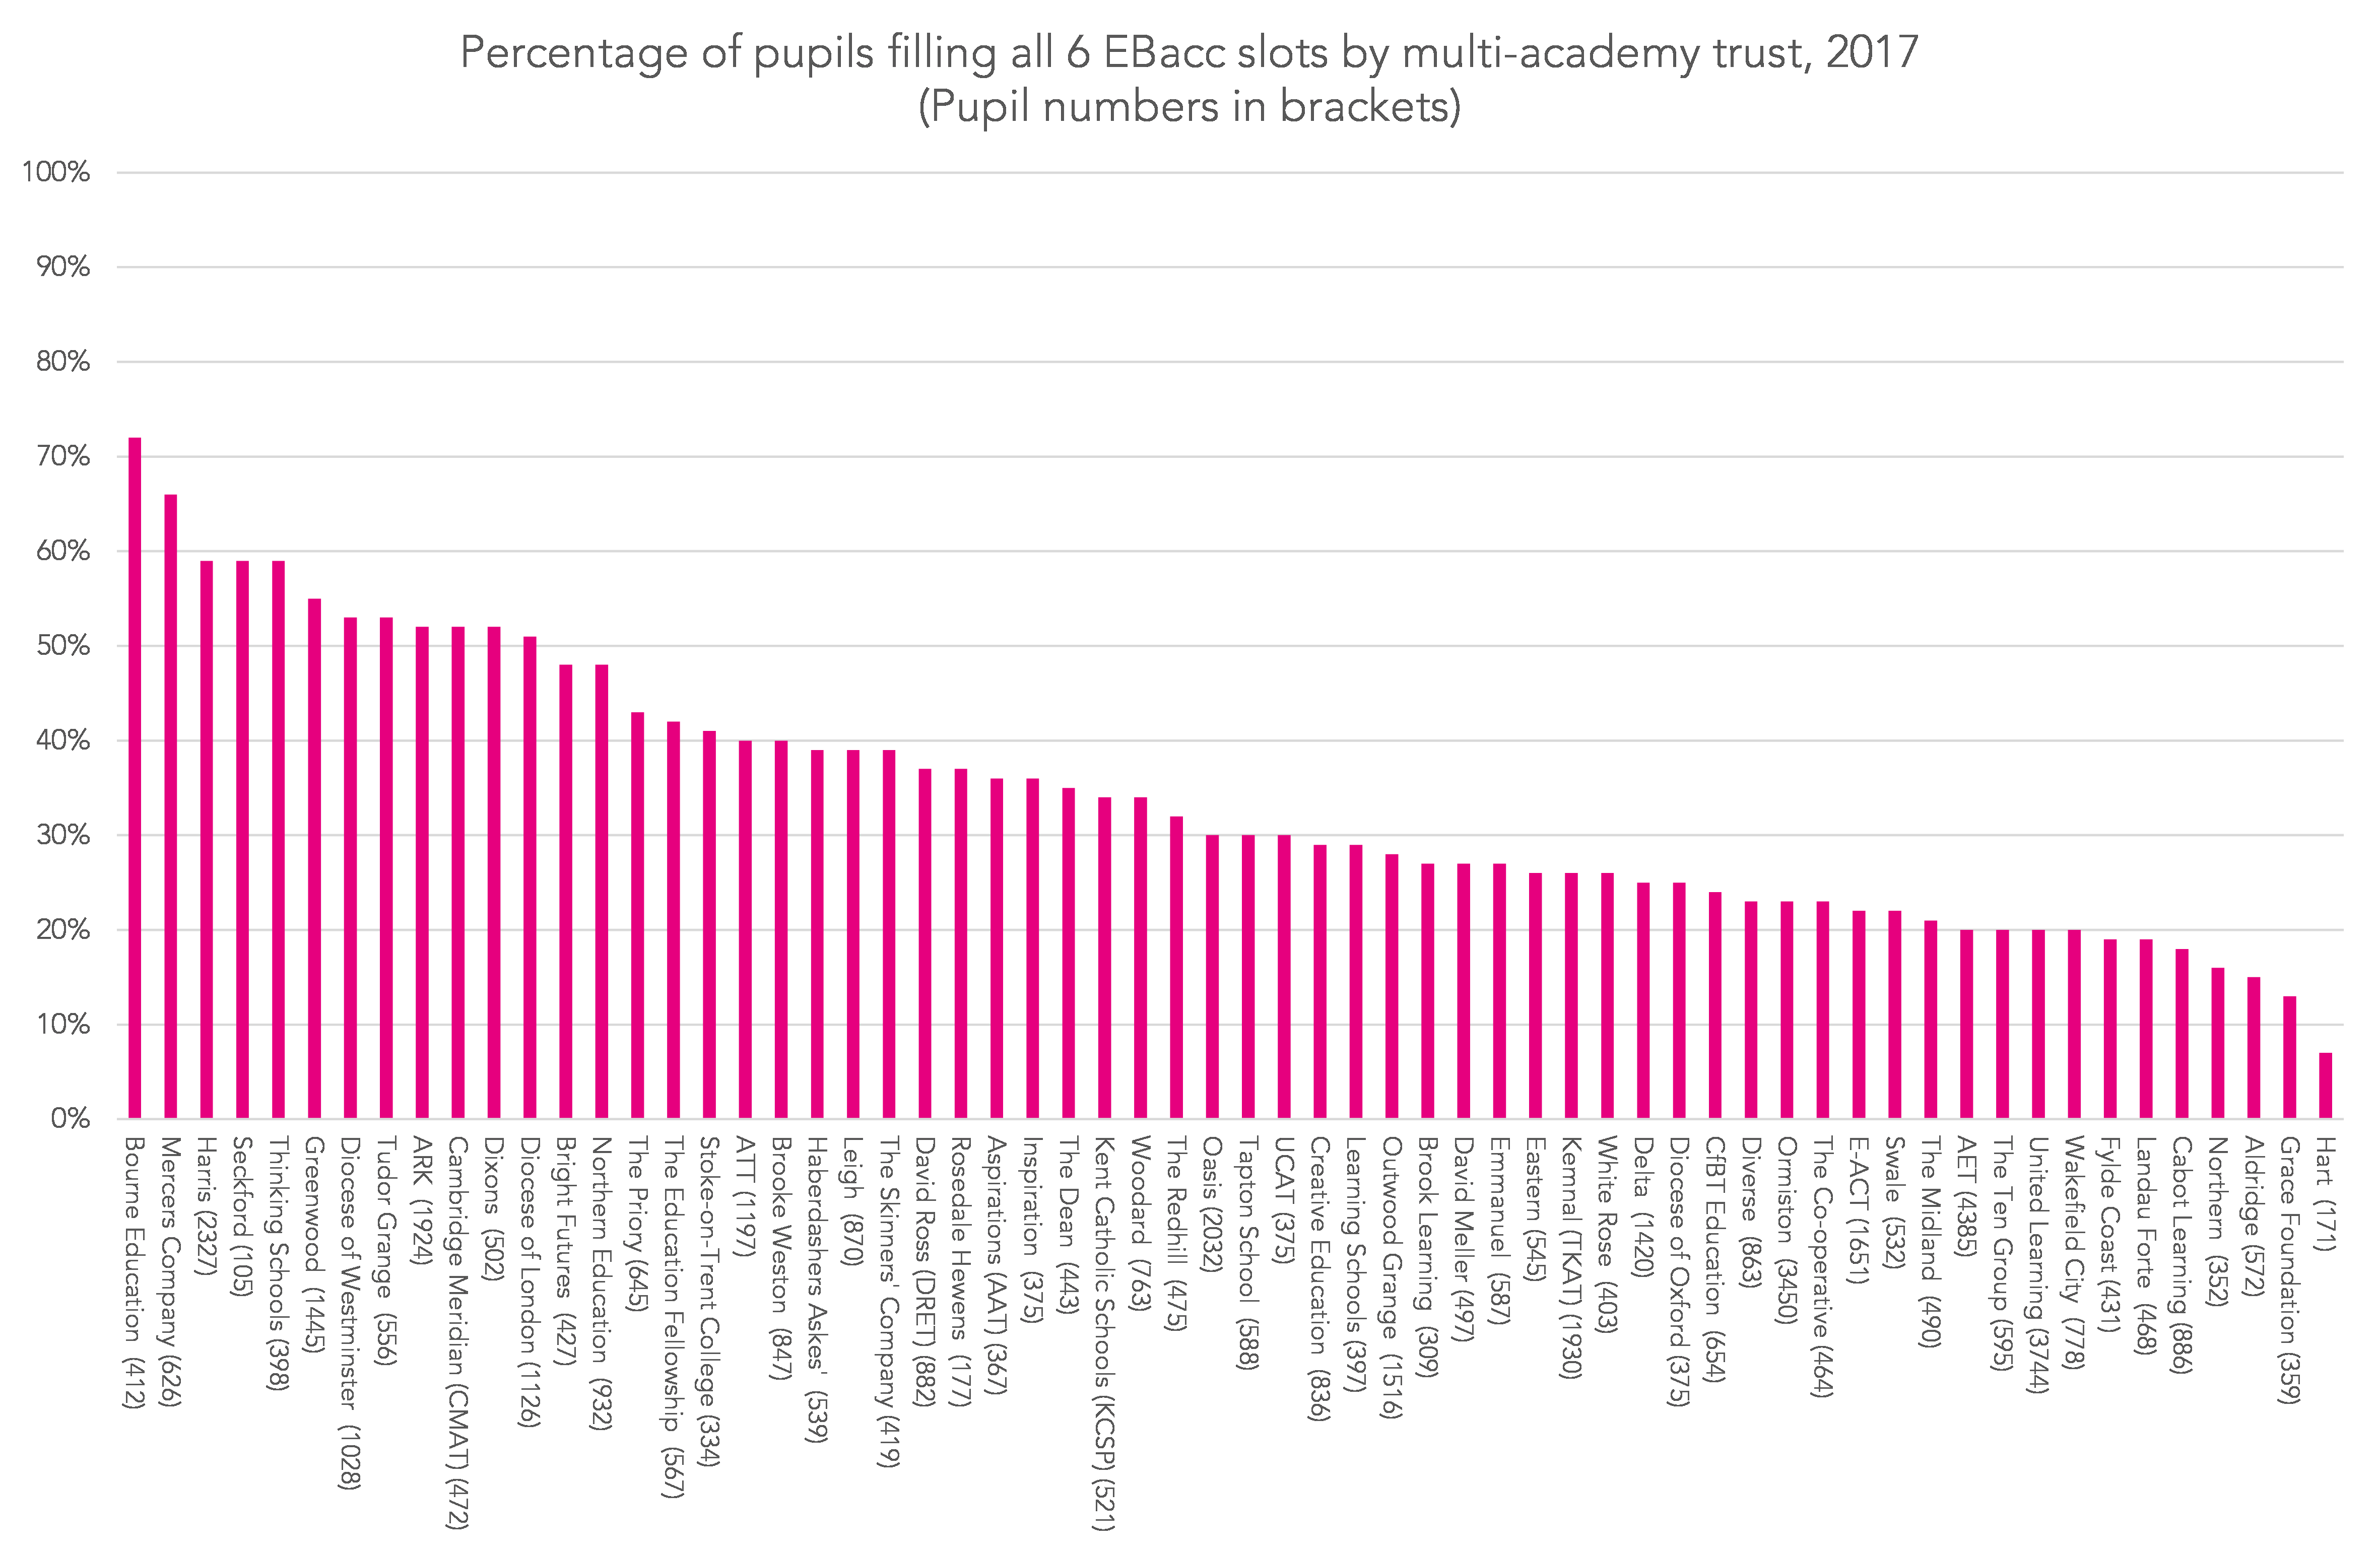
Firstly, pupils in the 62 named chains are less likely to be entered for the EBacc. In 2017, 33% of pupils in the named trusts entered all six EBacc slots (including two sciences) compared to a national average for state-funded mainstream schools of 39%.
However, there is much variation between MATs. Full EBacc entry ranges from 72% (Bourne) to 7% (Hart). Unsurprisingly (given blogposts like this one) this measure is heavily correlated (r=0.91) with entry in modern foreign languages.
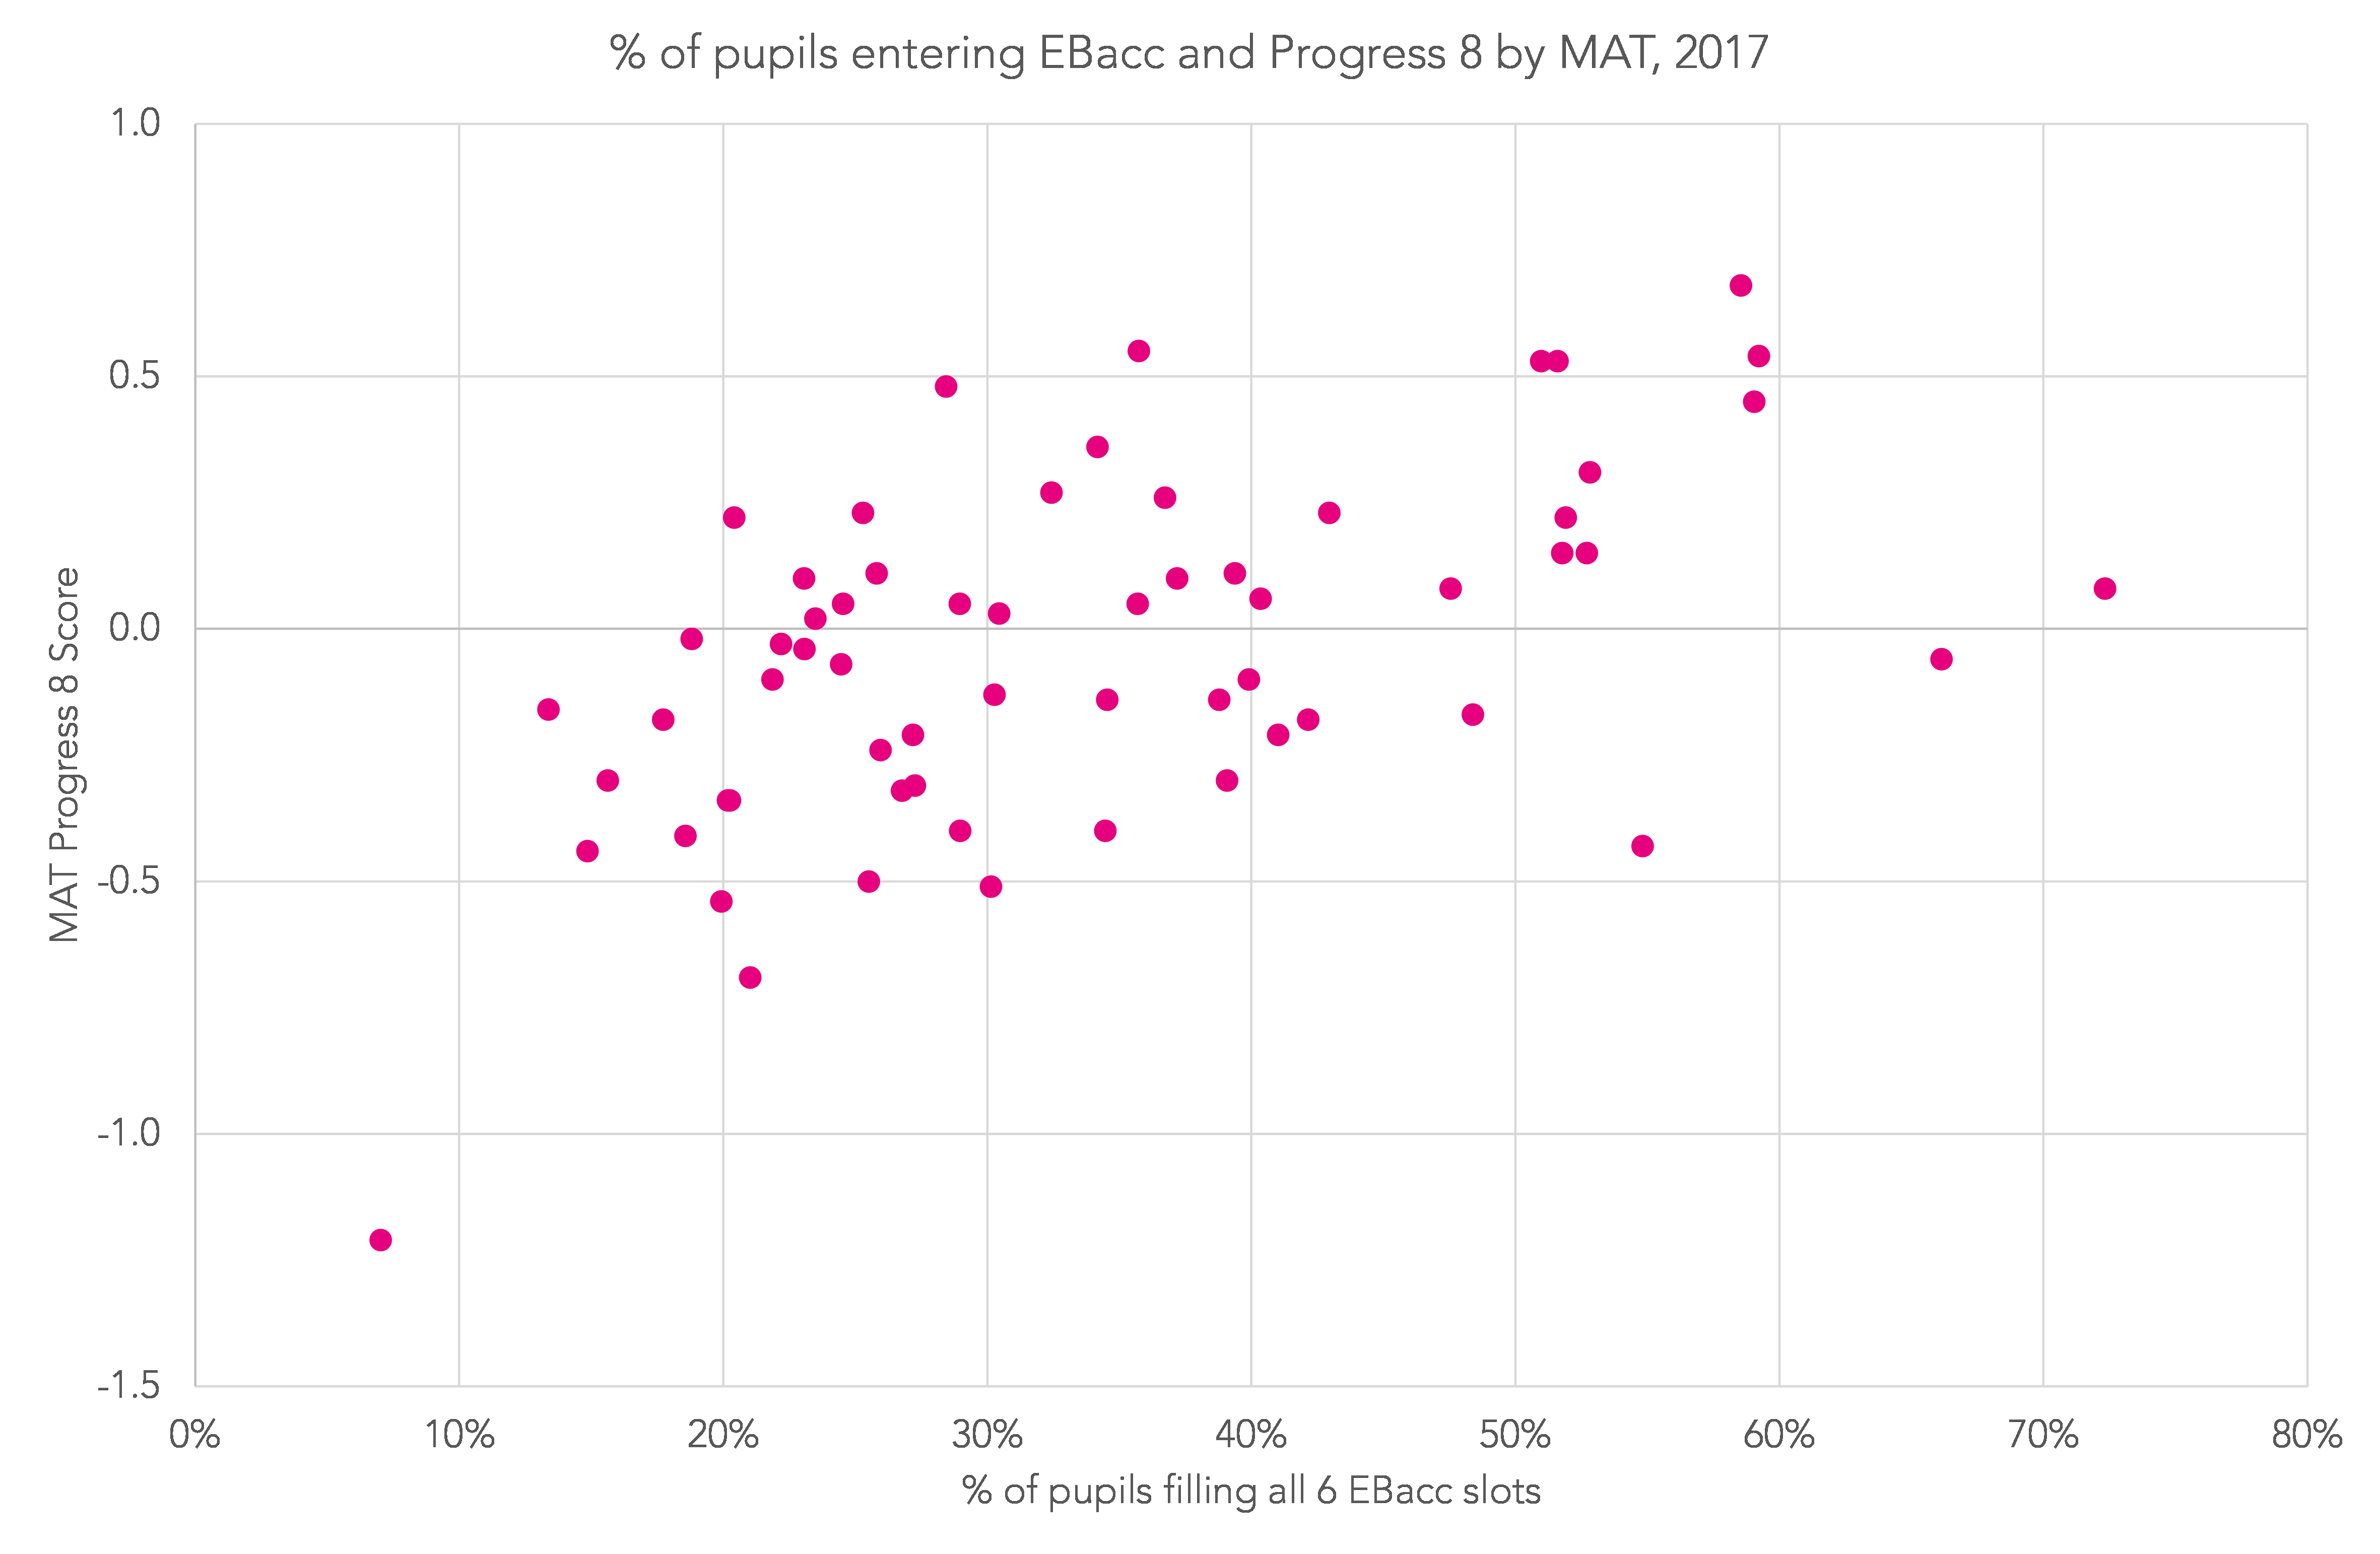
Progress 8 scores are mildly correlated (r=0.53) with EBacc entry at MAT level as the chart below shows.
ECDL entry rates
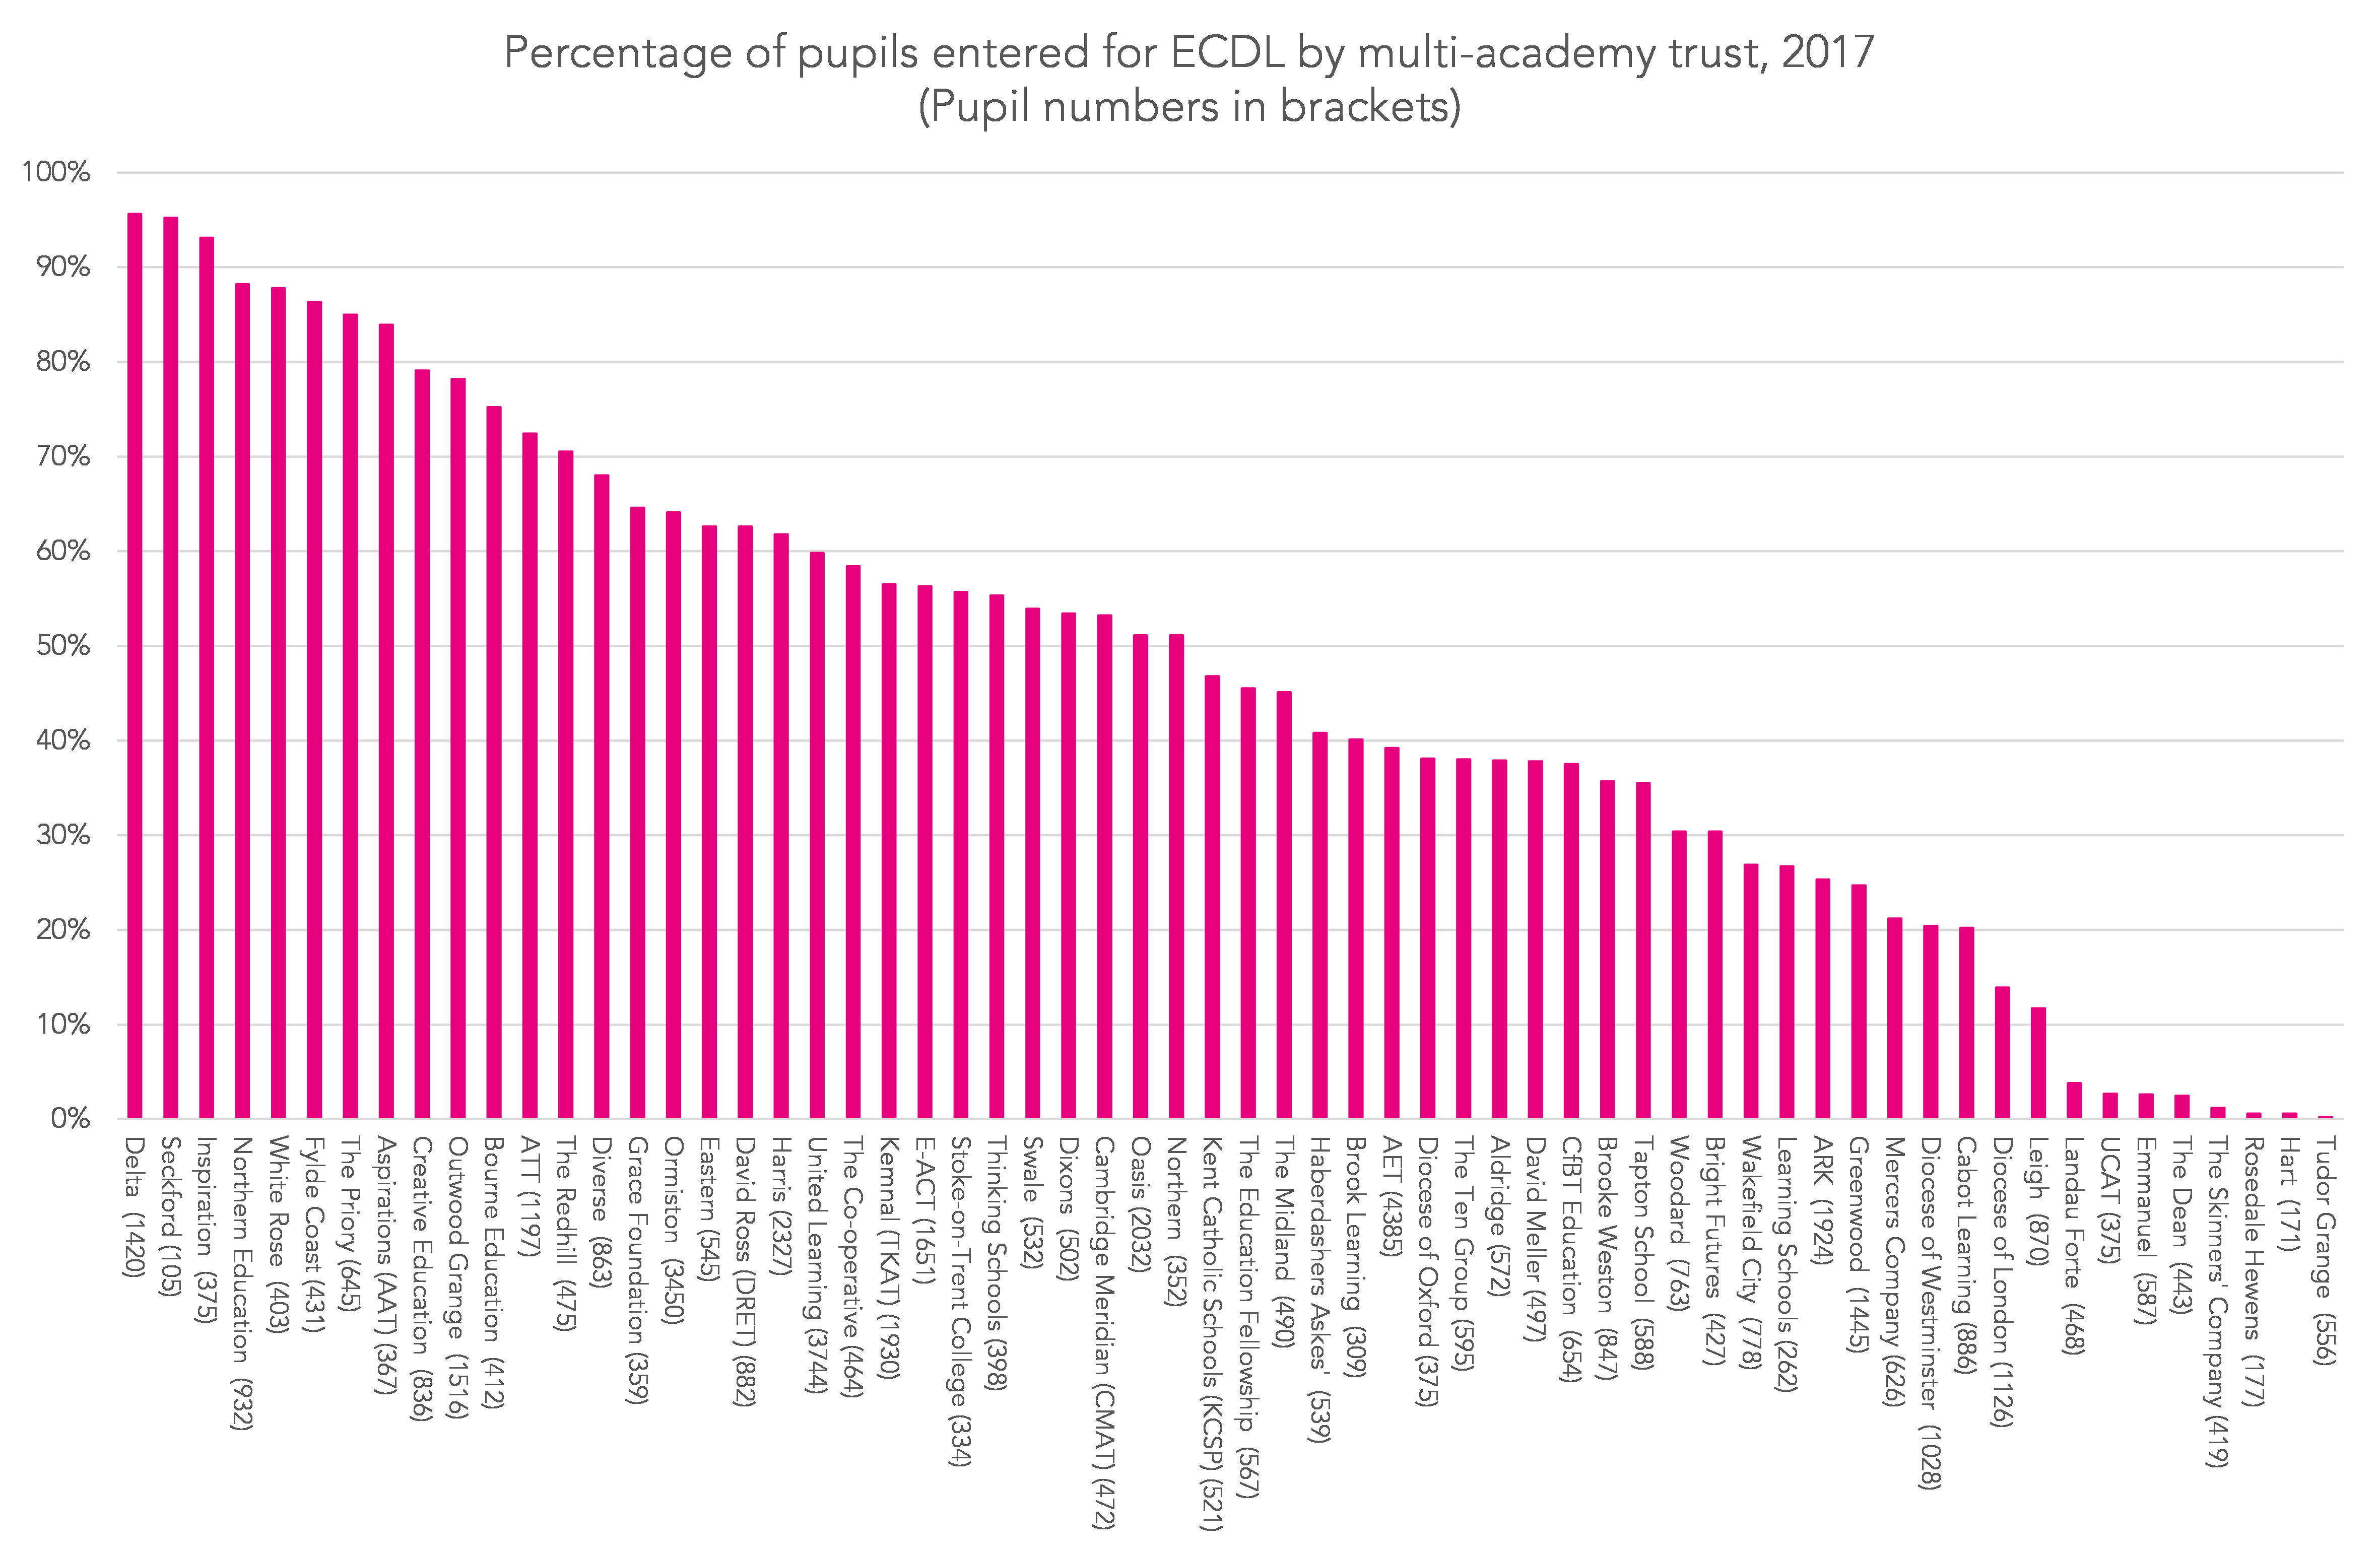
Secondly, ECDL (European Computer Driving Licence) entry rates in MATs are higher than average. (We look at ECDL due to concerns that we, and others, have expressed about the comparability of the qualification with other qualifications that count in school and MAT league tables.)
A total of 49% of pupils across the 62 MATs were entered for ECDL compared to a national average of 29%.
Again however, there was a lot of variation between the MATs. All three of the Inspiration Trust, Delta Academies Trust and the Seckford Foundation Free Schools Trust entered over 90% of pupils. By contrast, there were eight trusts in which fewer than 5% of pupils were entered.
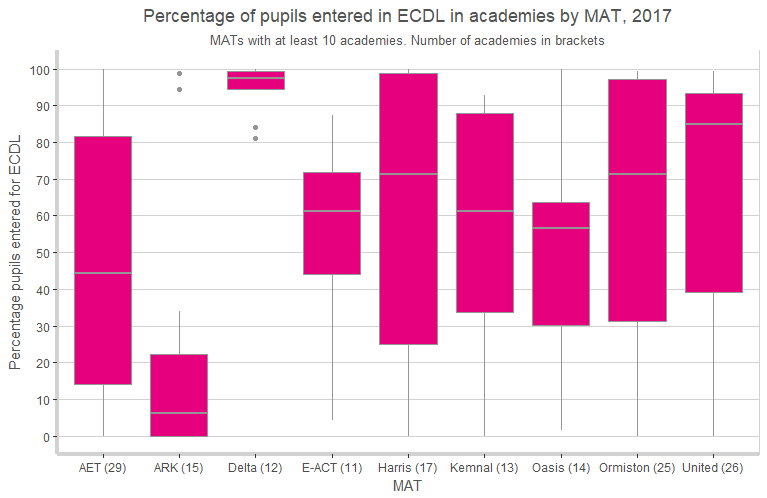
Within Delta Academies Trust, almost all pupils were entered for ECDL in 10 of the 12 academies, suggesting a trust-wide policy. Amongst the other larger MATs (those with at least 10 academies that counted in the MAT performance tables), ECDL entry rates tended to vary, suggesting that entry was more a matter for individual academies.
How to interpret a box plot
The charts used here are box plots, a type of chart which most people are likely to recognise – but the details of which we may not all remember.
The line across the middle of the box is the median – the value which exactly half of results fall below, and the other half fall above. The box itself shows the range between the lower quartile – the value below which exactly a quarter of results fall – and the upper quartile – the value above which exactly a quarter of results fall. This definition means that exactly 50% of results are within the range of values covered by the box.
The difference between the lower quartile and the upper quartile is the inter-quartile range. The whiskers stretching out from the box reach to the maximum and minimum values, excluding outliers, which are shown as dots. Outliers are defined as results more than 1.5 times the inter-quartile range away from either the lower or upper quartile.
Number of qualifications
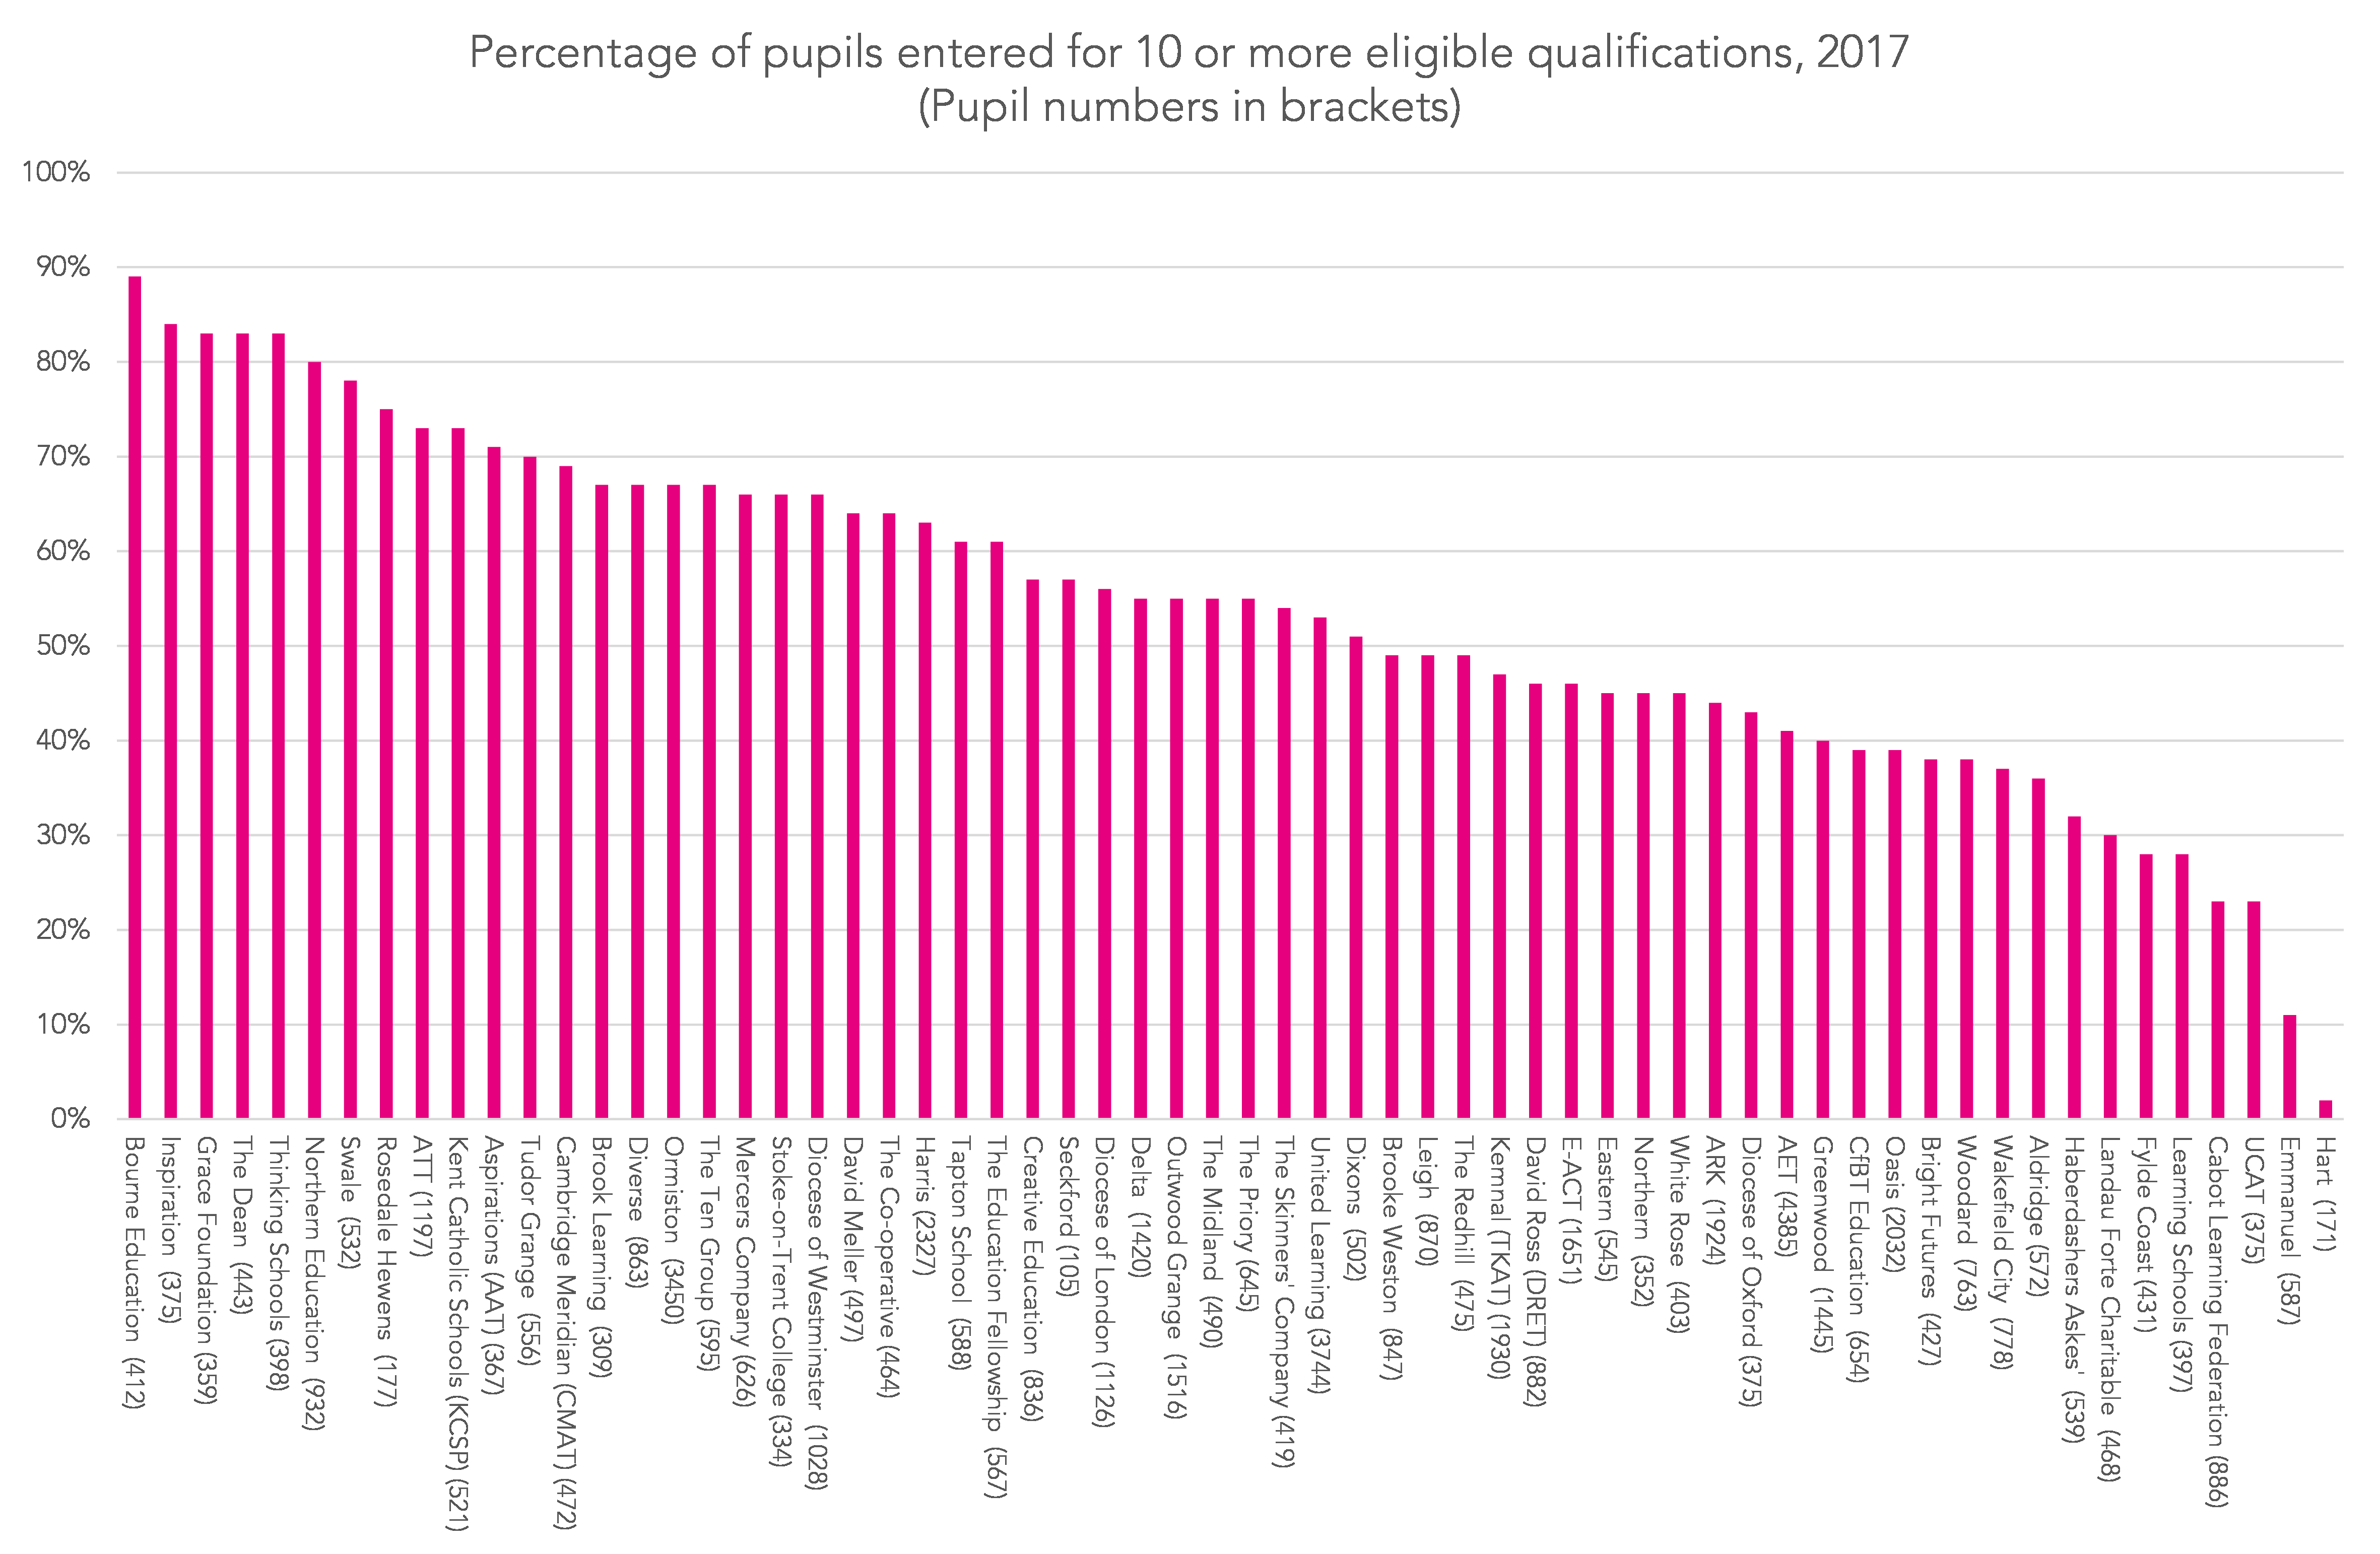
MATs also vary in how many qualifications they enter pupils for. Nationally, 57% of pupils are entered for 10 or more eligible qualifications (GCSEs and non-GCSEs). Among MATs, this figure ranges from almost 90% (Bourne) to 2% (Hart), with an average of 53%.
The chart below shows as histograms the number of qualifications taken by pupils in the nine MATs with at least 10 academies that counted in the MAT performance tables.
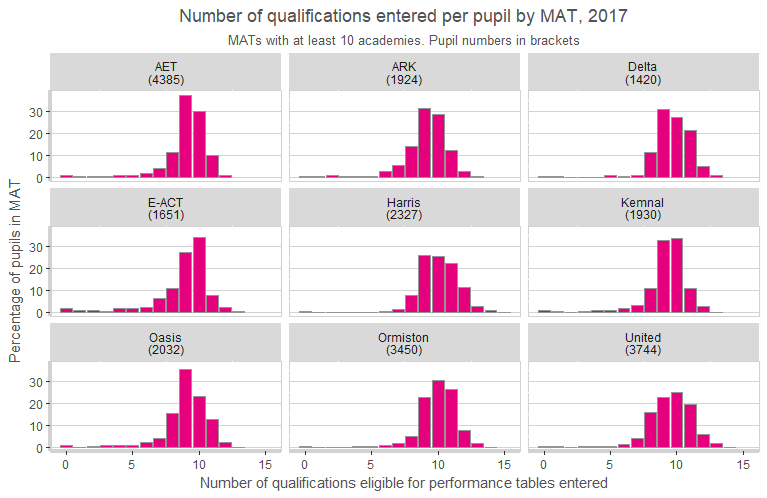
In most of these large MATs, pupils tend to take nine or 10 qualifications, though pupils at Ormiston academies tend to take 10 or 11. Entry in 11 or more qualifications was also more common among pupils at academies in the Harris Federation and, to a lesser extent, Delta and United Learning.
What do we conclude?
As with our findings about MAT-level progress scores, there is considerable variation even when only a relatively small number of trusts are considered. This is likely to be a result of multiple factors including:
- the mix of schools within each trust (the balance between converter and sponsored academies, as well as free schools, university technical colleges and studio schools);
- local labour market conditions (how easily can the language teachers needed in order to enable EBacc entries be found?)
as well as trust- and school-level policies on curriculum and qualifications. In itself, our finding about ECDL entry rates suggests that among the largest trusts there may be a reasonably large degree of autonomy given to member schools on these matters.
Now, explore how qualification entries in your school differ from national patterns in the new report available in FFT Aspire. To download a copy, log in to FFT Aspire, go to the downloads menu in the top right-hand corner (↓) and choose ‘FFT special reports’. Or explore MAT-level data available here [XLS].
Want to stay up-to-date with the latest research from FFT Education Datalab? Sign up to Datalab’s mailing list to get notifications about new blogposts, or to receive the team’s half-termly newsletter.


Leave A Comment