Did free schools get great GCSE results in 2018 simply because they are new schools?
This has been suggested by several educators recently, so we decided to look across all secondary schools that have reported their first set of GCSE results, both prior to the introduction of the free schools policy and since.
Before free schools were introduced, new secondary schools were relatively rare – just a few opened each year.
We have managed to find 55 local authority-maintained schools and 13 sponsored academies that, as far as we can see, were entirely new secondary schools reporting their first GCSE results between 2002 and 2016.
By contrast, 68 free schools have reported their first GCSE results since 2012. (Private schools that converted to free school status are excluded from this total, but free schools that have subsequently closed are included.)
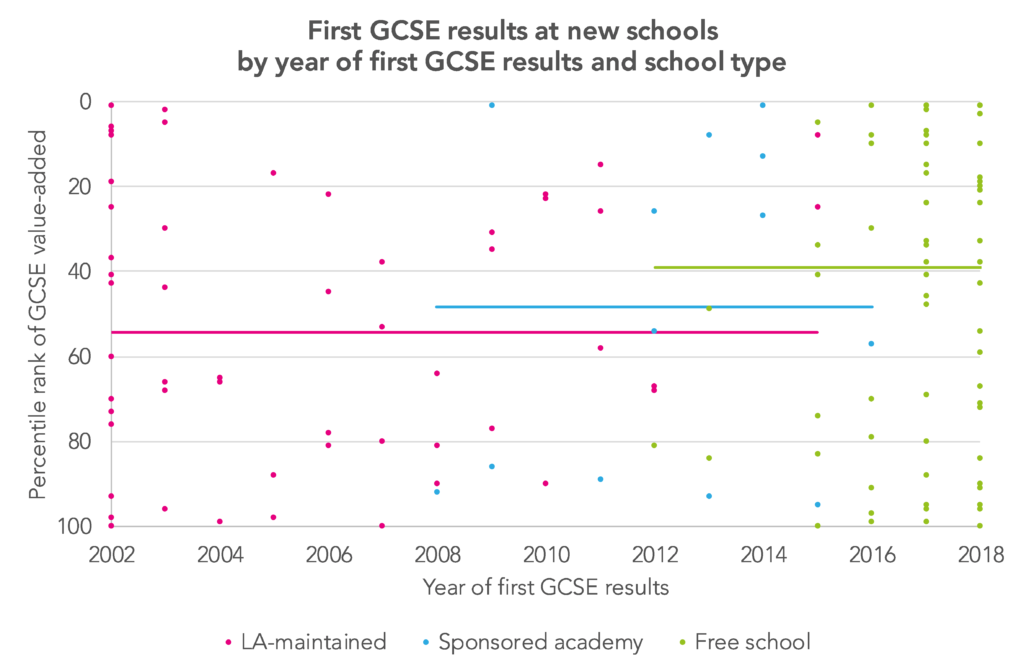
Over this period, official school league table metrics have changed, but some measure of consistency can be achieved by looking at each school’s percentile against the national distribution on the relevant value-added (progress) measure.
A score of 1 places the school among the highest scoring in the country, and 100 places it among the lowest scoring.
The chart below plots a single point for each school’s first GCSE results – pink for local authority-maintained schools; blue for sponsored academies; green for free schools.
The pink, blue and green lines show the average first year ranking for the three school types, weighted by pupil numbers.
The position of these lines for the non-free schools – around the 50th percentile mark – seems to imply that they are pretty typical of other secondary schools. This suggests that it doesn’t seem to be much easier to open a brand new school than it is to run a long-standing school.
What of free schools?
Overall, free schools have reported slightly better than average results – and if anything this seems to be increasing with new waves of first GCSE results. It is this that has made the contribution to the 2018 examination round being so successful for free schools.
This tells us little about how the policy is going to work out in the longer-run, once pupil intakes and school policies have stabilised.
For free schools which have reported multiple years of results, a number have seen their exam performance substantially improve or deteriorate. However, the average second year results at free schools are little different to the first year results.
But what we can say is that it doesn’t appear to be their newness that makes them a little more high performing than we might expect.
Want to stay up-to-date with the latest research from FFT Education Datalab? Follow us on Twitter to get all of our research as it comes out.


I wonder if there’s a difference between schools which open in areas where the LA has identified a need for spaces, and those which are driven more by providers.
Has the trend for some new schools to open with a strong and clear ethos from the outset in areas without significant need for places meant that they’ve recruited a slightly different cohort? More driven / engaged families?
Probably very hard to measure… But I find it hard to imagine that it’s simply their legal status which has led to stronger results.
That’s certainly something we expect to see when our free school gets its first set of GCSE results this year. It takes children from across the borough and it does have a very distinctive offer … and while it has an average-to-above rate of pupils on FSM, the anecdotal evidence is that the nature of the cohort is quite different from what you would expect purely from the stats … a bit like non-catchment church schools, the parents who choose to send their kids to a school further from home because of its ethos, values and curriculum rather than just going to their local catchment school are going to be parents who are that bit more motivated and engaged, regardless of whether they meet the financial criteria for FSM.