Provisional Key Stage 4 data for 2018 has been published this morning.
With a change in how English Baccalaureate (EBacc) attainment is measured, among other changes, what are the key points?
1. EBacc entry rates are up a fraction
Entry rates for the government’s English Baccalaureate have increased marginally, with 38.4 percent of pupils sitting subjects that count in the EBacc, up from 38.2 percent last year. The notable gender split – 44.2 percent of girls entered the qualification, compared to just 32.8 percent of boys – remains.
In the summer, the picture for modern foreign languages entries at GCSE looked better than it has in recent years, with entries in German and Spanish up slightly, and those in French only down a little after years of steep decline.
Despite this, a smaller proportion of pupils in England actually entered qualifications that counted in the languages slot of the EBacc: 46.1 percent of pupils did so in 2018, down from 47.4 last year.
At least some of the increase in individual GCSE languages entries is believed to have been pupils switching away from IGCSEs – which ceased to count in league table calculations this year. So it looks as if changes in GCSE entry numbers have not actually compensated fully for a decrease in the numbers taking language IGCSEs.
The increase in the overall EBacc entry rate is explained by a sizable increase in the proportion of pupils entering two or more science subjects – up from 91.3 percent to 95.4 percent – and a smaller increase in the proportion entering history or geography – up from 76.8 to 78.3 percent.
2. Changes to science GCSEs appear to have driven a change in entry patterns
The proportion of pupils taking three science GCSEs is at its highest level in recent years, with 27.5 percent of pupils doing so this year – up from 25.2 percent last year. (Computer science counts here, along with biology, chemistry and physics.)
And the new double award science GCSE, which replaced core and additional science GCSEs, also seems to have led to more pupils taking two sciences. A total of 67.9 percent of pupils took double award science this summer. Last year, 66.2 percent of pupils took two science GCSEs.[1]
3. We have the first set of EBacc average points score results
This year EBacc attainment has newly been measured as an average points score (APS), rather than as a percentage achieving a certain grade in subjects that count in the EBacc. At a headline level, the APS was 4.03, corresponding to just over a standard pass on the new GCSE grade scale. Boys had an APS of 3.79, and girls one of 4.28.
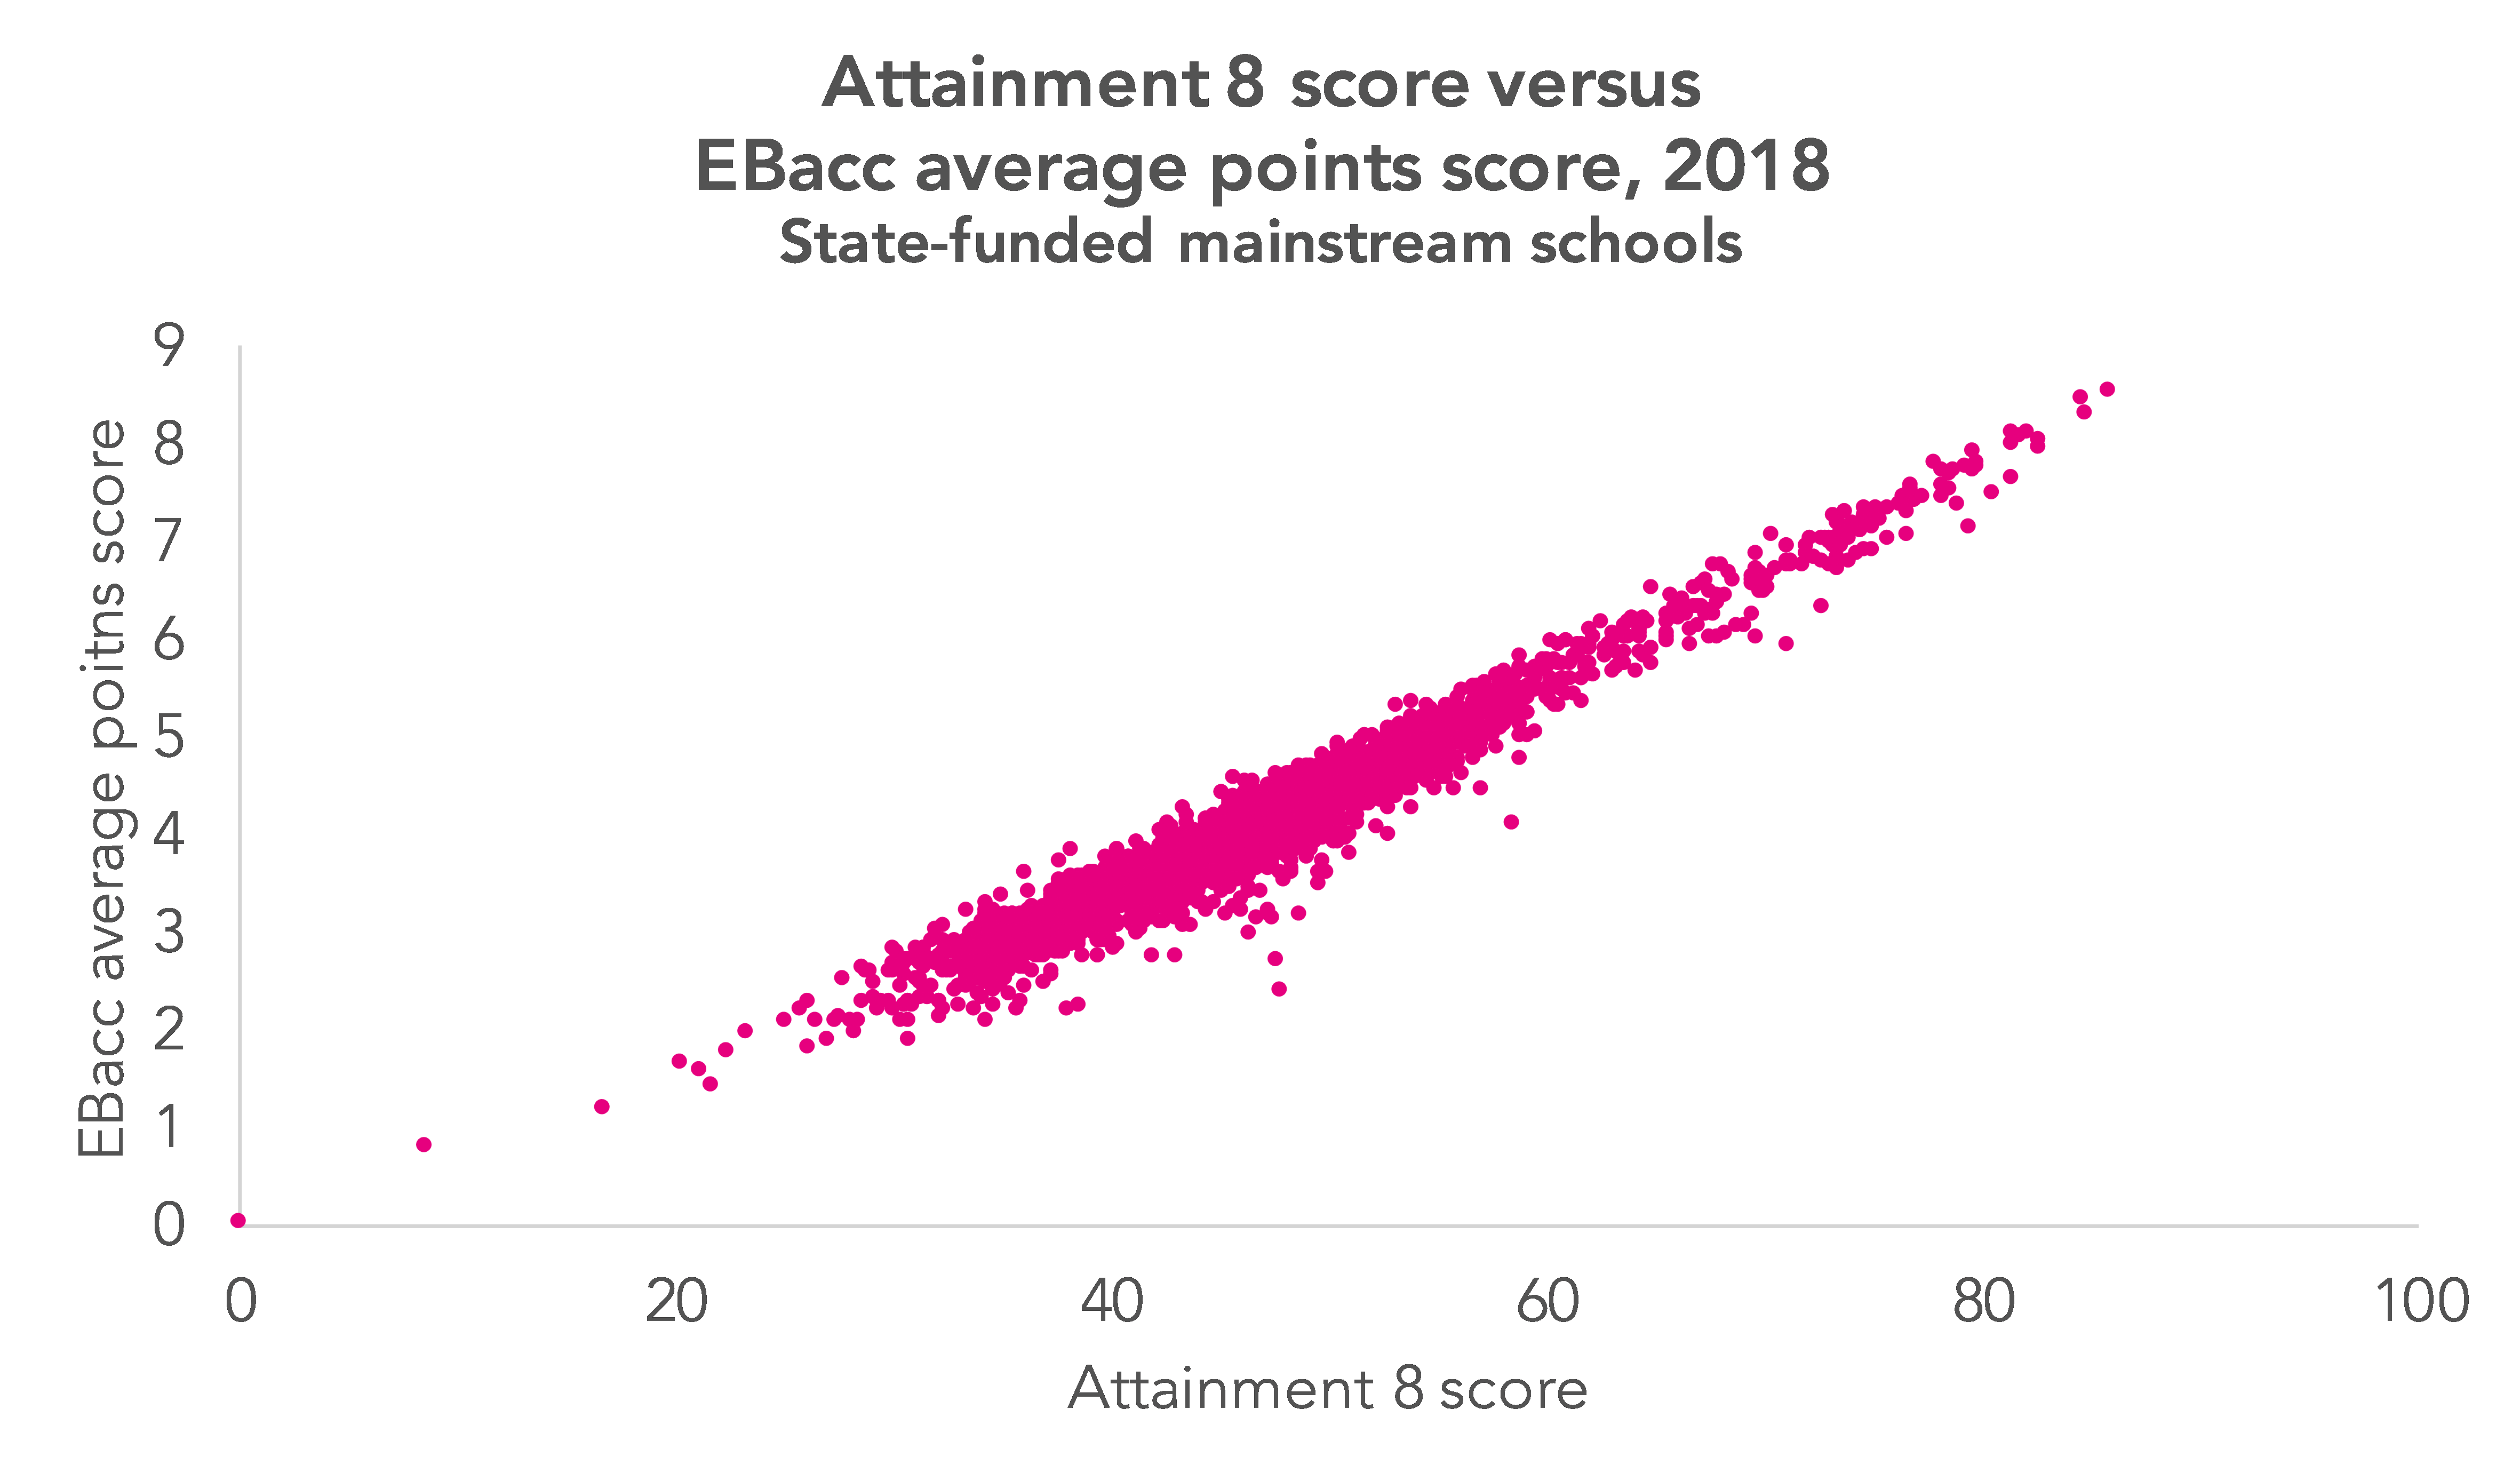
When the EBacc APS was announced, we noted that, based on our calculations, it looked the correlation with Attainment 8 scores (in which at least five of the subjects which count for a pupil will be EBacc subjects) would be very high – and that you may as well call the Attainment 6.
The chart below shows Attainment 8 scores plotted against an EBacc APS scores. The overall correlation is 0.97. We’ll leave it to you to decide whether this measure adds much, over and above what Attainment 8 already tells us.
4. There has been a slight dip in the number of A8 slots pupils filled
Attainment 8, one of the government’s headline school performance measures measured attainment in a basket of eight subjects: English and maths, three subjects which count in the EBacc, and three other qualifications.
Almost all pupils take English and maths. The average number of EBacc slots filled by pupils remained unchanged this year, at 2.8 out of the possible three slots. The average number of entries in the three ‘open’ slots decreased slightly, though – from 2.9 to 2.8. This is likely to have been driven to a large extent by the fact that the European Computer Driving Licence, or ECDL, no longer counts in school league tables, where previously it did. Entries in all eligible vocational ICT qualifications quals, of which ECDL will have been the biggest component, fell from 174,000 to 52,000 this year, with a fall in the percentage achieving a level 2 pass (grade 4/C or above) from 96% to 79%.
5. Progress 8 scores in the north tend to be lower, but it’s not all about school effectiveness
Large differences in Progress 8 scores remain between London and the north of England. The difference between the north east and London in 2018 was 0.46, equivalent to almost half a grade in a reformed (9-1) GCSE.
The chart below shows the full picture. (The south east had an average P8 score of zero.)
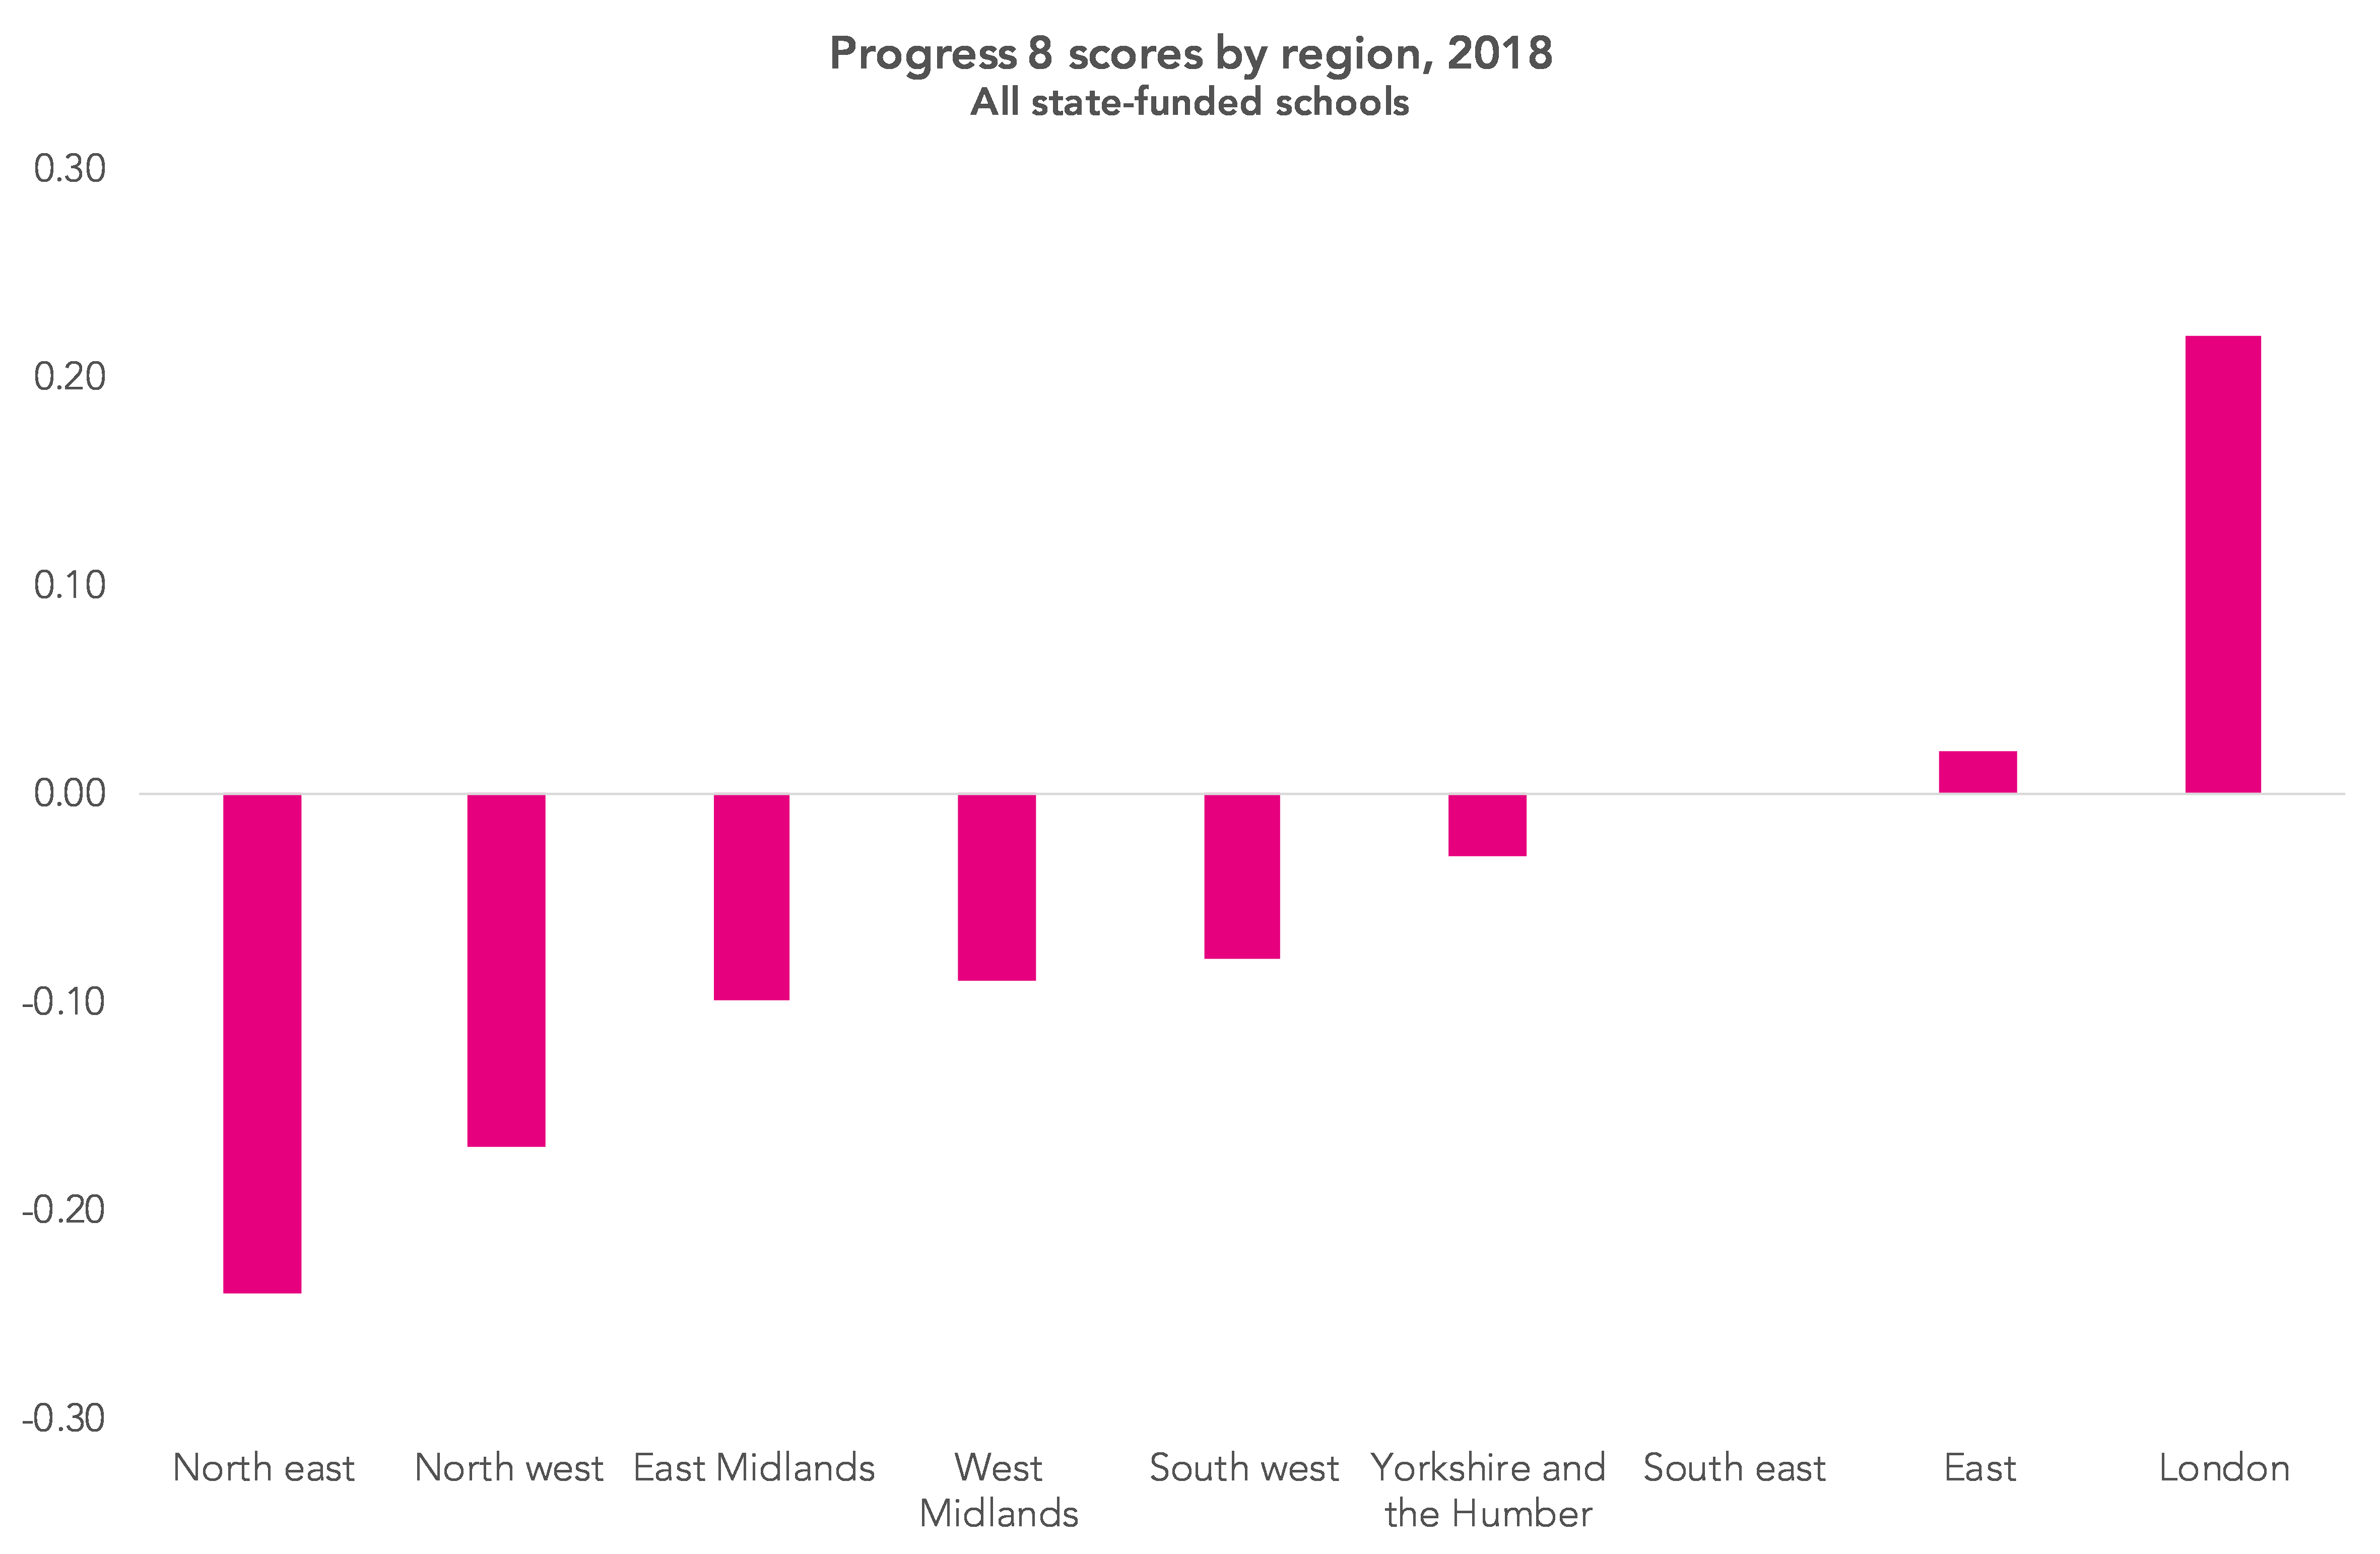
Given that Key Stage 2 attainment has continued to improve in the north east at a fair rate since 2013, when the 2018 Key Stage 4 cohort would have been assessed, this gap may well widen further in the years ahead.
Knowsley remains the local authority with the lowest Progress 8 score. Compared to the highest performing local authority, Barnet, pupils achieved the equivalent of almost a grade and a half per subject lower in each of the 10 slots of Progress 8.

But, as we wrote here, scores tend to reflect the areas schools serve, rather than differences in their effectiveness.
Want to stay up-to-date with the latest research from FFT Education Datalab? Follow us on Twitter to get all of our research as it comes out.
- Last year, 65.7 percent of pupils took core and additional science GCSEs, and 0.5 percent took the old double science GCSE.


It would be interesting to look at the correlation between Attainment 8 and EBacc APS as to whether there are any factors that affect how close it is … eg, are schools serving deprived cohorts more likely to see a lower APS score than the overall trend would predict?
Hi Stephen. The correlation looks to be a little higher for low-FSM schools. Dividing percentage FSM as follows, we get:
This is roughly how it looks:
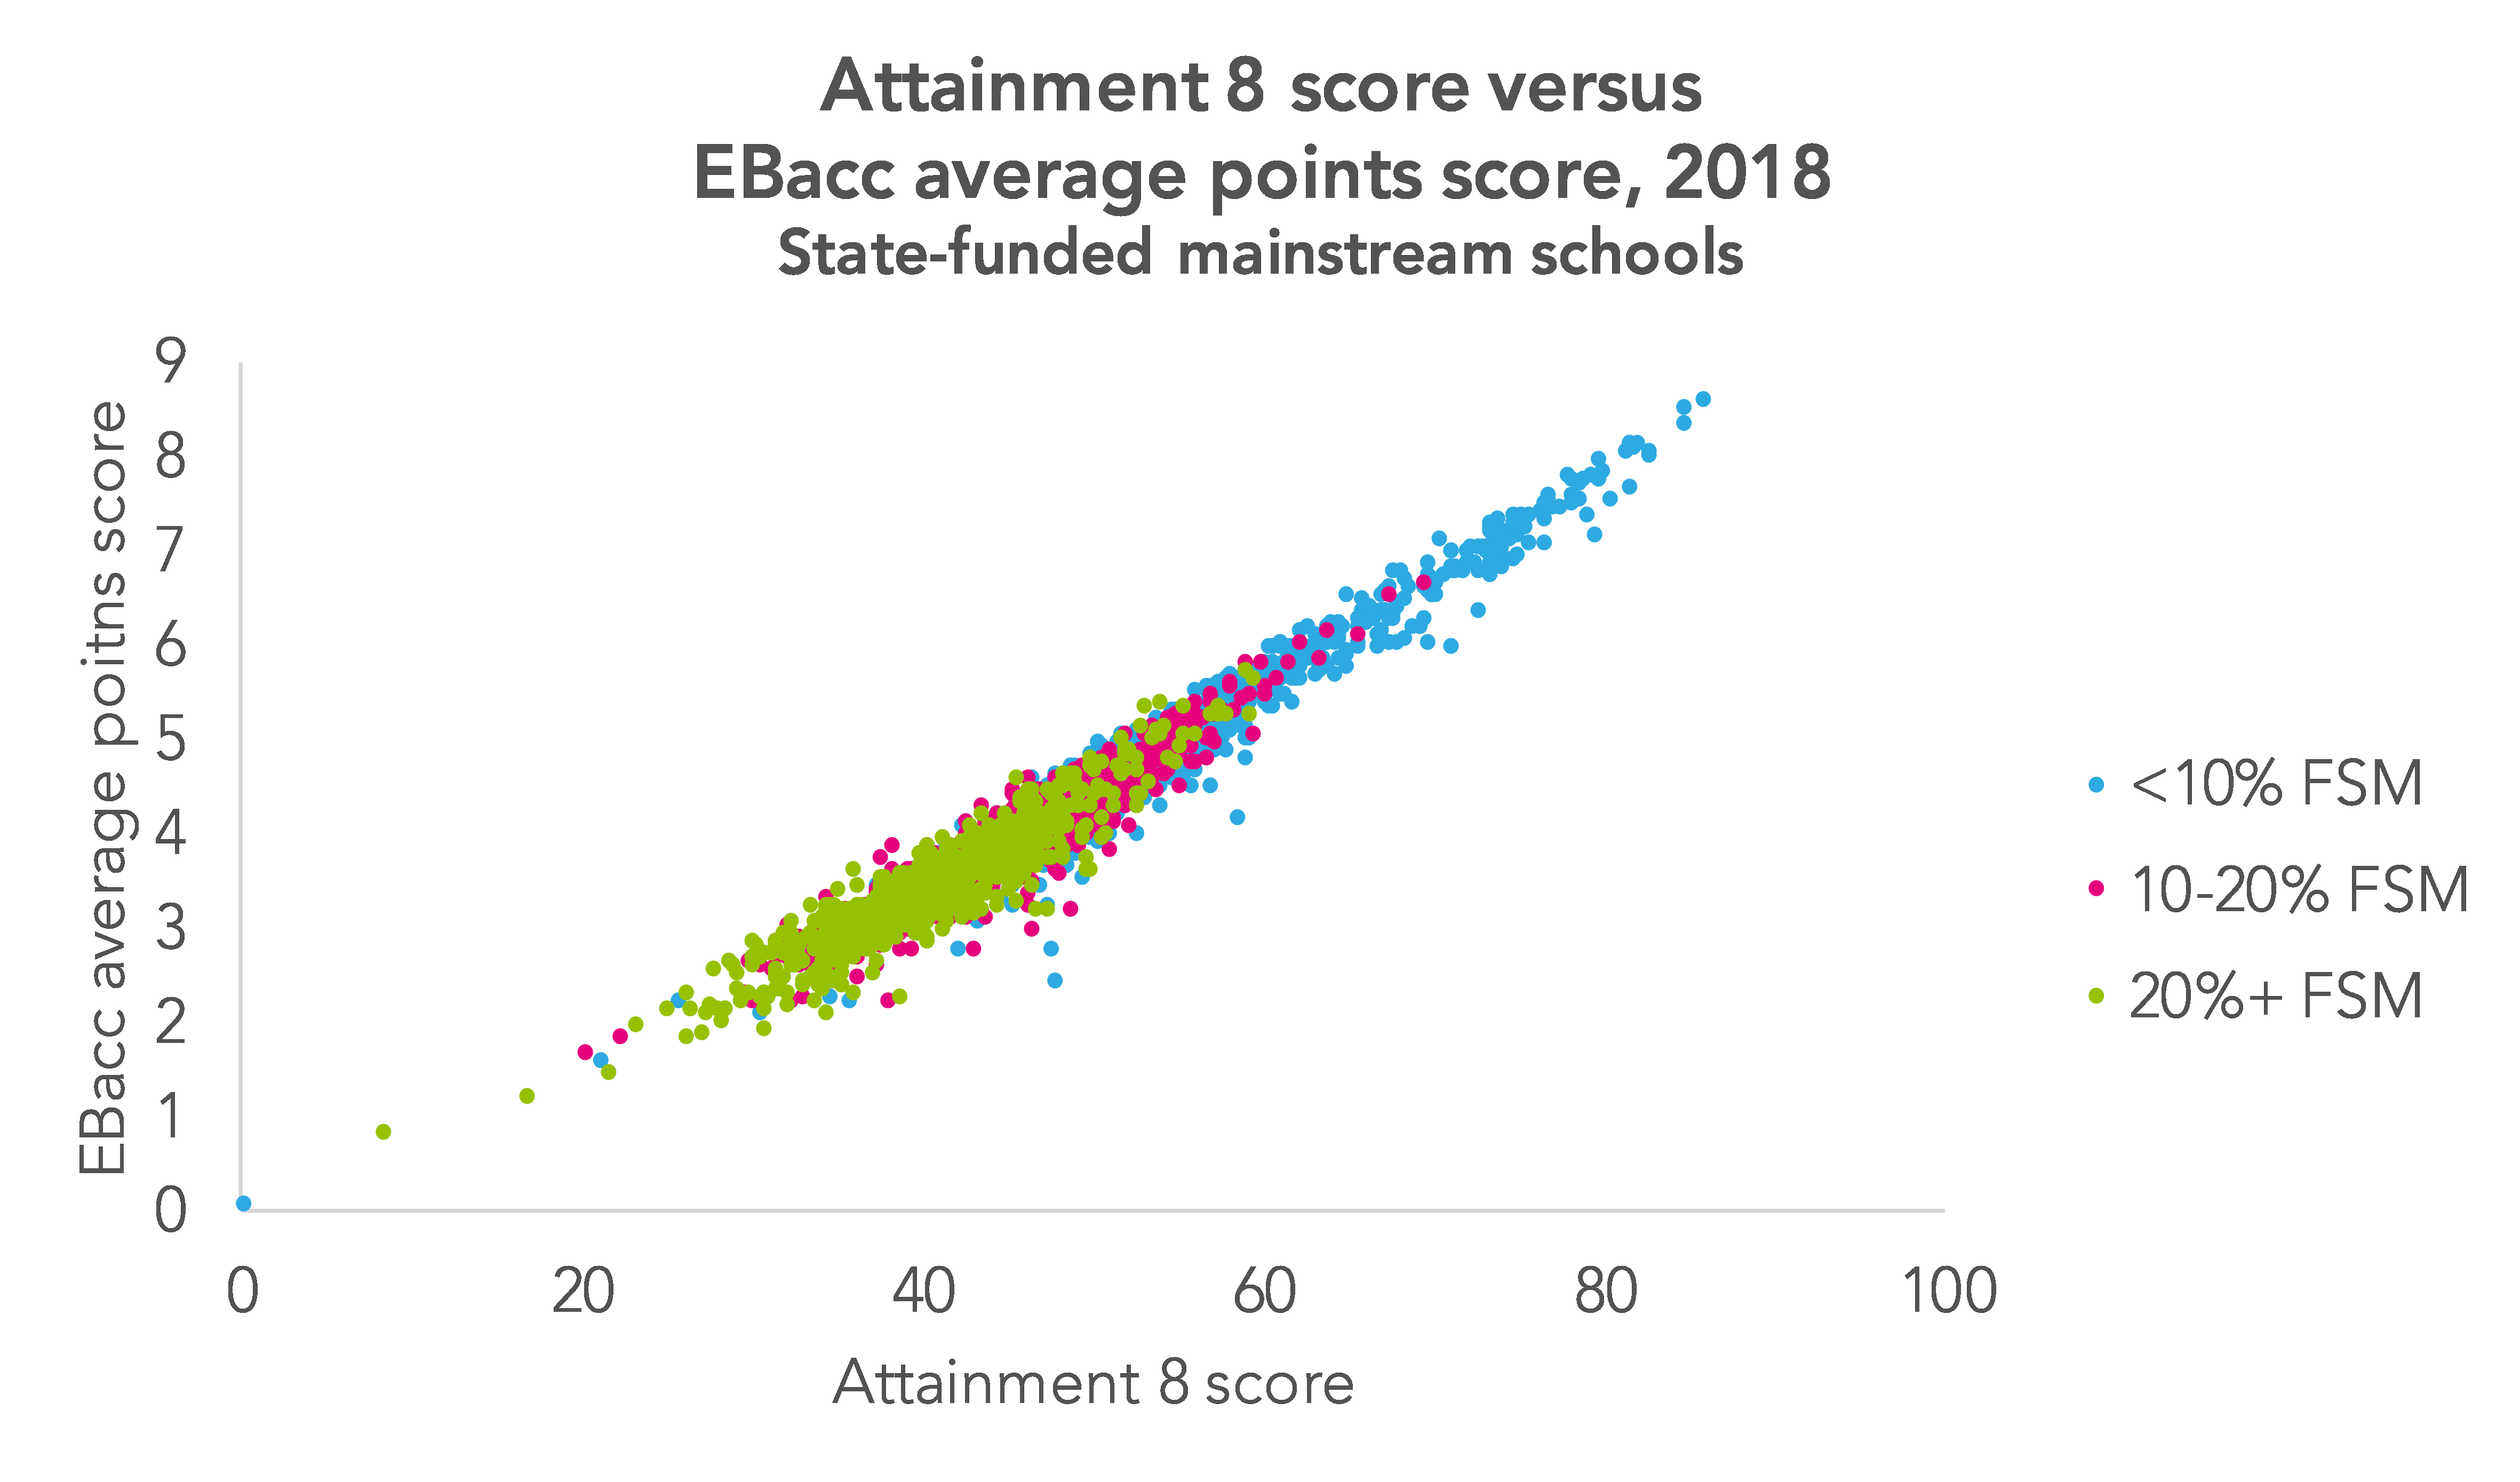
Hi Philip, thanks for adding that detail in. Interesting that while the correlation might be higher for low-FSM schools, that may be more to do with where they sit on the chart rather than the fact that they are low-FSM … the outlier schools falling well below the pack are mostly low- and medium-FSM. Difficult to get a really detailed picture from just looking at blobs, maybe I need to plug it into Tableau myself and have a play!
The tables showing lowest and highest P8 seem to be based on SFR which was subsequently updated.
Thanks for the comment, Lesley. You’re entirely right: the DfE has published a revised set of local authority figures the day after the original SFR – on which this analysis is based – was published. This is what the table of highest and lowest P8 scores looks like using this updated data:
The chart showing regional P8 scores would also look fractionally different.
Is individual Ebacc APS, school average APS, or LEA average APS?
I couldn’t find any data by individual APS, so assuming one of the latter two.
Hi Richard, yes that’s right. School and LA-level figures are available in performance tables, but individual EBacc APS isn’t available anywhere.