We’ve written on a number of occasions about the European Computer Driving Licence, or ECDL.
It was announced in March 2017 that the qualification would no longer count in the school league tables, starting in 2018, after gaming concerns. (Namely, around the qualification’s equivalence in size to a GCSE in league table calculations, despite a small number of teaching hours, and the value of ECDL grades in these calculations being out of kilter with pupils’ results in GCSEs.)
As we observed earlier this year, ECDL entry rates varied enormously between multi-academy trusts (MATs) in 2017.
So we might wonder: now that the qualification no longer counts in school performance measures, how have the Progress 8 scores of MATs changed?
The data
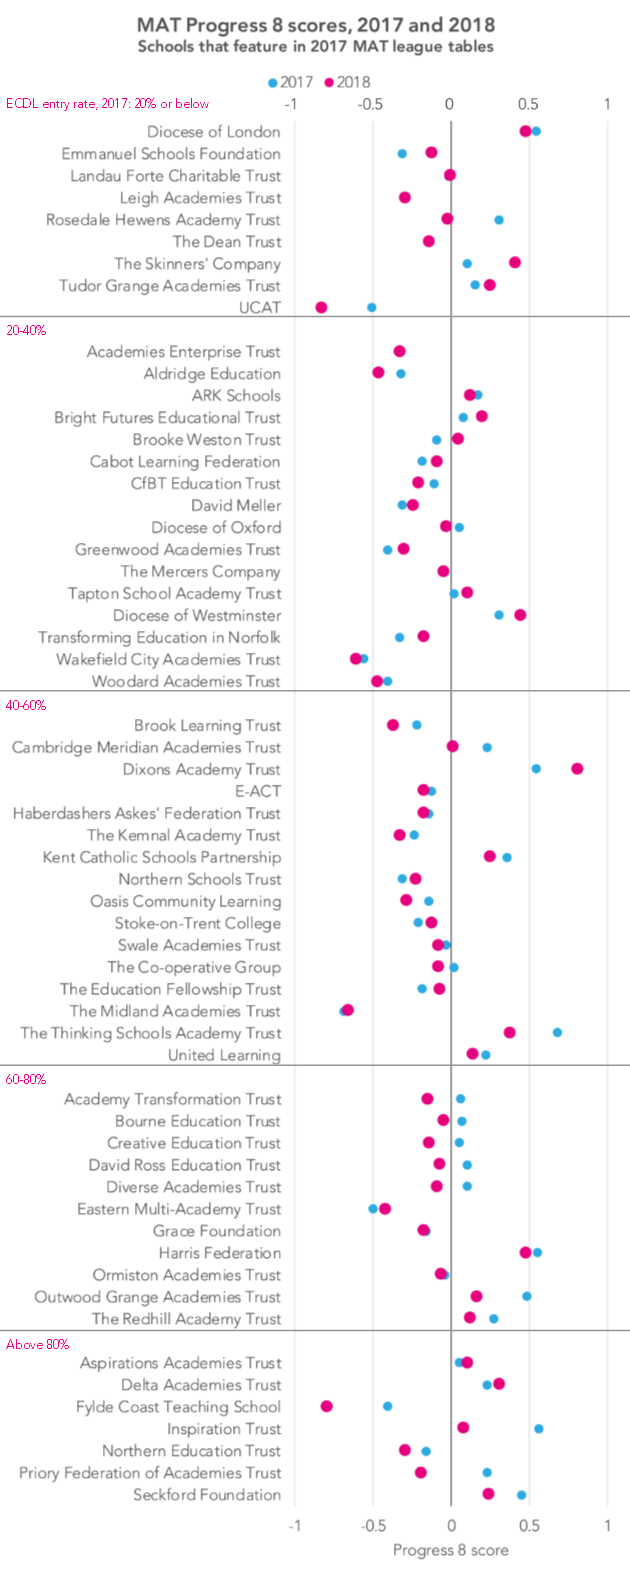
There are two charts below, that show the change in MAT P8 scores between 2017 and 2018 (the first chart) and what those two P8 scores were (the second chart).
Trusts are grouped according to the proportion of their cohort who entered ECDL in 2017 – ranging from those where 20% or less of pupils took the qualification at the top of the chart, to those where more than 80% of pupils took the qualification at the bottom of the chart.
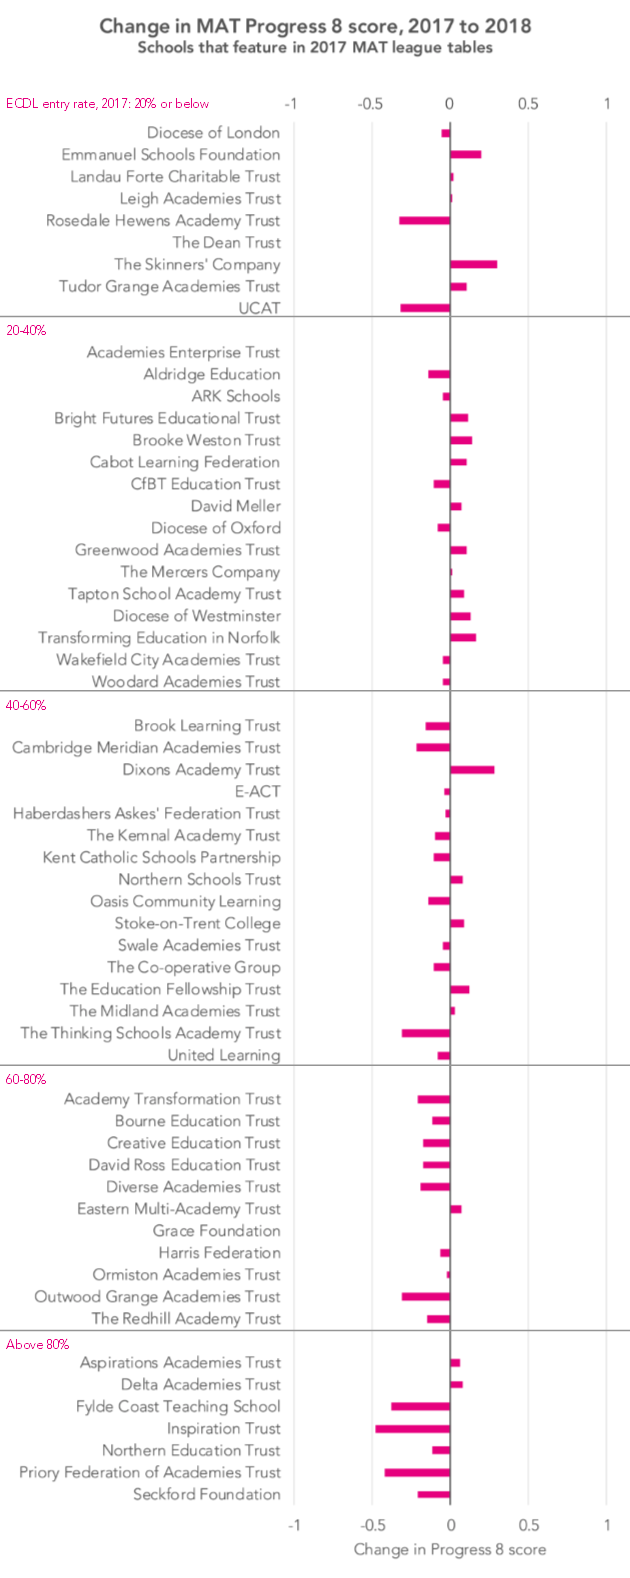
Schools included here are those that featured for a given trust in the 2017 MAT league tables – schools had to have been part of a given trust for at least three years in order to count. ECDL entry rates for these trusts are based on this same population of schools.[1]
A clear relationship is visible, with those trusts that had higher ECDL entry rates on average being more likely to have experienced falls in their P8 scores between 2017 and 2018. (The correlation coefficient is minus 0.43 – a moderately strong correlation.)
Looked at another way, the table below puts trusts into bands based on their 2017 ECDL entry rates.
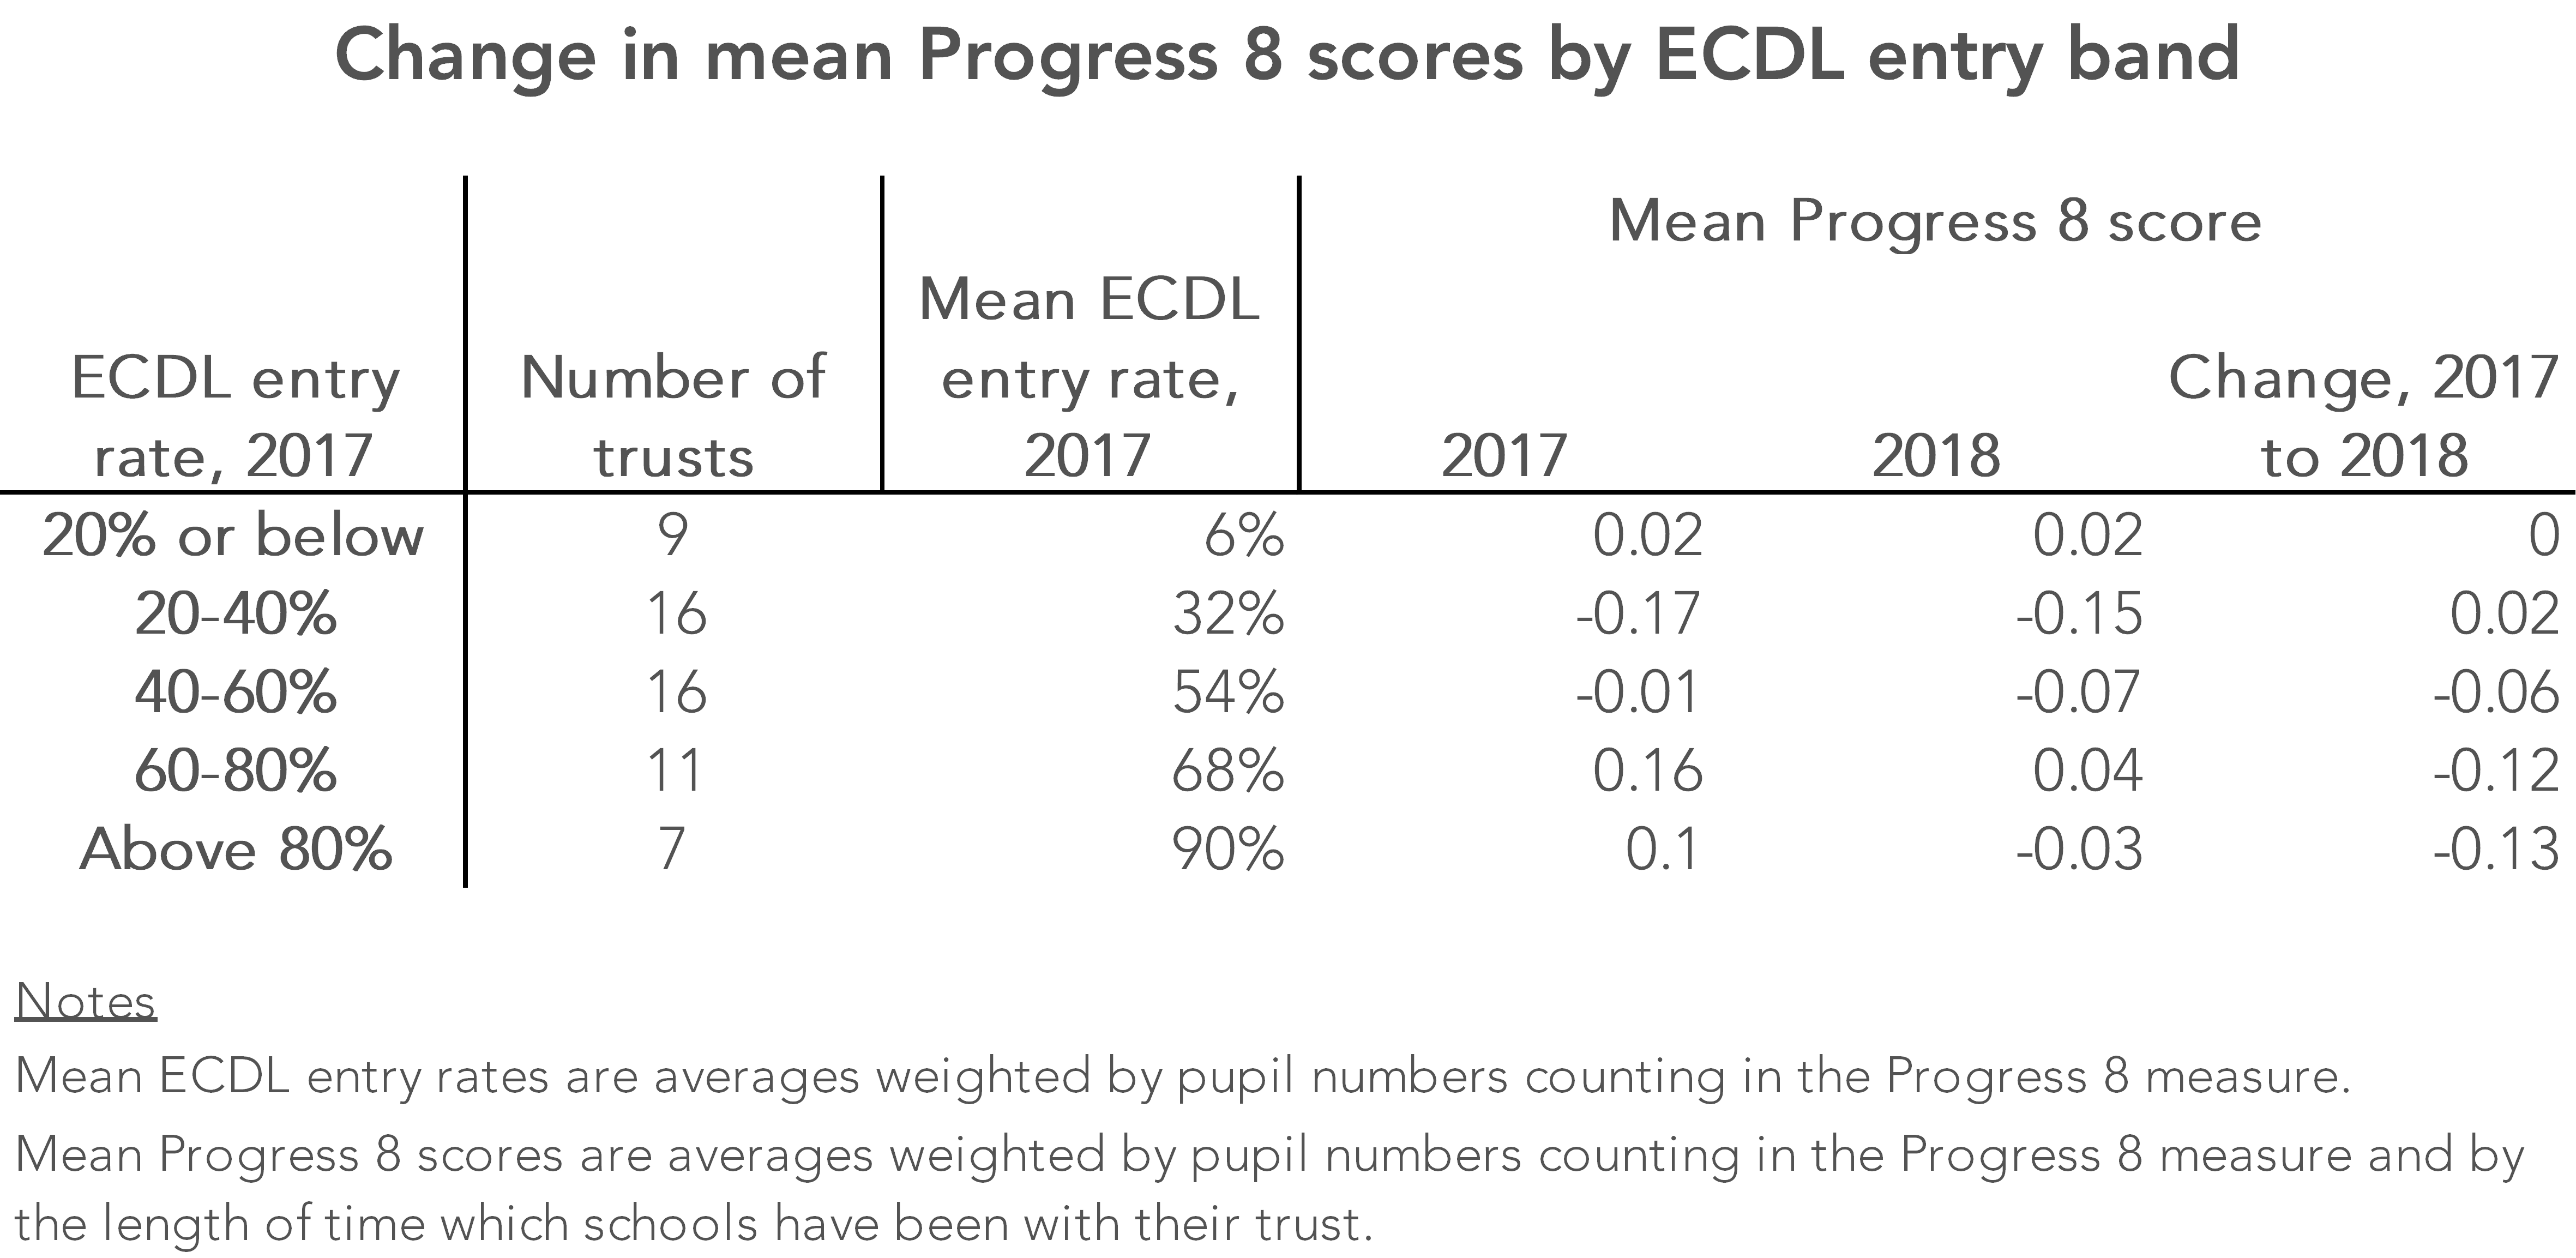
Among MATs with ECDL entry rates of 40% or less, on average there was no change in trust P8 score between 2017 and 2018, or a slightly positive change.
But among MATs which entered more than 80% of their pupils for ECDL in 2017, on average there was a drop in their P8 score of 0.13.
At an individual trust level, some of the falls are much greater: -0.38 at the Fylde Coast trust’s three schools that featured in the 2017 MAT league tables; -0.42 at the Priory Federation of Academies Trust’s four schools; and -0.48 at the Inspiration Trust’s three schools included in the analysis. Despite these trusts’ high ECDL entry rates in 2017, decreases of these magnitudes are unlikely to be accounted for by the removal of ECDL from performance measures this year alone – we think perhaps half of the change could be accounted for by this one factor.
(It is worth saying that there’s more variability in value added scores from year-to-year than there is in attainment measures, so we shouldn’t be surprised to see small changes at trust level.)
A couple of other things to say. Firstly, the 2018 data is provisional data that was published last month. Between the publication of this data, and the publication of revised data in January, schools will have had the opportunity to suggest corrections that are required.
And when the 2018 MAT league tables are published in January, as well as the schools included in the analysis here, the figures will take into account a number of schools that have opened or joined a MAT recently, which didn’t count in the 2017 MAT league tables.
But this analysis suggests that trusts with high ECDL entry rates on the whole may see their reported performance drop this year, in some cases by large amounts.
The upshot
While some might be tempted to take satisfaction from a tumble in the relative rankings of other trusts, particularly where performance in previous years has been propped up by ECDL entries, schadenfreude would be the wrong reaction.
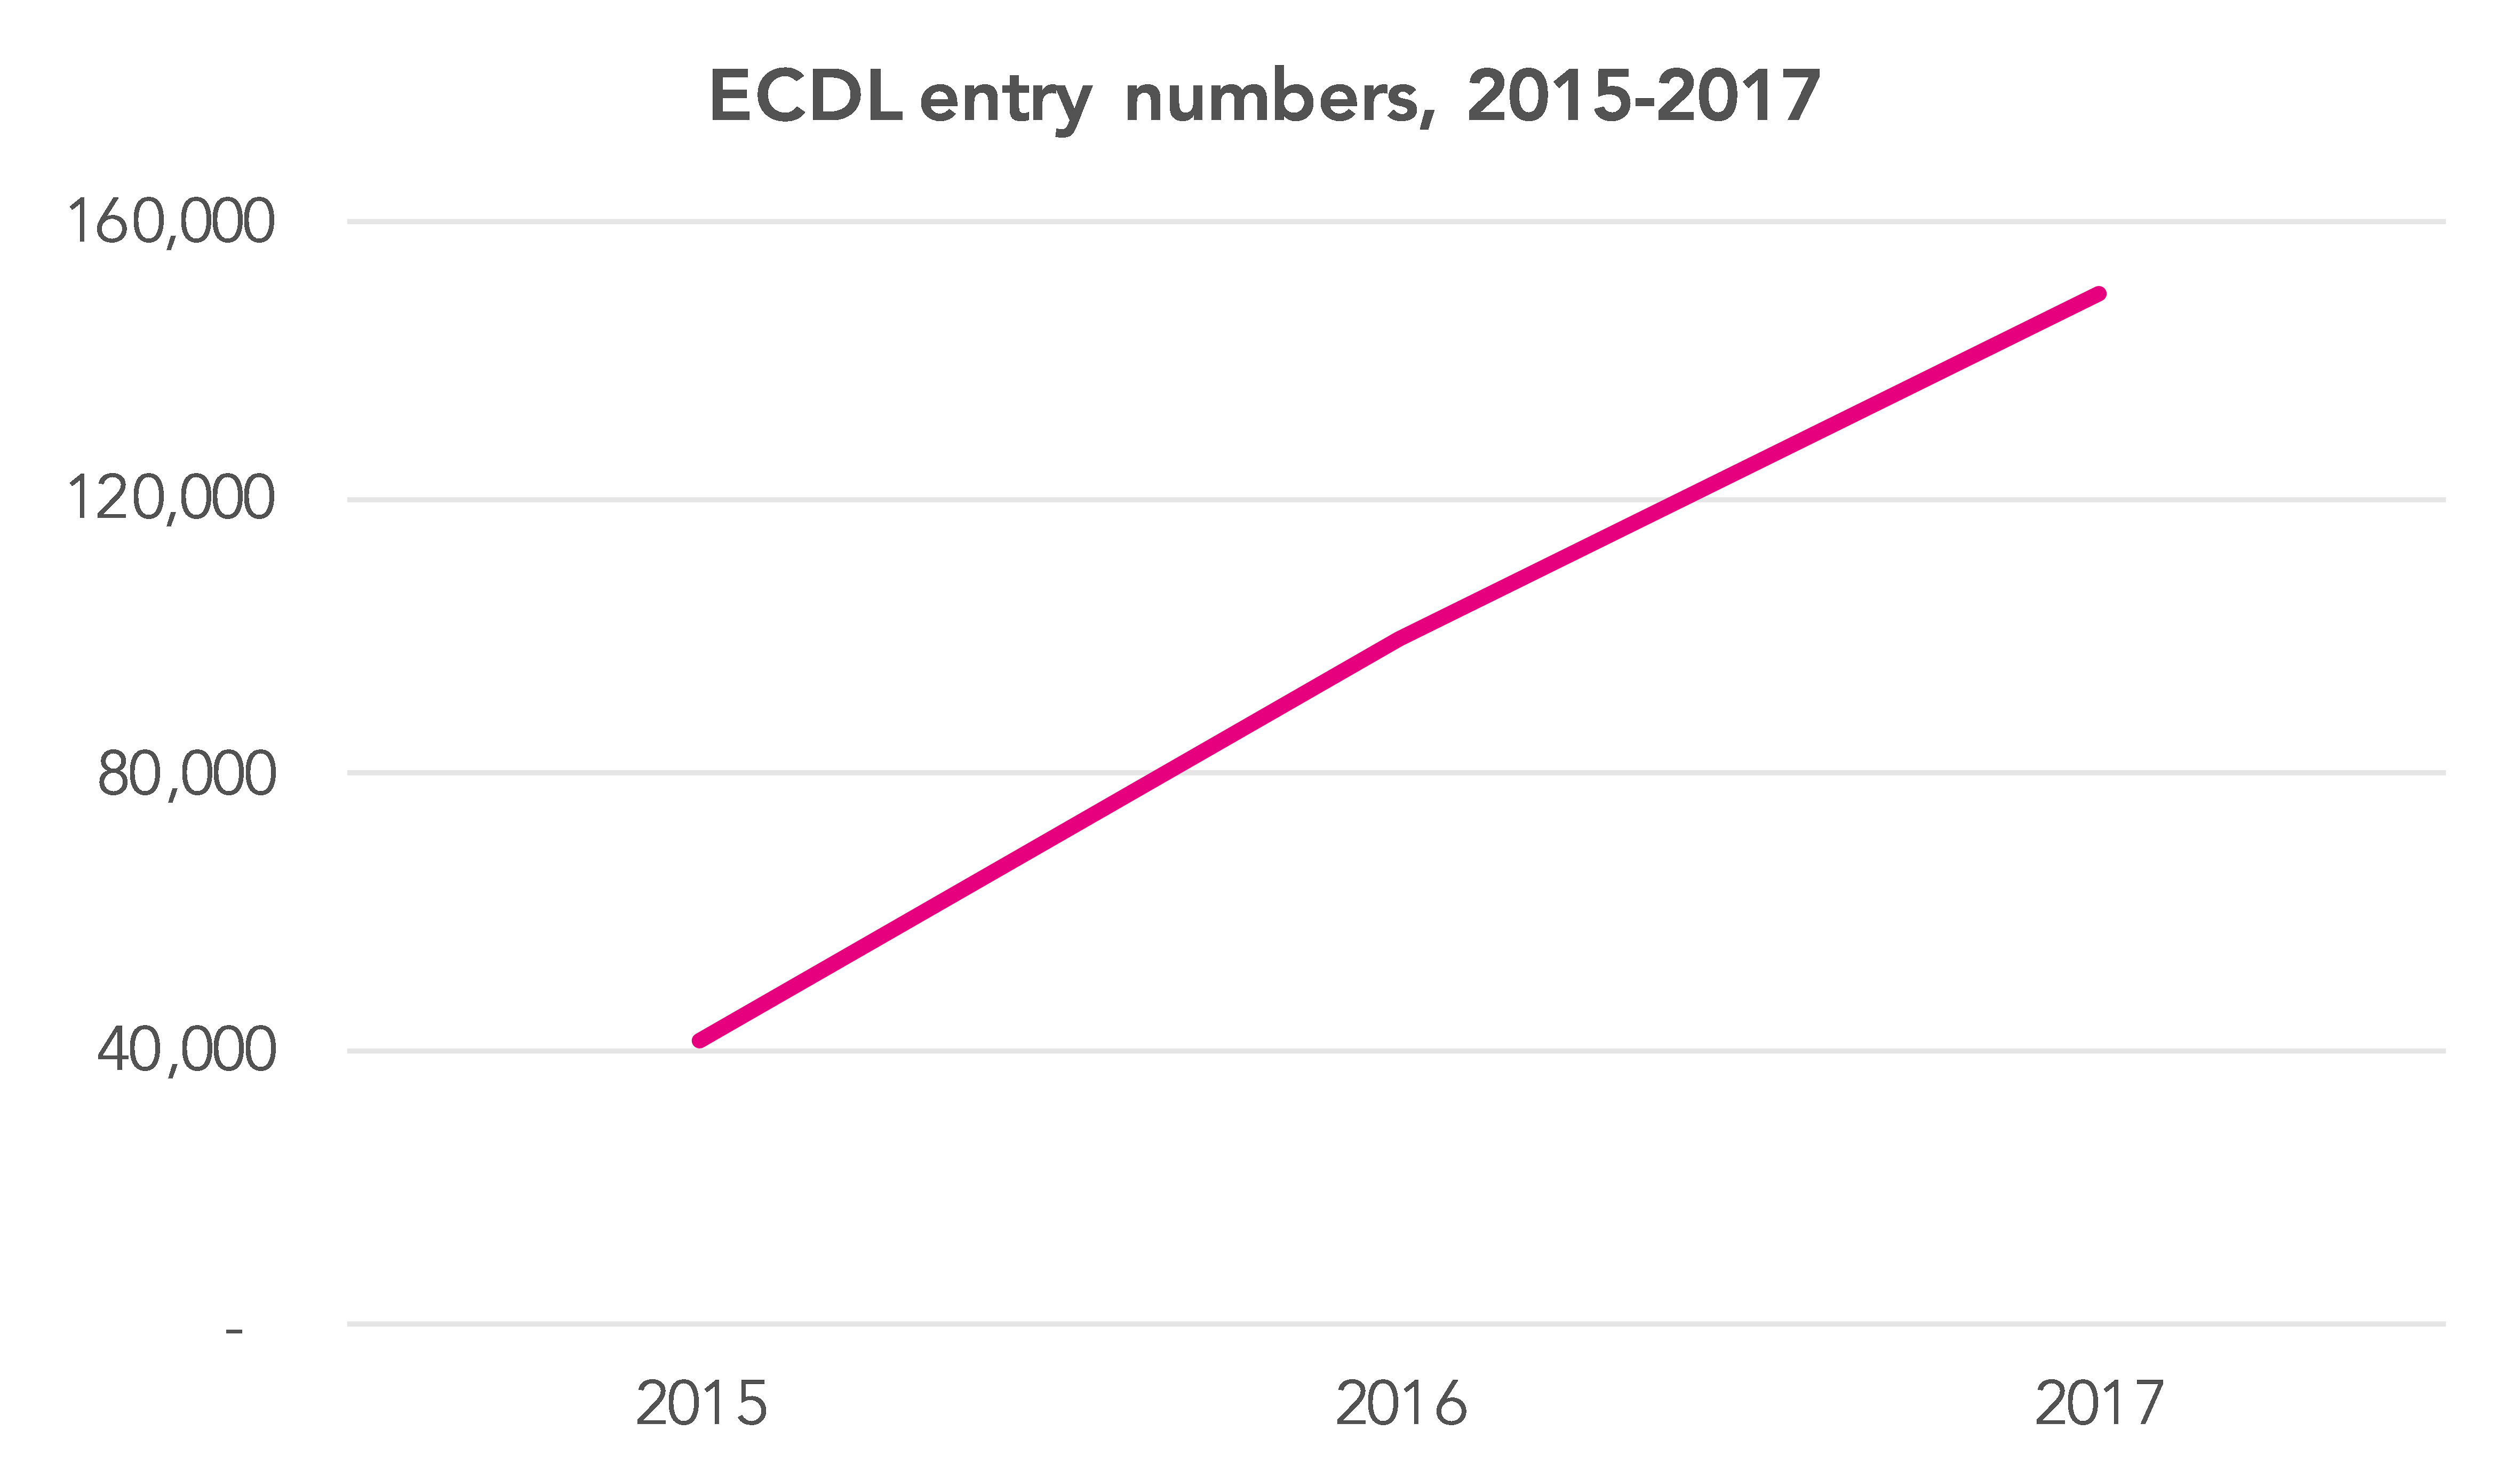
ECDL has been in widespread use since 2015, with the number of entries soaring between 2015 and 2017, as the chart below shows. For context, the 150,000 entries in 2017 was more than a quarter of all pupils taking GCSEs that year.
Now that the main headline measure on which secondary school performance is measured is a zero-sum one, once some schools identify that there’s benefit to be achieved from entering certain qualifications or groups of qualifications, it is no surprise that others will follow suit.[2]
So rather than taking pleasure in the righting of apparent league table wrongs, much better would be to focus on drawing attention to the pressures that lead to gaming behaviour.
Want to stay up-to-date with the latest research from FFT Education Datalab? Follow us on Twitter to get all of our research as it comes out.
1. The approach followed here is in line with that used for the Department for Education’s MAT league tables in 2017. Trust-level P8 scores are calculated by weighting school-level P8 scores by the number of pupils counted in P8 calculations at each school and by the number of years which a school has been part of a trust, capped at a maximum of five years. Only schools that have been part of a trust for at least three years are included.
This analysis is based solely on those schools which counted for a given trust in the 2017 MAT league tables, though in working out 2018 P8 scores weightings have been adjusted by incrementing the number of years which schools have been with a trust.
Three trusts which featured in the 2017 MAT league tables are not shown here: one trust has closed, while the other two have been excluded from analysis because data for fewer than three schools was available.
In a small number of other cases, individual schools that counted in the 2017 MAT league tables have been excluded from the 2017 and 2018 figures here. This is the case where schools have closed, merged or changed trusts, or where published school-level P8 scores are not available for both 2017 and 2018, due to small pupil numbers.
It’s also worth saying that we don’t know yet whether the DfE’s MAT league tables methodology will change in 2018.


Very interesting as ever , thanks Philip. Could I ask, if the MATs were sorted by % Disadvantaged, could there be a correlation? Combining the impact of the removal of ECDL and the move for the vast amount of subjects from the old A*-G specifications with coursework elements to the 9-1 100% memory tests. There appears to be an average increase in P8 in the Grammar schools, high %HPA, low %DS schools.
Also when the element specific data is released, has there been a shift by the private sector away from iGCSE to allow students to achieve grade 9 and therefore in the norm distribution the comprehensive students are competing against more HPA students for the 2.6% of 9 grades. With the cascading effect down to 8, 7 etc grades.
Would love to see some analysis around this as we move towards a fairer OFSTED system incentivising working in tough deprived schools if Amanda Spielman manages to win her battle with Nick Gibb.
Jon Lunn, Director of Performance, Ted Wragg MAT
Hi Jon, thanks for the kind comment. I’ve just taken a quick look at the relationship between % FSM and P8 change for the schools in the trusts featured here, and there isn’t a strong correlation at all (-0.07).
Your question about grade 9 is an interesting one – will definitely aim to take a look at this when we have the data that will allow us to.