Over the years we’ve looked at exclusions, alternative provision and, in particular, pupils disappearing off school rolls.
In this blogpost, we will examine the intersection between these three things.
The situation by the end of Year 11
There were 557,000 pupils in the cohort that began Year 7 in state-funded schools (mainstream and special) in September 2010. For the most part, these pupils would have reached the end of Key Stage 4 in summer 2015.
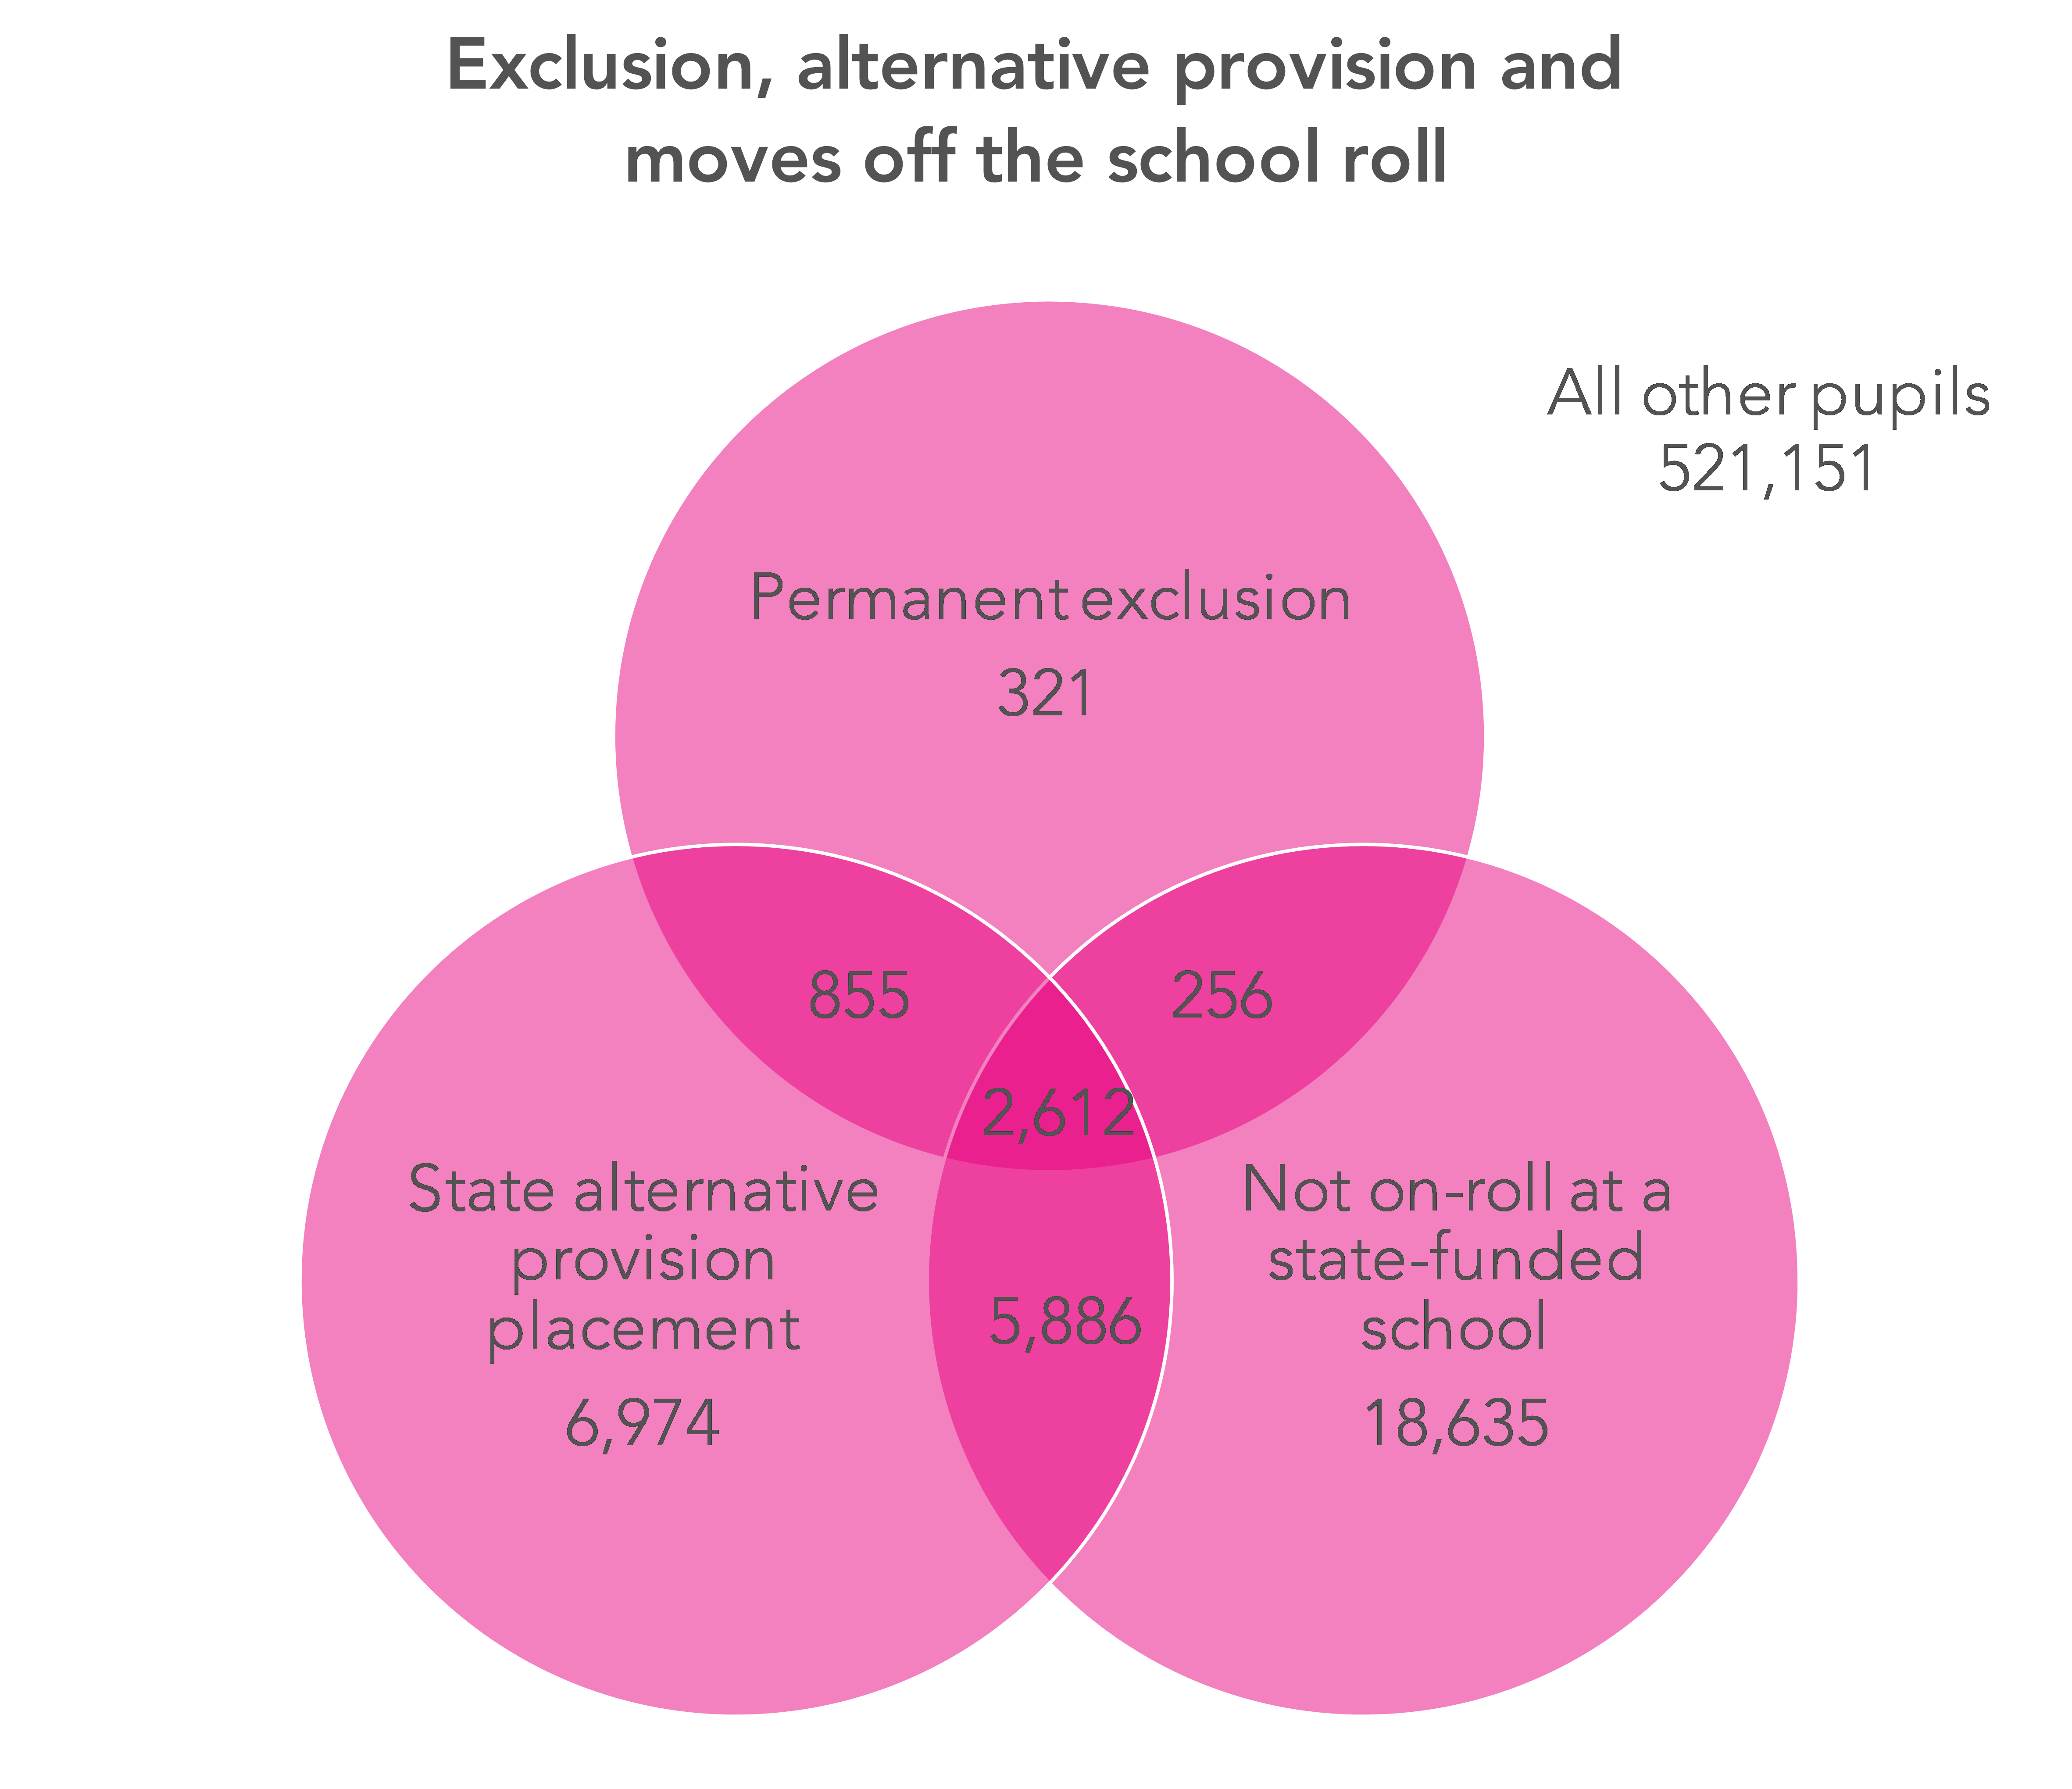
Between Year 7 and Year 11, over 4,000 of these pupils had been permanently excluded. A total of 2,612 pupils had been permanently excluded, been placed in state alternative provision and were no longer on-roll at a state school. A group of 1,176 (321 + 855) pupils had been permanently excluded but were still on-roll at a state school. A small group were permanently excluded and left the state school rolls without spending any time in alternative provision.
Almost 7,000 pupils had spent some time in state alternative provision without ever being permanently excluded, but were on-roll at a state school in January of Year 11. Some 6,000 others spent time in alternative provision without ever being permanently excluded, and left state school rolls.
A final group of more than 18,500 pupils left the state-funded school sector without having been permanently excluded or spending time in state alternative provision. This will including pupils who leave England, move to the independent sector and move to elective home education, among others.
Among those pupils we see leaving state school rolls without a permanent exclusion will be those who have been ‘off-rolled’ – encouraged off the roll of a mainstream school in an informal exclusion in which the school’s best interests have trumped the pupil’s.
As we’ve written before, we don’t think it’s possible to put an exact figure on the number who have been off-rolled, mainly because we do not know who has left the country.
The characteristics of pupils who experience these events
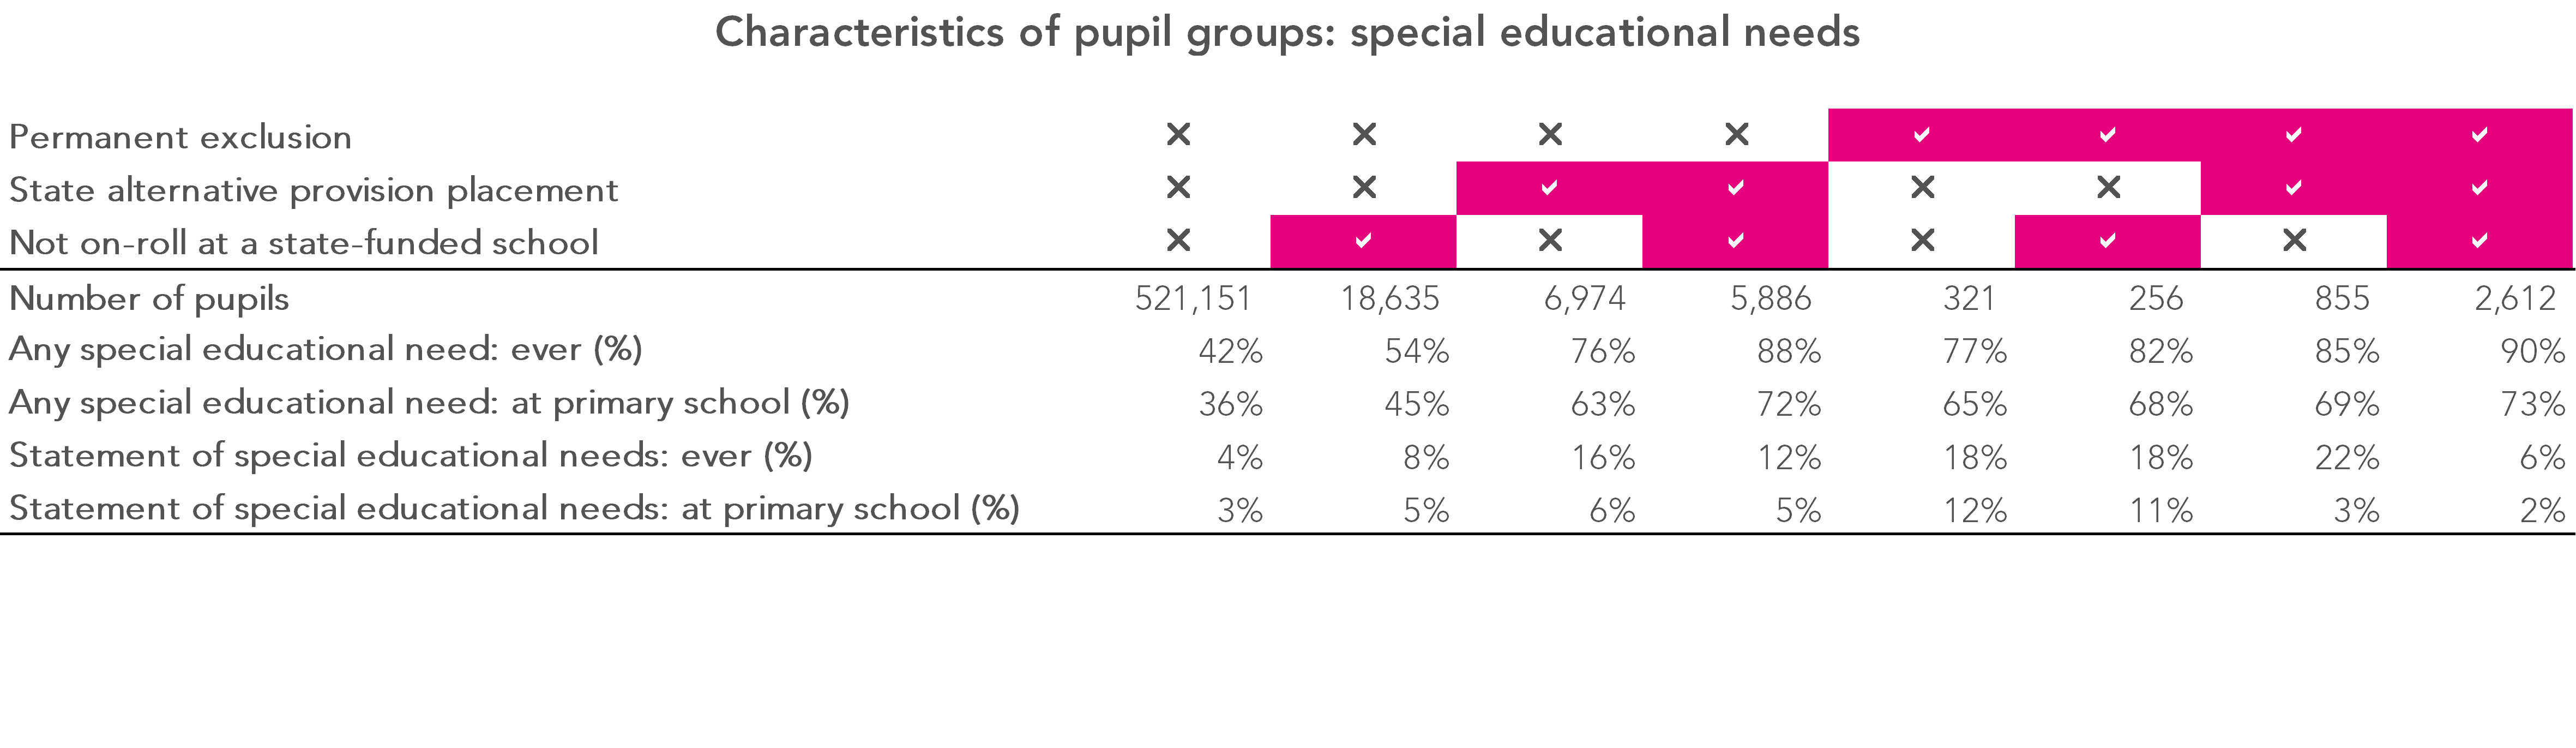
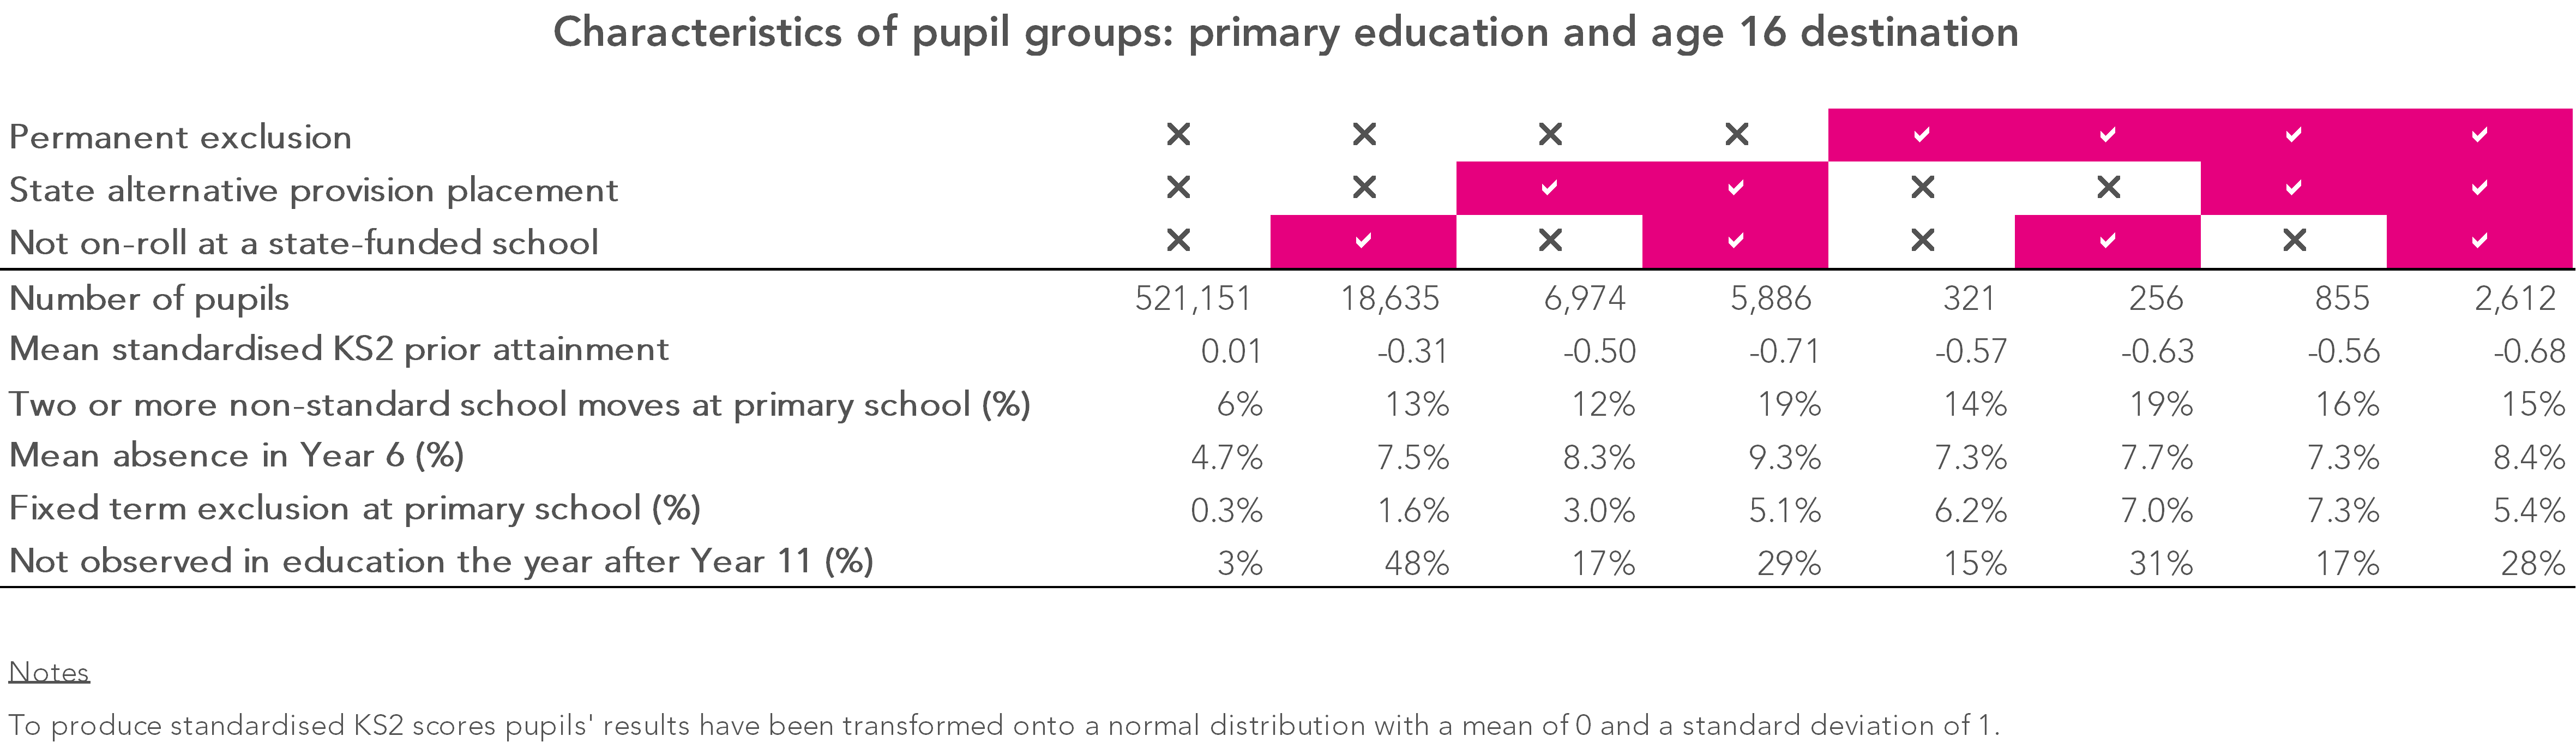
The table below summarises the characteristics of the pupils in each of the eight groups defined by the Venn diagram above.
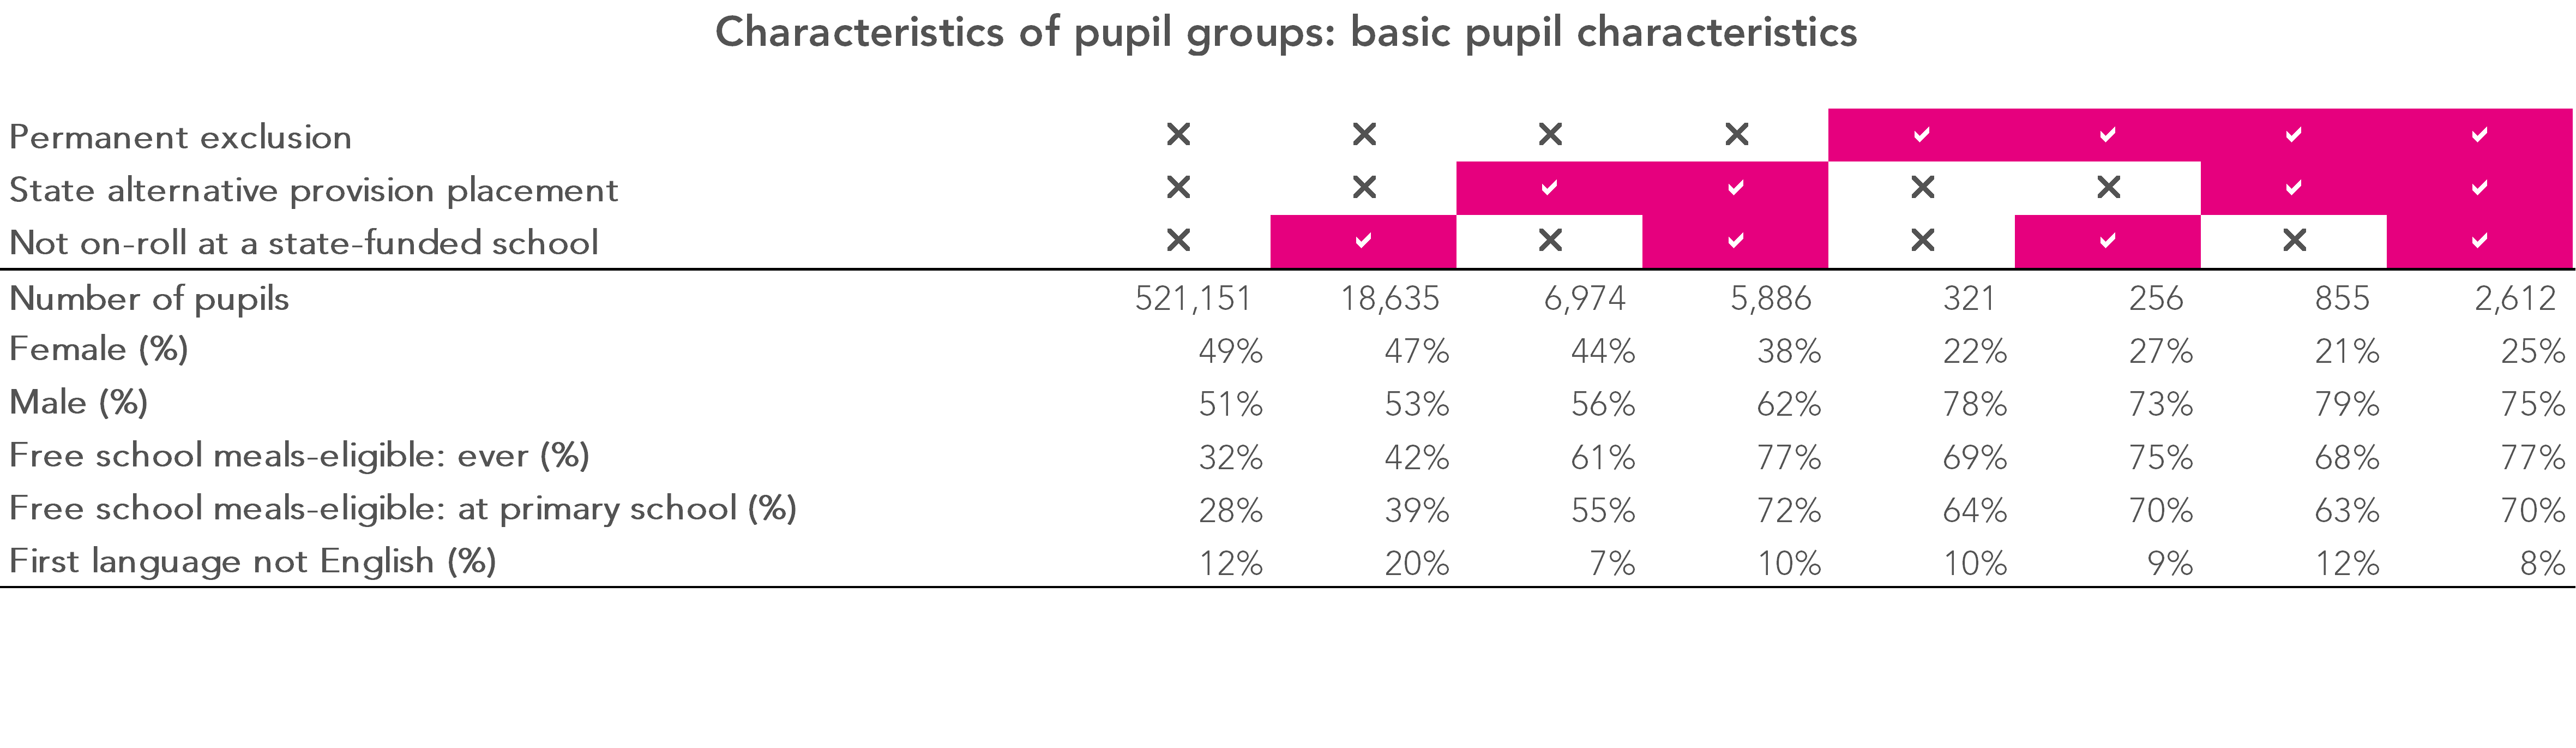
Relative to pupils who never experienced one of the three events, pupils who were permanently excluded, placed in state alternative provision or left the state-funded sector:
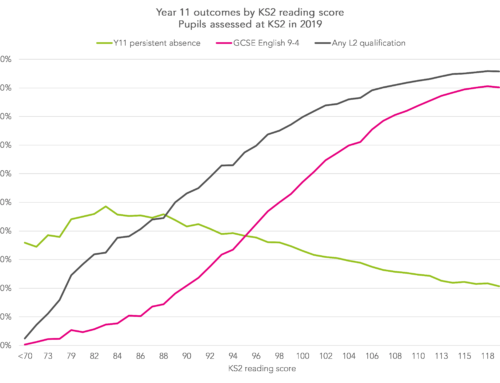
- tended to have lower attainment at Key Stage 2;
- tended to have higher absence rates in Year 6;
- were more likely to be male, particularly those who experience permanent exclusion;
- were more likely to have been eligible for free school meals;
- were more likely to have been classified as having special educational needs (SEN)
- were more likely to have had at least one fixed term exclusion while at primary school;
- were more likely to have made two or more non-standard school moves during the primary years.
Pupils who left the state-funded sector by January of Year 11 were less likely to be observed in education the following year, though in some cases – we would anticipate somewhere between a third and a half – they will have left England.
What drives this?
Are some groups more likely to experience these events?
Let’s take as an example pupils who at some point during their primary education were identified as having special educational needs met by School Action Plus or a SEN statement. They were more likely to experience one of these three events – permanent exclusion, a placement in state alternative provision, or leaving the roll of state-funded schools before January of Year 11 – than non-SEN pupils.
We also know that their Key Stage 2 attainment tends to be lower, and that low KS2 attainment is associated with experiencing these three events.
So are SEN pupils really more likely to experience one of these three events, or is it at least partially explained by attainment?
Throw in disadvantage – also strongly associated with low attainment and SEN – and it quickly becomes apparent that isolating particular factors is extremely tricky.
Perhaps the best we can do is examine the effects of a whole range of variables simultaneously. This can be done using odds ratios. Some people don’t like them but then some people don’t like Doritos. If you are unfamiliar, see the box below.
Odds ratios
The probability of a pupil with special educational needs met by School Action Plus or a SEN statement experiencing a permanent exclusion before the end of Year 11 was 0.018 (or 1.8%), and the probability of not being permanently excluded was 0.982 (or 98.2%).
The odds of being permanently excluded were therefore 0.018/0.982 = 0.018 to three decimal places.
Similarly, the probability of a non-SEN pupil experiencing a permanent exclusion was 0.003 (or 0.3%) and the probability of not experiencing a permanent exclusion was 0.997 (or 99.7%). The odds of being permanently excluded were therefore 0.003 to three decimal places.
The odds ratio between the two groups is 0.018/0.003 = 5.47.
Because the events we are looking at this in this blogpost are relatively rare, we can say that pupils with special educational needs met by School Action Plus or a statement were approximately 5.5 times more likely to be permanently excluded than a pupil without SEN.
However, the odds ratio only has this straightforward interpretation if the event being analysed is relatively rare.
In calculating odds ratios we can take into account a number of variables at the same time, to assess the importance of individual factors.
Specifically, here we’re going to take into account:
- KS2 prior attainment;
- absence and exclusions at primary school;
- number of non-standard school moves during the primary years;
- disadvantage (percentage of primary school career spent FSM-eligible and neighbourhood disadvantage);
- ethnicity and first language;
- SEN at primary school;
- school characteristics (mean KS2 prior attainment; percentage of FSM-eligible pupils; and percentage of pupils with English as an additional language).
Before taking all of these factors into account, the odds ratio of being permanently excluded between Year 7 and Year 11 for pupils with special educational needs (School Action Plus or a statement) at primary school relative to non-SEN pupils is 5.47. After taking them into account, the odds ratio falls to 1.87.
So – and this only works because the events being considered are relatively rare – we can say that having taken into account all of the factors above, pupils with special educational needs are still somewhere around twice as likely to be permanently excluded as non-SEN pupils.
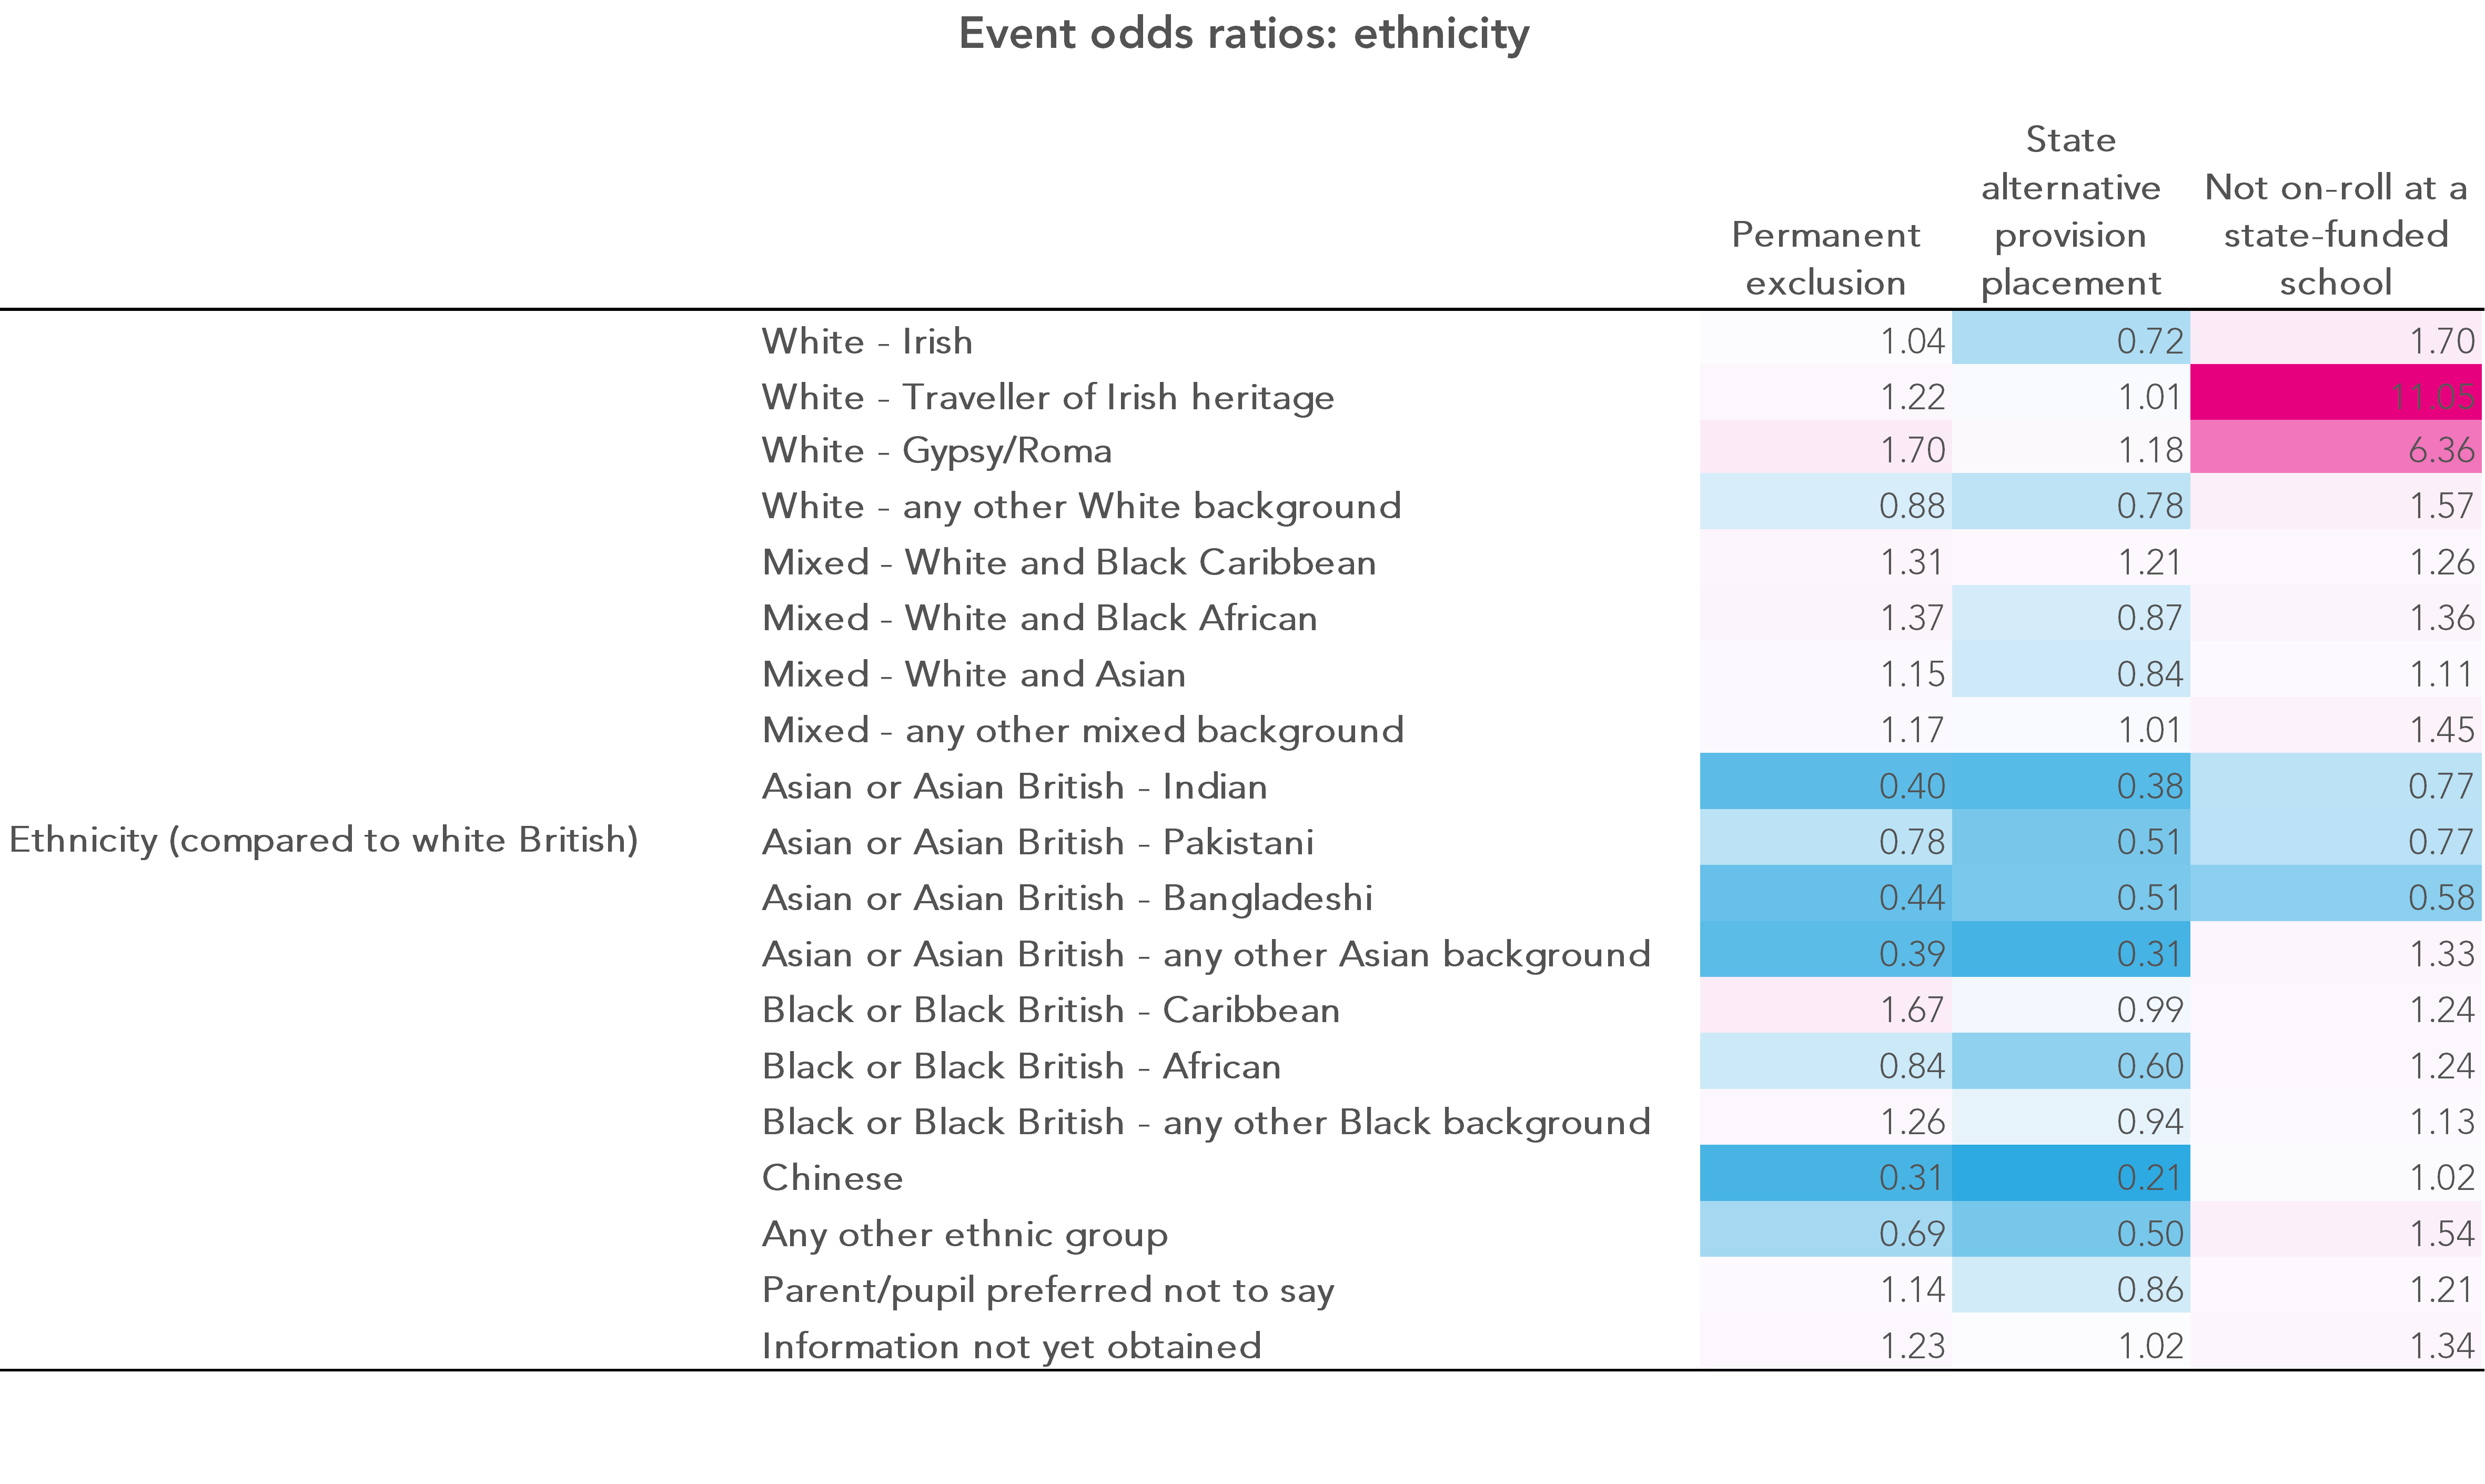
The table below shows various odds ratios associated with the three events of interest for different groups of pupils.
In each case, the rarity of the events being considered means that the odds ratios can be interpreted as meaning that the risk of an event occurring for the group under consideration is roughly the number in the table – 2.5, say – times more likely that of the relevant comparator group.
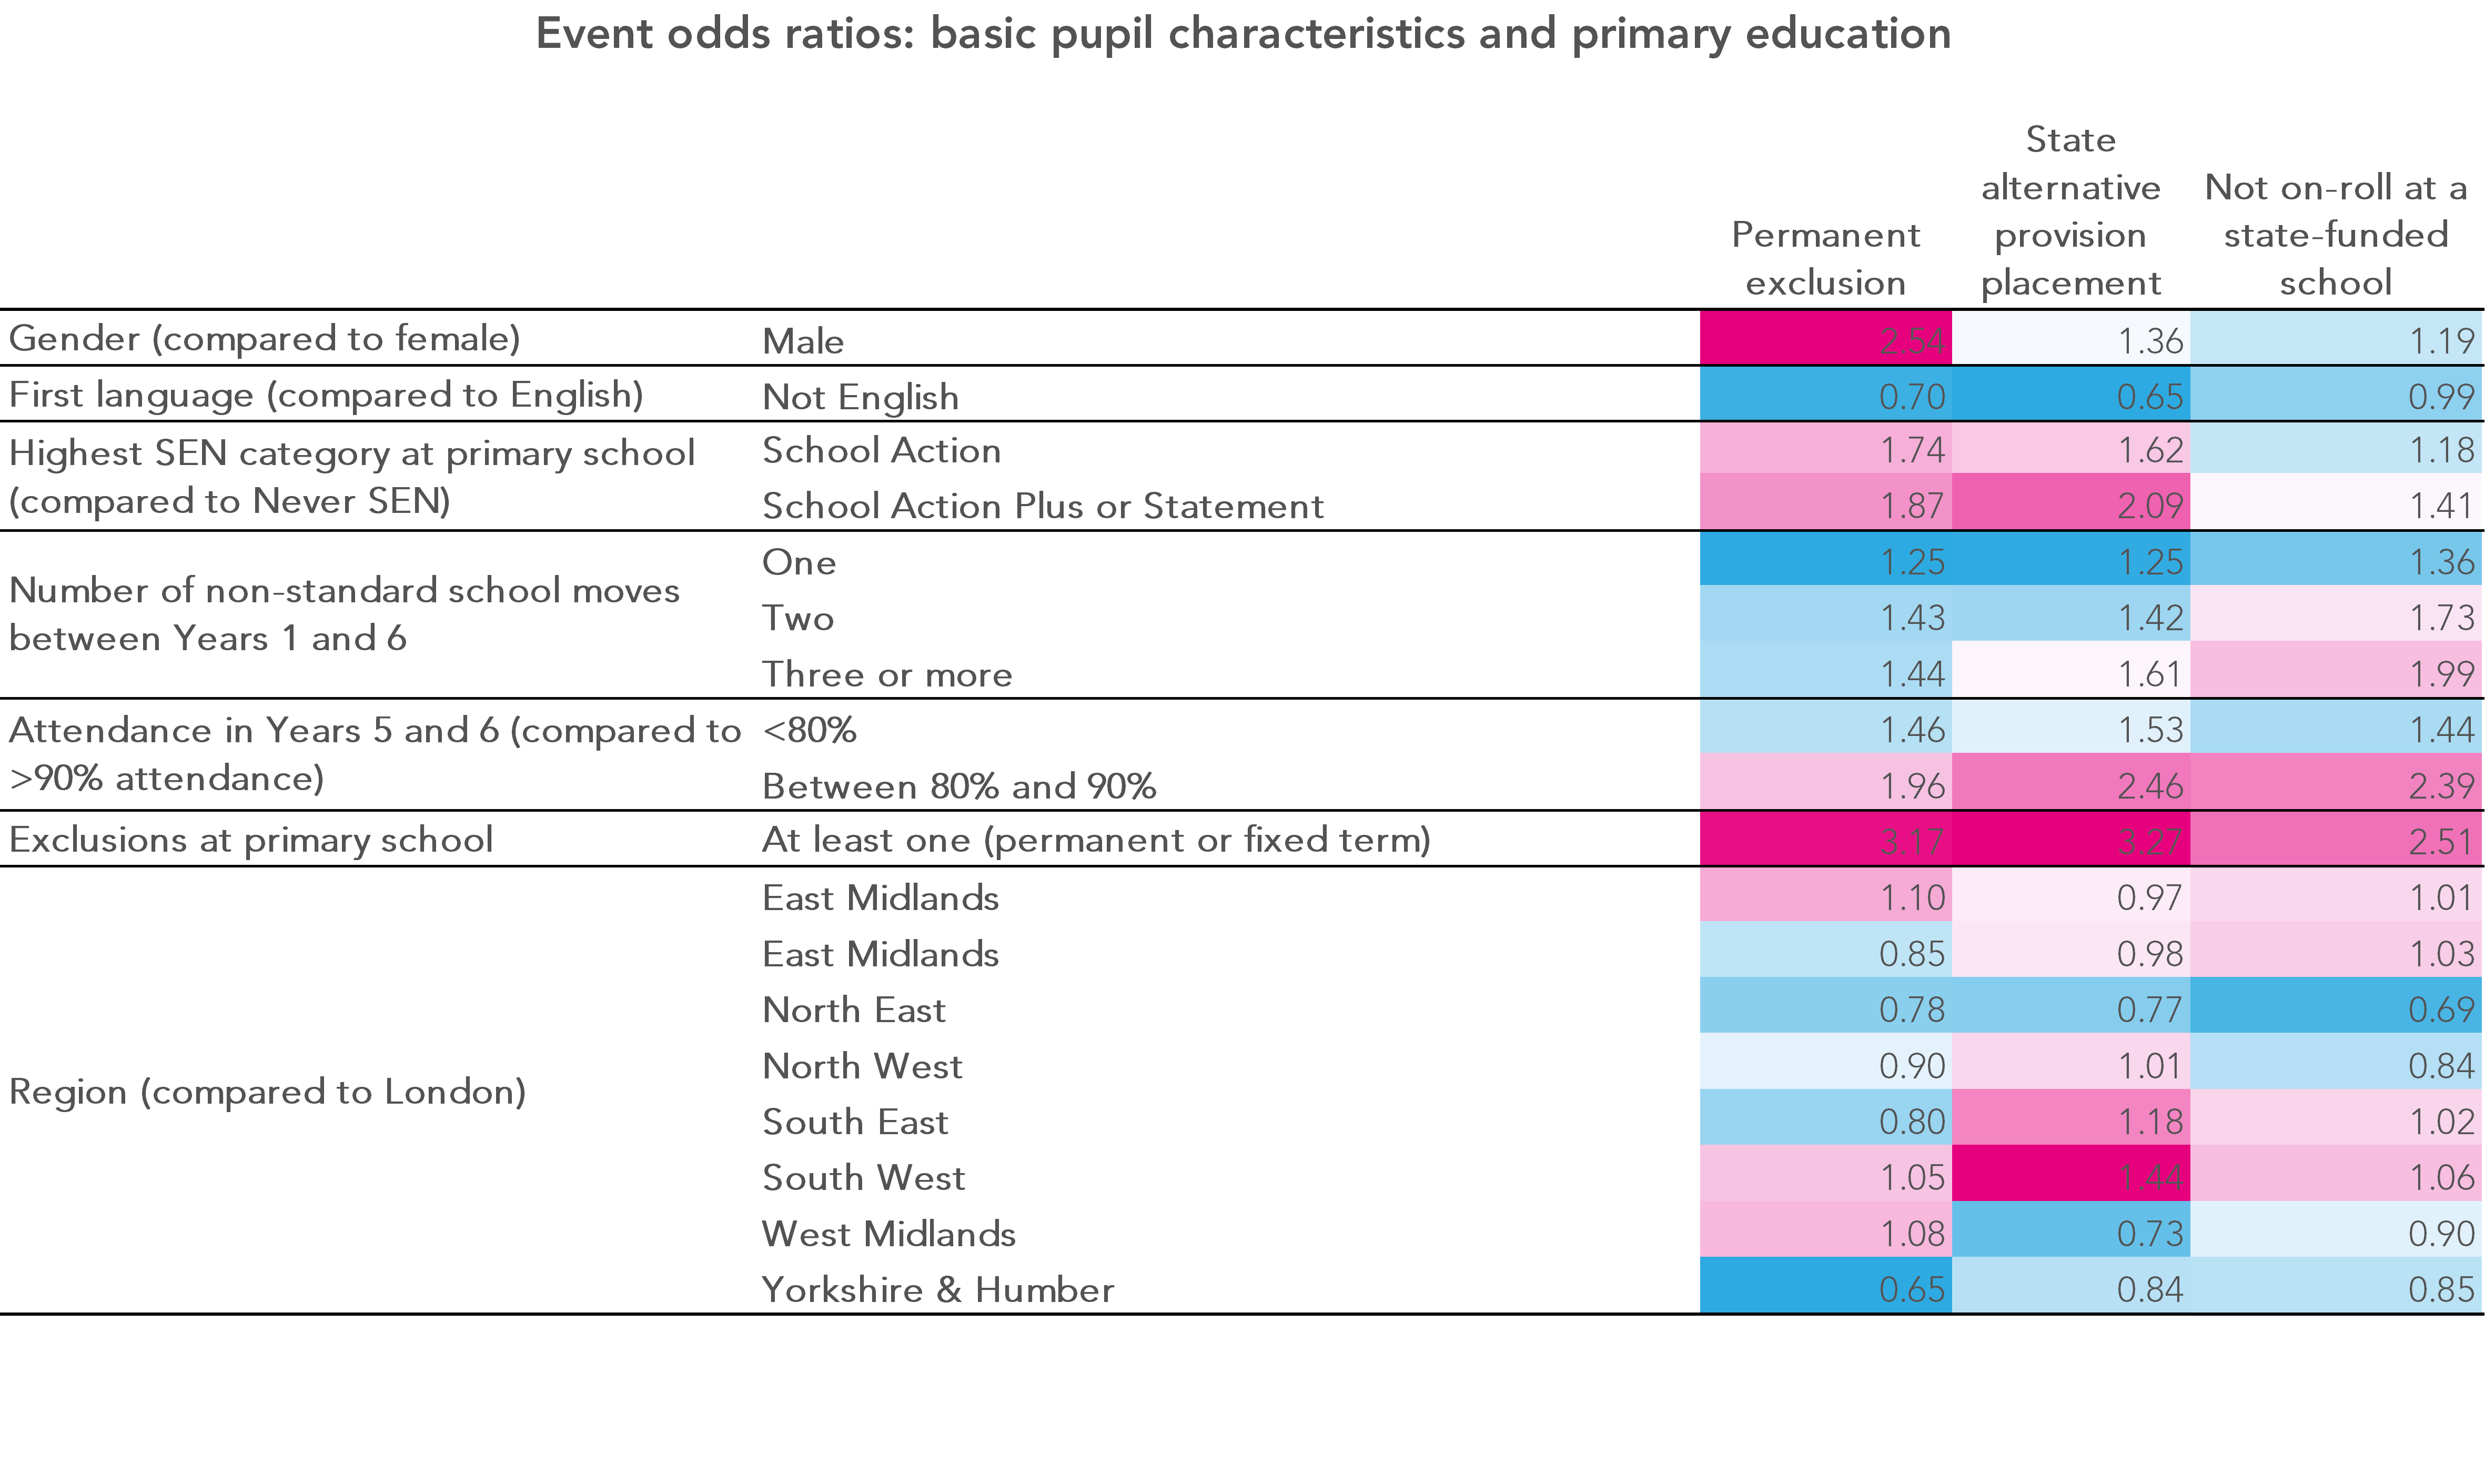
Summarising the table above:
- The odds of a boy being permanently excluded are 2.5 higher than the odds for girls, but the odds for boys and girls of being placed in state alternative provision or of leaving the state-funded sector are more similar.
- The odds of a black Caribbean pupil being permanently excluded are nearly 1.7 higher than the odds for white British pupils, but the odds of being placed in state alternative provision or of leaving the state-funded sector are more similar.
- The odds of a Traveller with Irish heritage or a pupil with a Gypsy/Roma background leaving the state-funded sector are 11 and six times higher respectively than those of a white British pupil.
- The odds of all three events are higher for pupils who experienced an exclusion at primary school, had low attendance in Years 5 and 6, made non-standard school moves during the primary years and were identified as having special educational needs at primary school.
It is worth stating that all of these factors are only weakly predictive of the three events we have looked at in this post.
Permanent exclusion, placement at state alternative provision and leaving the state-funded sector are relatively uncommon events.
The odds of them occurring for SEN pupils are far higher than those for non-SEN pupils, for example – but just 12% of pupils with special educational needs met by School Action Plus or a SEN statement while at primary school experienced one of the three events during their secondary years.
So you cannot predict with any certainty which pupils are likely to experience one on the basis of their characteristics and prior attainment.
Want to stay up-to-date with the latest research from FFT Education Datalab? Follow us on Twitter to get all of our research as it comes out.
The support of the Economic and Social Research Council is gratefully acknowledged.
![]()


Hello
Thanks for this interesting blog
We are currently doing research on parents being prosecuted or threatened with prosecution because their child did not attend school regularly. See:
https://www.napomagazine.org.uk/2018/08/21/punishing-for-truancy/
Happy to share our draft research report with you, if you would be interested to see it. We would value your comments on it.
I wonder if you have this statistic : how many parents were prosecuted for truancy in 2017 in Scotland? It’s been suggested that Scotland is less punitive in its approach than England – the figures, if I can get them, could support this idea (or not).
Thanks very much for your help
Best regards
Rona
Great blog. I think a big factor that is ommited from this analysis is whether the child have been referred or receives services from children’s social care. This data is in the NPD and starts to partial out the correlations between negative home circumstances or wider environment and other factors like being from a low income background (FSM).
Really enjoyed this post, but would be interested to see the correlation for Looked After Children
Yes this is really important research. I am working with a group in Sheffield, which includes MAT Trust Chairs, to obtain a clearer picture of the City data, and in particular to find out what is happening to the young people whose parents follow the education at home route, and those that are off-rolled in year 10 and who leave full-time education. Most important of all to work out how to reverse what is a rapidly growing trend. Be interested to know whether you have found this is a particular problem for certain types of schools.
Hi Jonathan. It doesn’t directly answer your question, but in another piece of work where we reweighted league table figures to factor in all pupils who have spent time at a school, not just those who remain there at the end of Year 11, we found that the impact was greatest for sponsored academies. Pupil moves of all types were included in that analysis. Full detail of the work can be found here.