Now that data from the National Pupil Database has been linked to earnings, employment and benefits records we can begin to examine some really big questions about the long-term effects of education policy, structures and qualification choices.
In this post, I’m going to look at whether school quality makes a difference to pupils’ long-term outcomes.
School quality
Of course, we can’t really measure school quality, but we do have imperfect proxies.
Firstly, we can measure pupil attainment, taking account of variations between schools in the prior attainment and demographic characteristics of their pupils using contextual value added (CVA) measures.
Secondly, we have a history of inspection teams going into schools and making judgments about quality (overall effectiveness).
Neither method is perfect.
CVA only takes account of things we have data about. Even after accounting for prior attainment and demographics, schools might vary in other unobservable ways that have a bearing on attainment. Family support and private tutoring are two such examples.
Inspectors meanwhile have considerable degrees of freedom when conducting an inspection. There is very little evidence on the reliability of inspections i.e. that different inspection teams would arrive at the same judgment.
Whether school quality makes sense as a concept is another matter. Every school has more effective and less effective departments which change over time as teachers and pupils come and go. We’ll leave this particular issue to one side.
The data
For this post, we’re going to go back to the 2003 Key Stage 4 cohort. These were the days when the academies programme was in its infancy, and when only GCSEs and GNVQs counted in school performance measures. Inspections were conducted by large teams over a long period and with plenty of notice.
Our measure of CVA is based on pupils’ mean grades in GCSE only. This is an indicator that is relatively stable over time and is unaffected by the over-valuing of GNVQs, which were commonplace then. We’ll control for prior attainment at Key Stage 2, pupil demographics and school characteristics.[1]
CVA tends to show that differences in attainment between the vast majority of schools are small once systematic differences in pupil intake are removed. For that reason, schools are allocated to one of three groups: those in the top quartile, those in the bottom quartile and the middle 50%. We’ll also use a three-year average to reduce the effect of some of the statistical noise present in single year’s data.
Our analysis will also make use of data on 466 section 10 inspections conducted in 2002/03. (Section 10 inspections were the predecessor to what are now full, section 5 inspections.)
Comparing outcomes
The chart below shows the impact of attending a school in the top or bottom quartile for CVA compared to attending a school in the middle 50%, across a number of outcomes.[2]
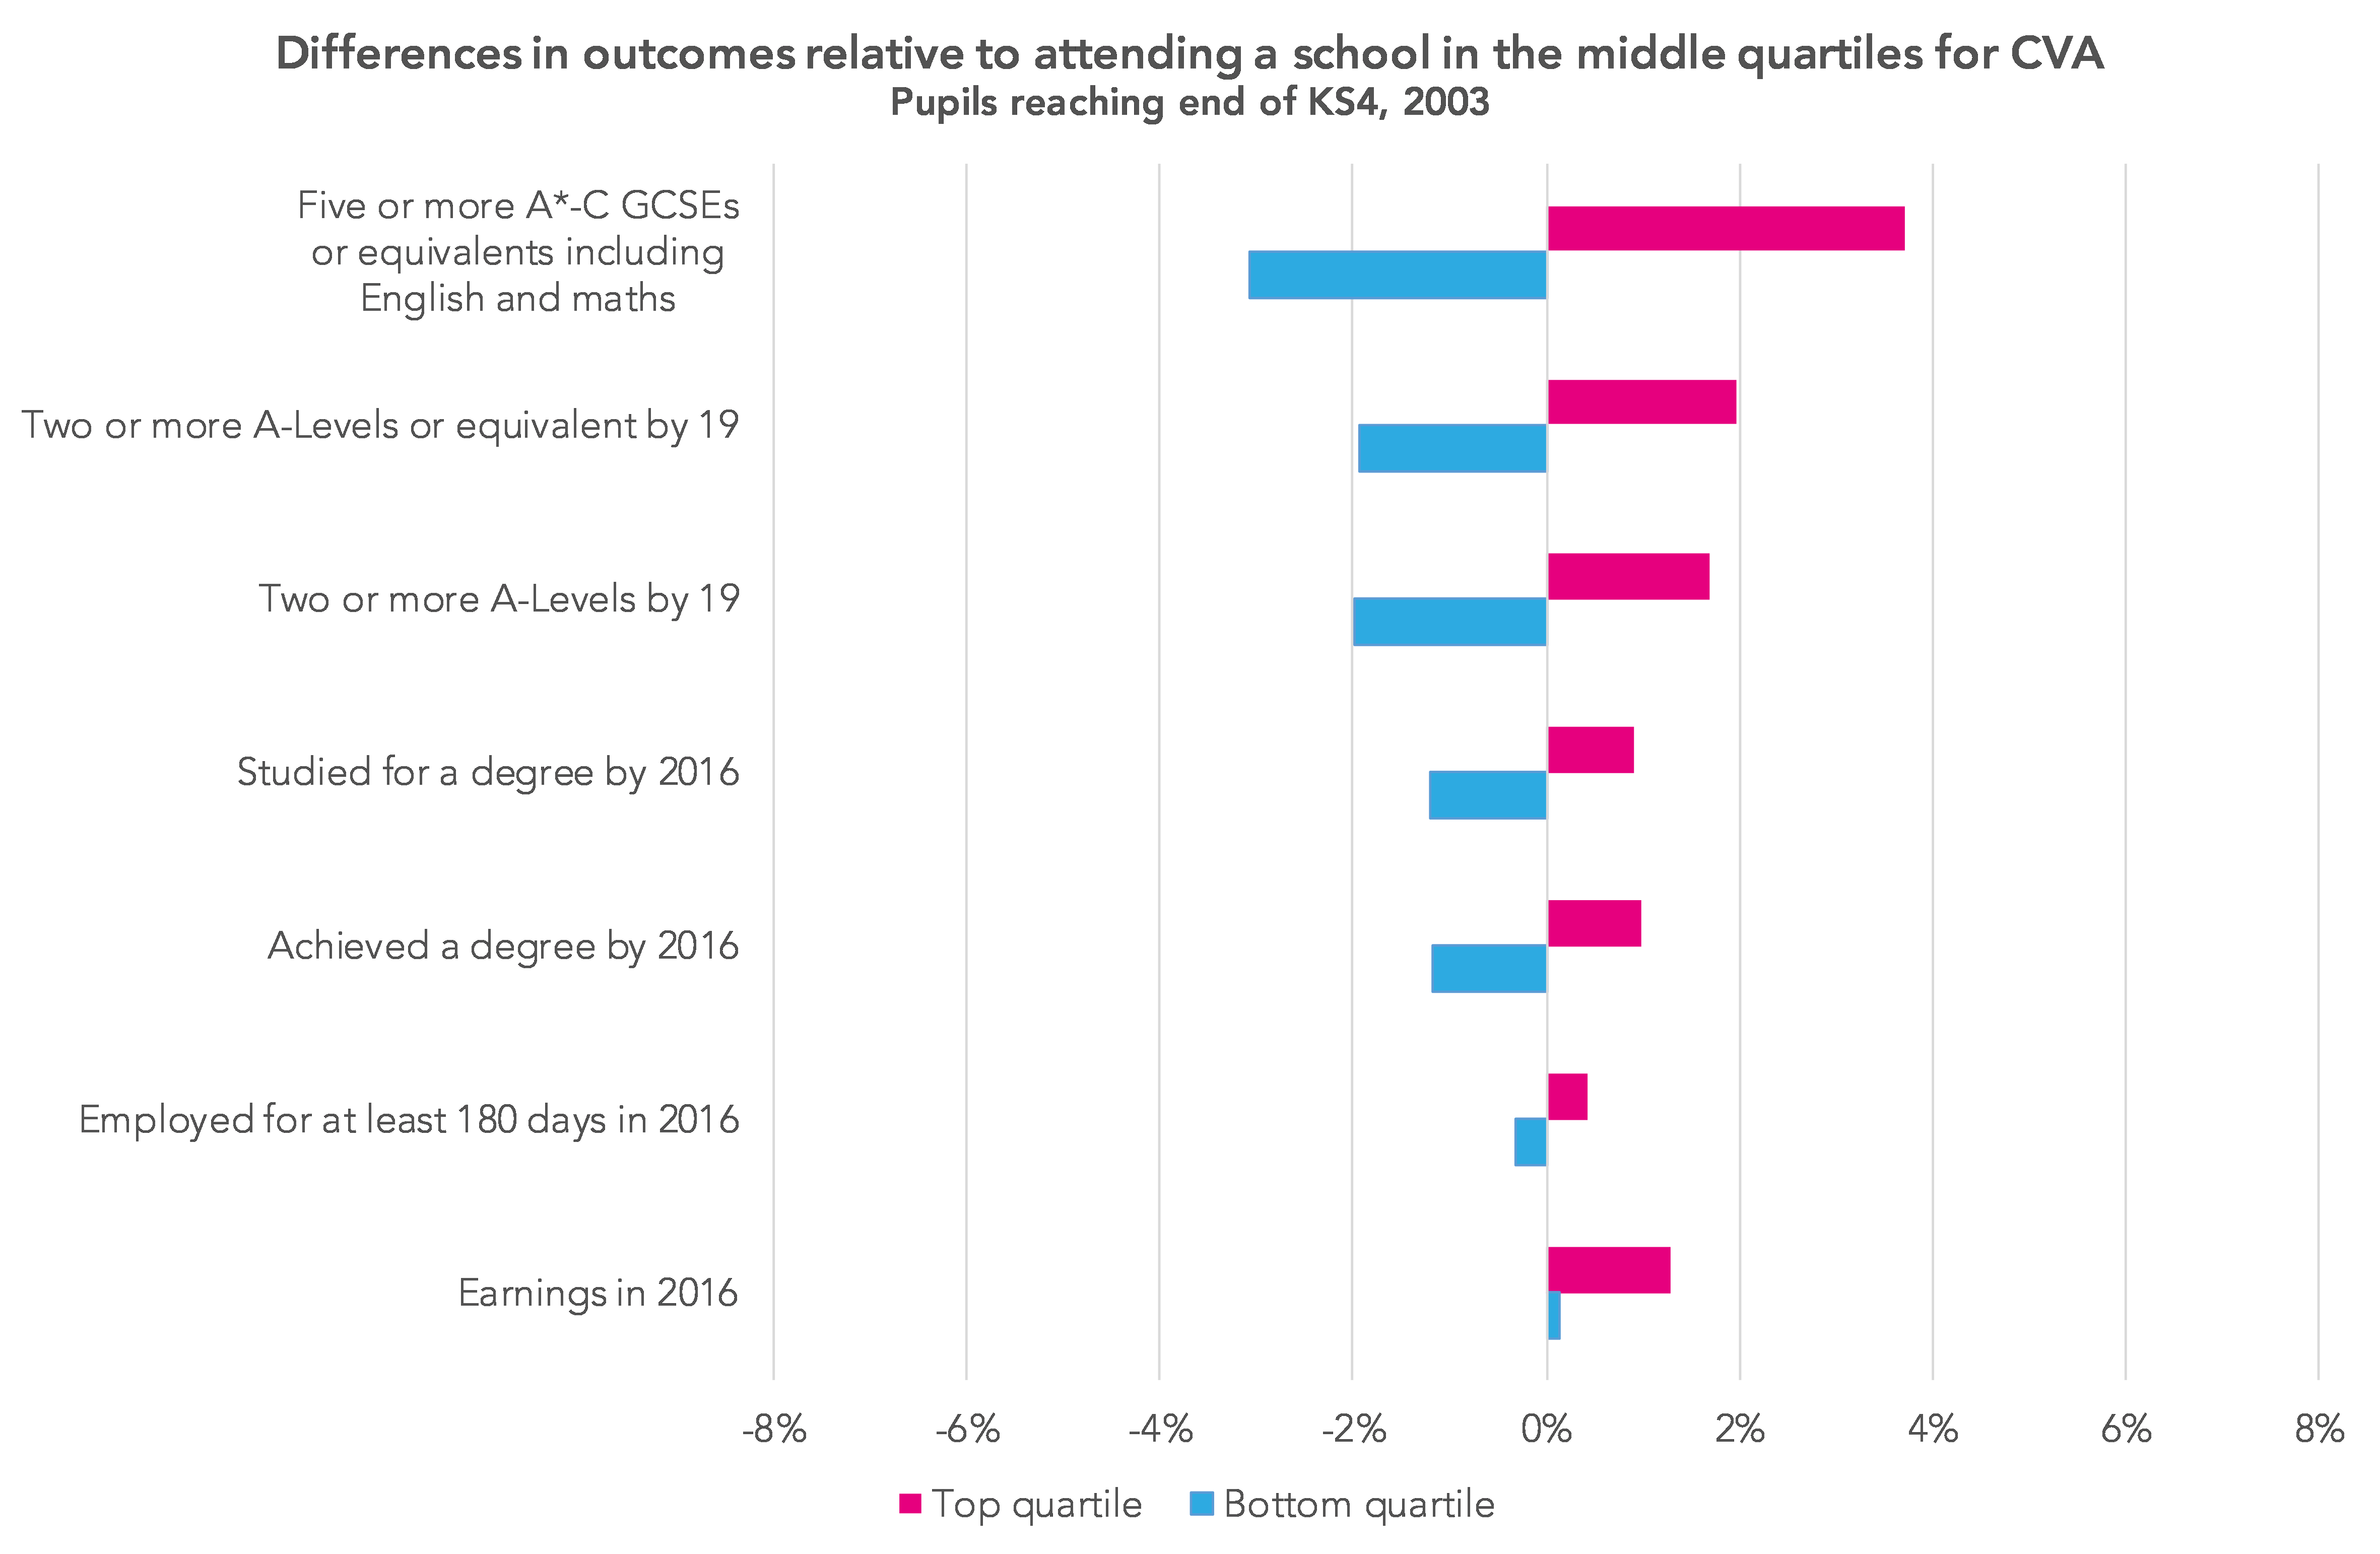
We can see that the impact of attending a school in the top quartile tends to diminish over time. A higher percentage go on to achieve two A-Levels or equivalent by age 19 and then go on to achieve a degree. However, only a fractionally higher percentage were in employment for 180 days in 2015/16, and their earnings were only 1% higher (£277).
We can then repeat the process, this time replacing CVA with inspection judgments and comparing outcomes relative to schools rated good. Back in 2003, seven grades were used. We have combined the top two grades (excellent and very good) and the bottom three grades (unsatisfactory, poor and very poor). The 466 inspection judgements that we have covers only 83,000 pupils, or approximately 15% of the whole dataset.
Nonetheless, the effects of school quality as measured by inspection ratings appears more pronounced and more persistent than when measured by CVA, as the chart below shows.
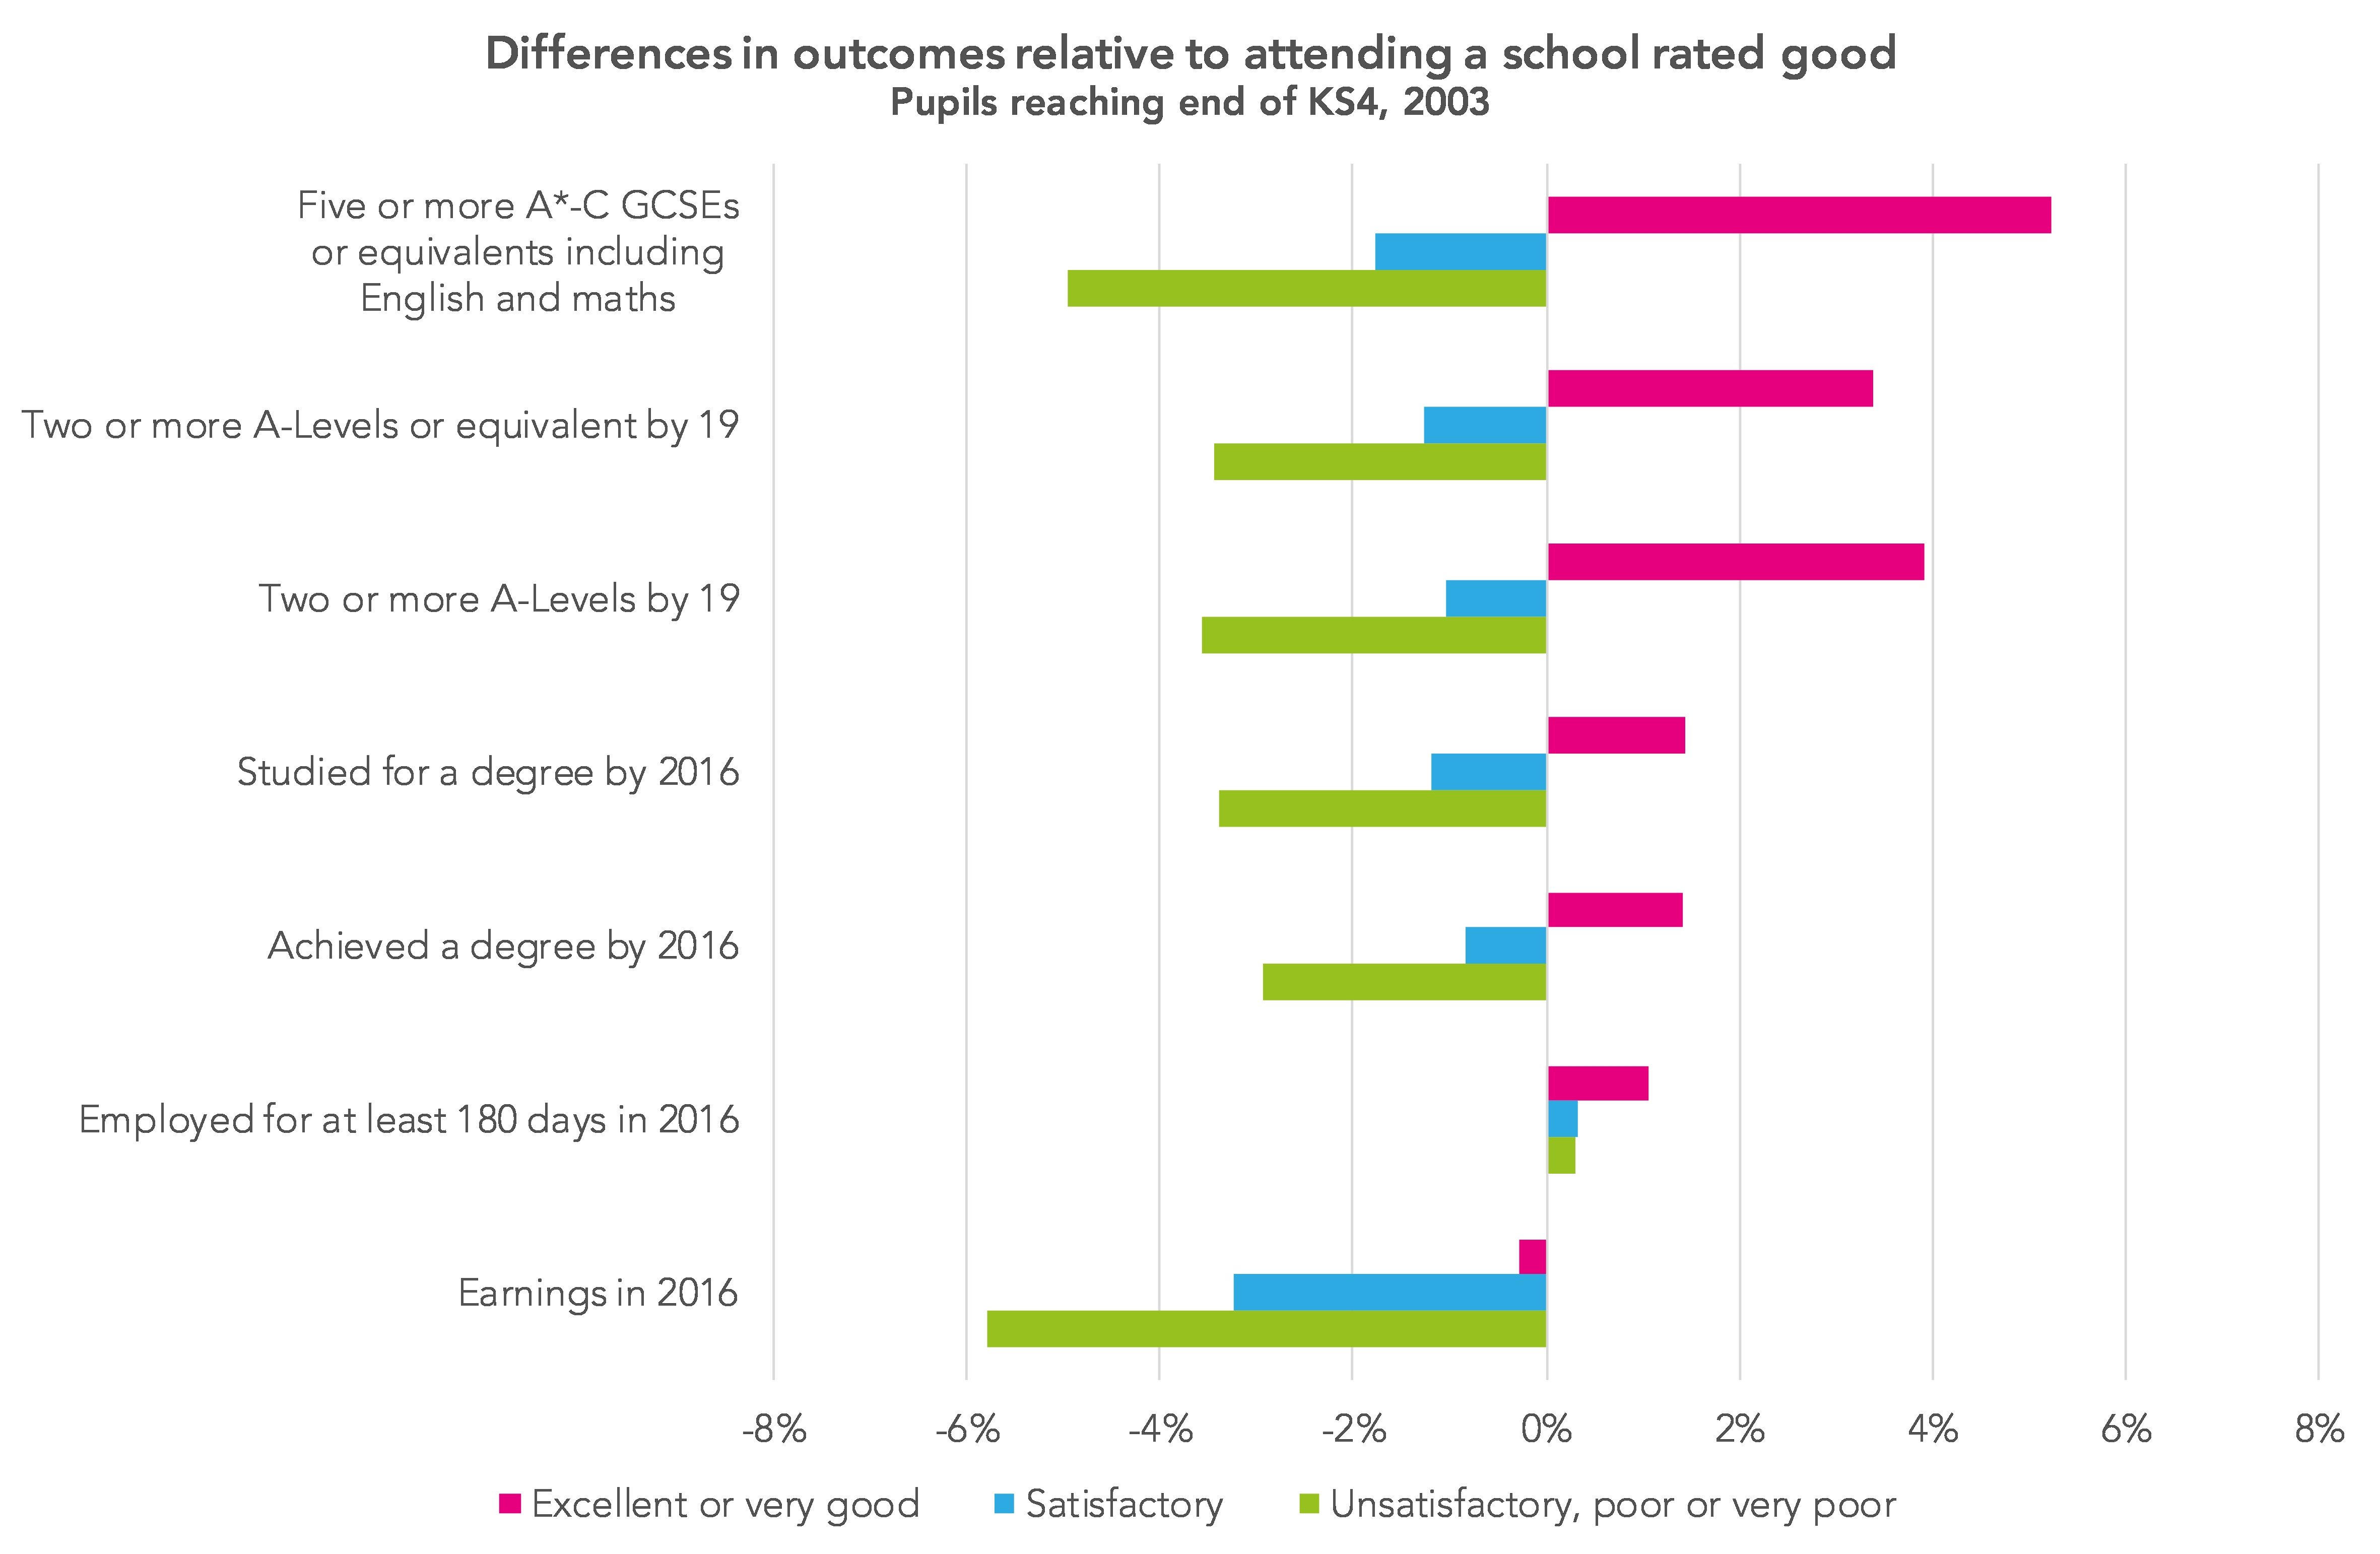
Earnings in 2015/16 among pupils who attended a school rated unsatisfactory, poor or very poor were over 5% lower (£1,227) than similar pupils from similar schools rated good.
However, only 4,000 pupils attended schools that were inspected in 2002/03 and rated unsatisfactory, poor or very poor.
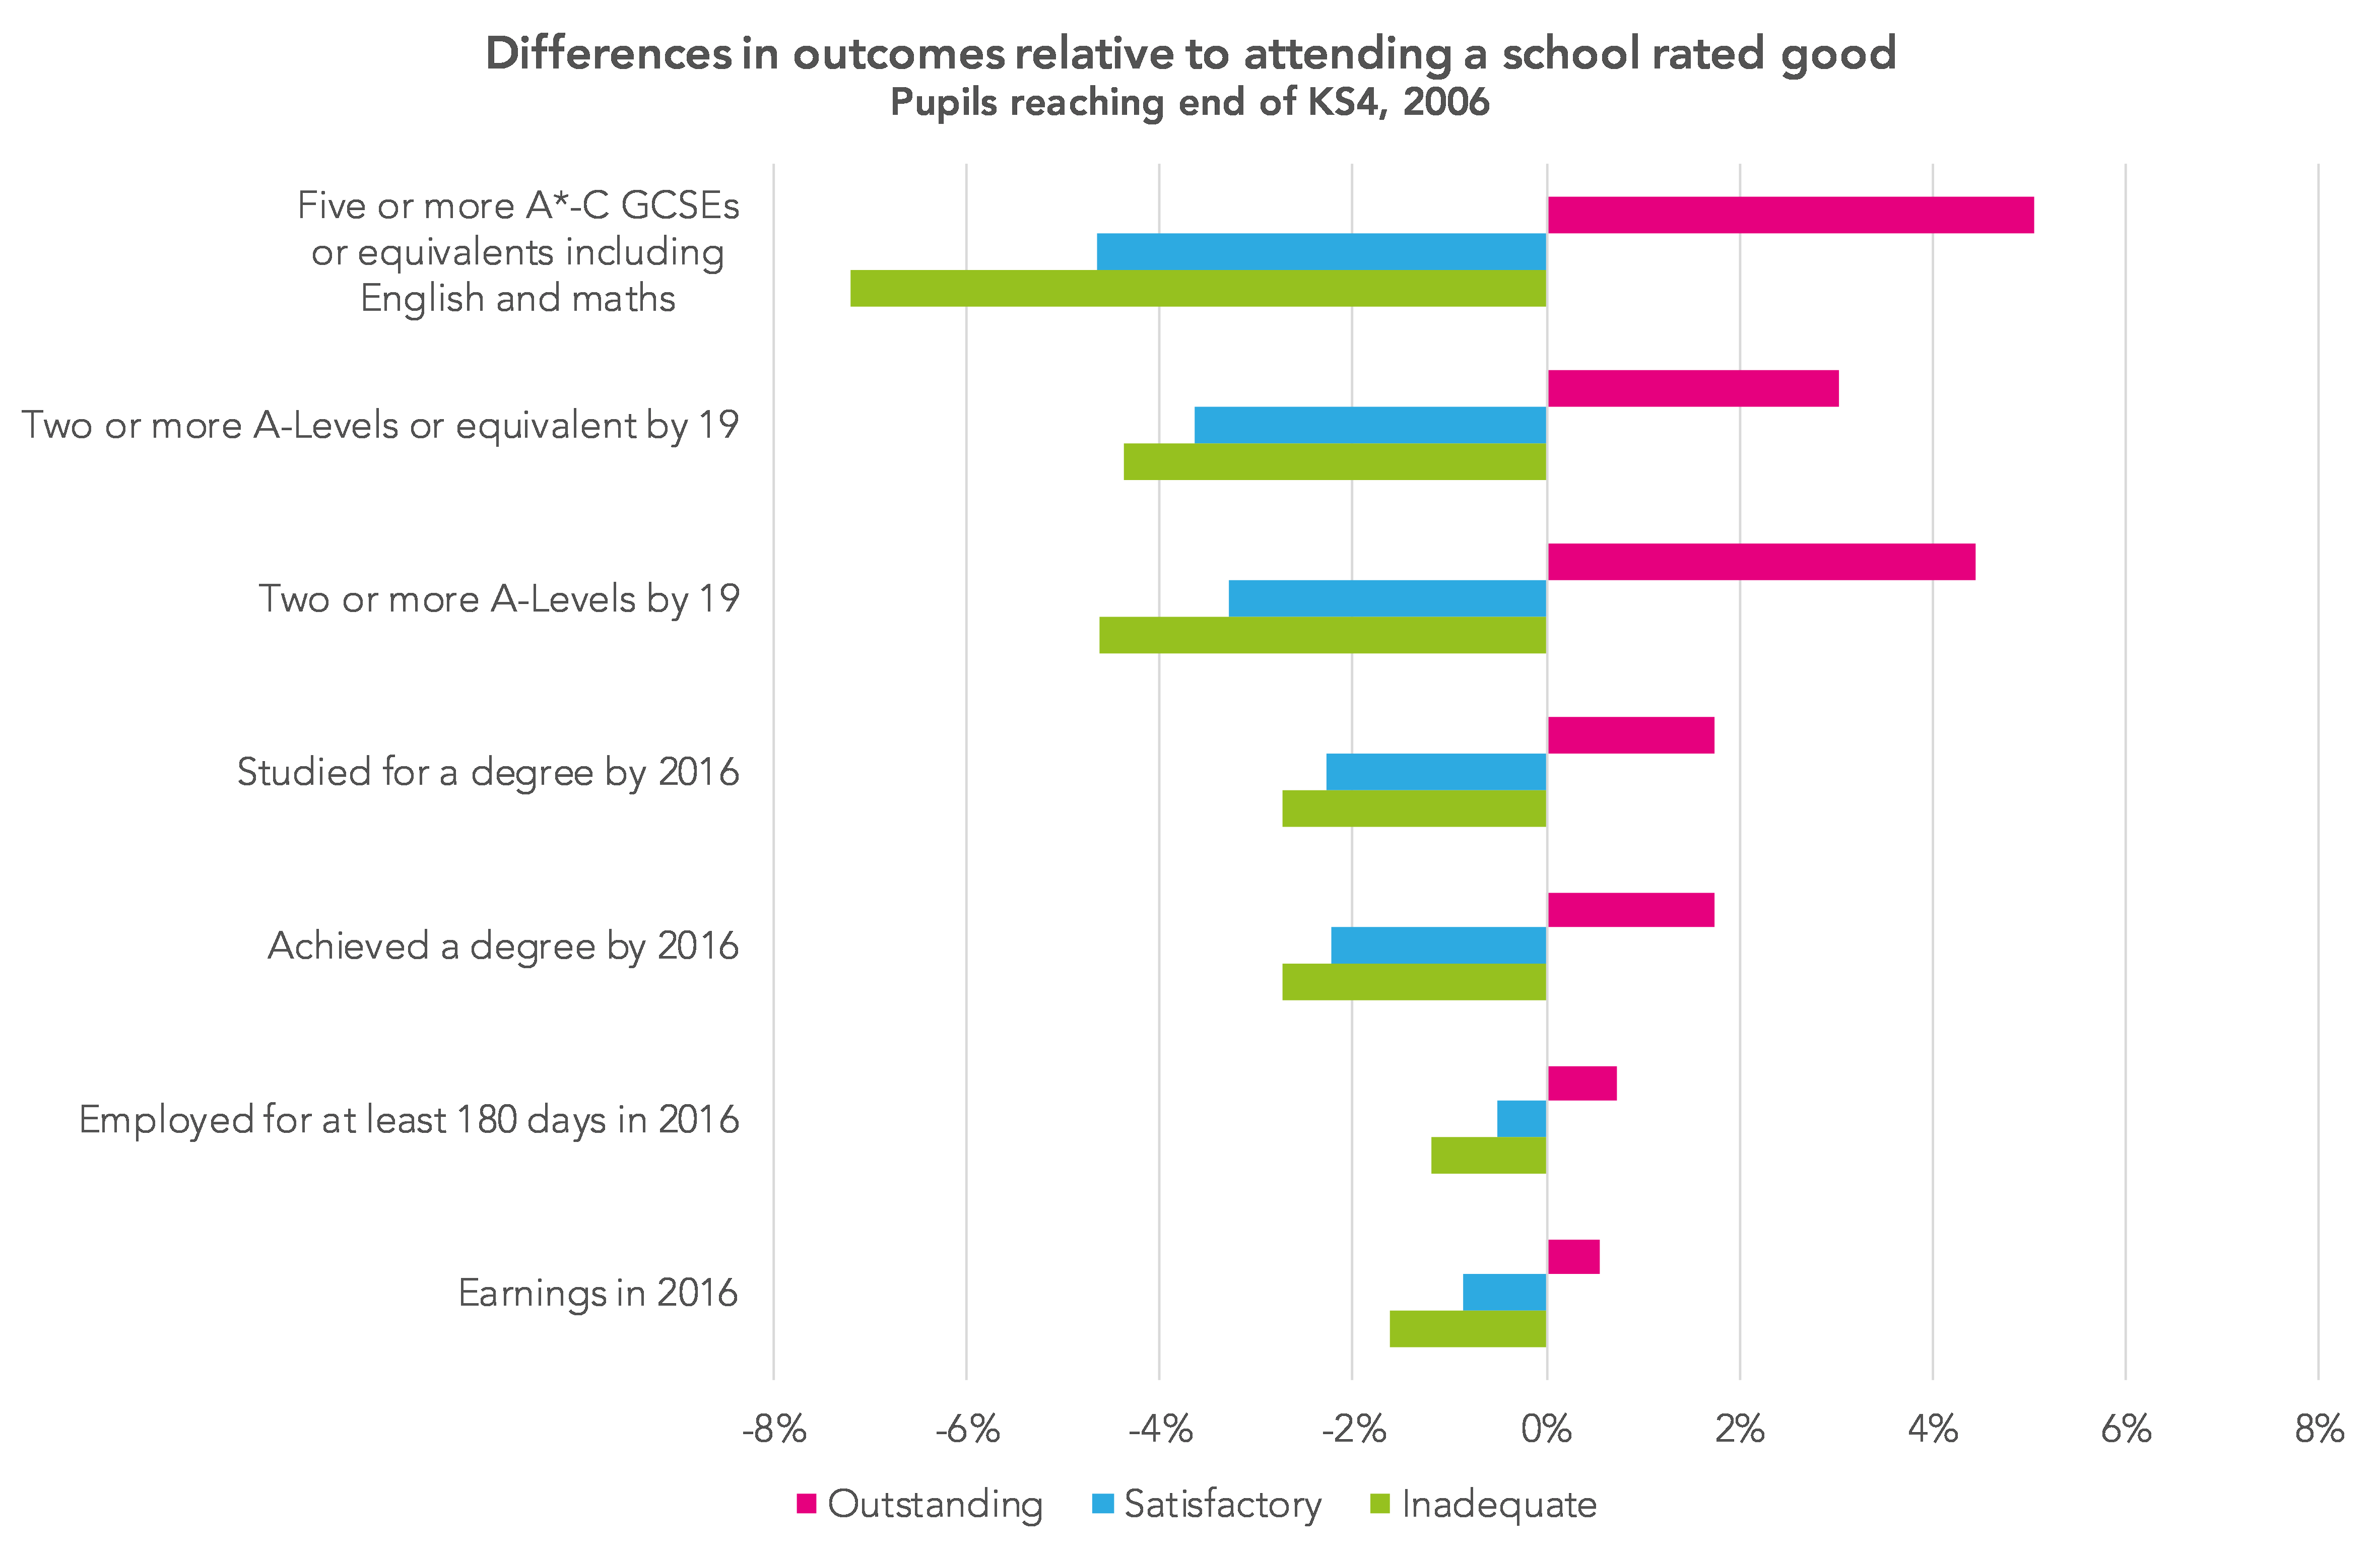
To bolster the analysis, we can run the same analysis on later data – this time from 2005/06. This was the first year that schools were inspected under Section 5. These were shorter, sharper inspections with (usually) just two days’ notice. Schools were rated on the familiar four-point scale (outstanding, good, satisfactory, inadequate) which more or less prevails today (save for satisfactory being rebadged as “requires improvement”).
Over 900 schools in the dataset were inspected that year, covering 30% of the pupils.
As the chart below shows, the earnings differentials for this younger cohort are not so apparent. As with CVA for the 2003 cohort, we see a gradual fading out of the effect of school quality over time.
I should say that the charts used here show the simple percentage point difference between actual and outcomes and those predicted on the basis of going to a school rated good (or with an average CVA rating). I’ve done this to try and make them easier to understand but they may be slightly misleading as each of the outcomes has a different average.
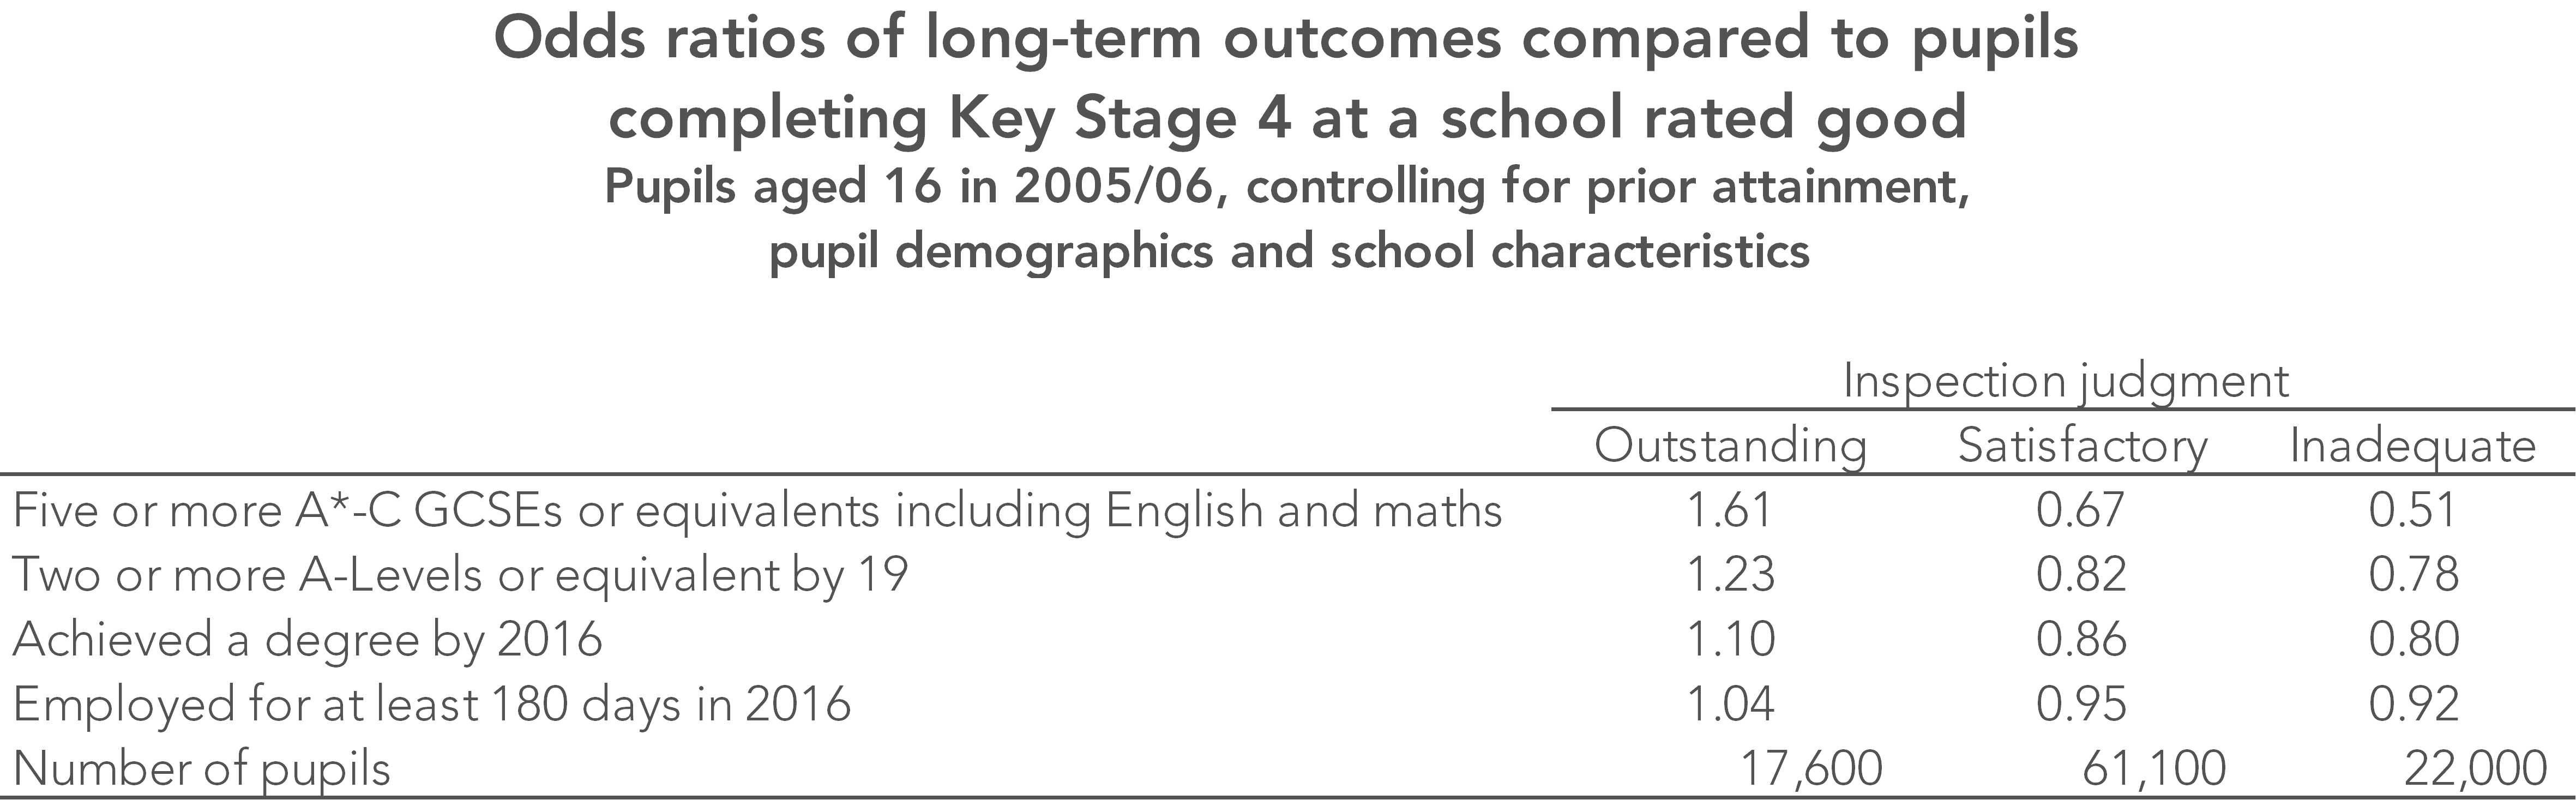
To check that the odds of later events occurring are indeed lower, I’ve also calculated odds ratios for the 2006 cohort. These can be seen here.
In summary
So what we see is that proxy measures of school quality are mildly associated with long-term outcomes, but which seem to fade over time.
None of this is necessarily causal, of course. It may be that those who selected into higher quality schools would have gone on to achieve better outcomes anyway.
In any event, these effects are relatively small. Even among pupils who went to schools with the highest quality ratings, individuals’ outcomes will vary by much greater margins.
Want to stay up-to-date with the latest research from FFT Education Datalab? Follow us on Twitter to get all of our research as it comes out.
The support of the Economic and Social Research Council is gratefully acknowledged.
![]()
1. Pupil characteristics controlled for are: term of birth, gender, ethnicity, first language, special educational needs, free school meals and mobility.
School characteristics controlled for are: percentage eligible for free school meals, mean KS2 prior attainment and standard deviation in KS2 prior attainment.
2. A regression model is run on each outcome looked at, controlling for Key Stage 2 attainment, pupil demographics (Key Stage 2 attainment, special educational needs, region, free school meals, term of birth, gender, first language, ethnicity, IDACI score of pupil residence) and school characteristics (percentage eligible for free school meals, mean KS2 prior attainment).
More on the sources of this data and some of its limitations can be found in this blogpost.


Leave A Comment