This is the second post in a series looking at within-school variation. Other blogposts in the series can be found here.
The first post in this series looked at within-school variation in Progress 8 scores and found considerable differences – in some schools the majority of pupils made broadly similar progress, while in other schools there were wide variations.
We estimated that reducing within-school variation in value added between subjects would have 10 times more impact on overall attainment when compared to moving schools below the floor standard to just above it.
Why might variations such as these occur? Reasons might include:
- variation in entry – the number of subjects taken by each pupil that count in the Progress 8 calculation;
- variations in ‘difficulty’ between subjects nationally;
- variation in performance between different subjects within the school;
- differences associated with pupil characteristics such as gender, ethnicity, English as an additional language status and socio-economic disadvantage;
- differences in pupil motivation and level of support at home.
This blogpost looks at the first three of these.
Variation in entry
The charts below show, for the same schools featured in part one of this series, the percentage of pupils in 2015/16 with all their Attainment 8 slots filled – putting pupils into the same bands used in the first blogpost based on their P8 score. Nationally, each band contains 20% of all pupils.
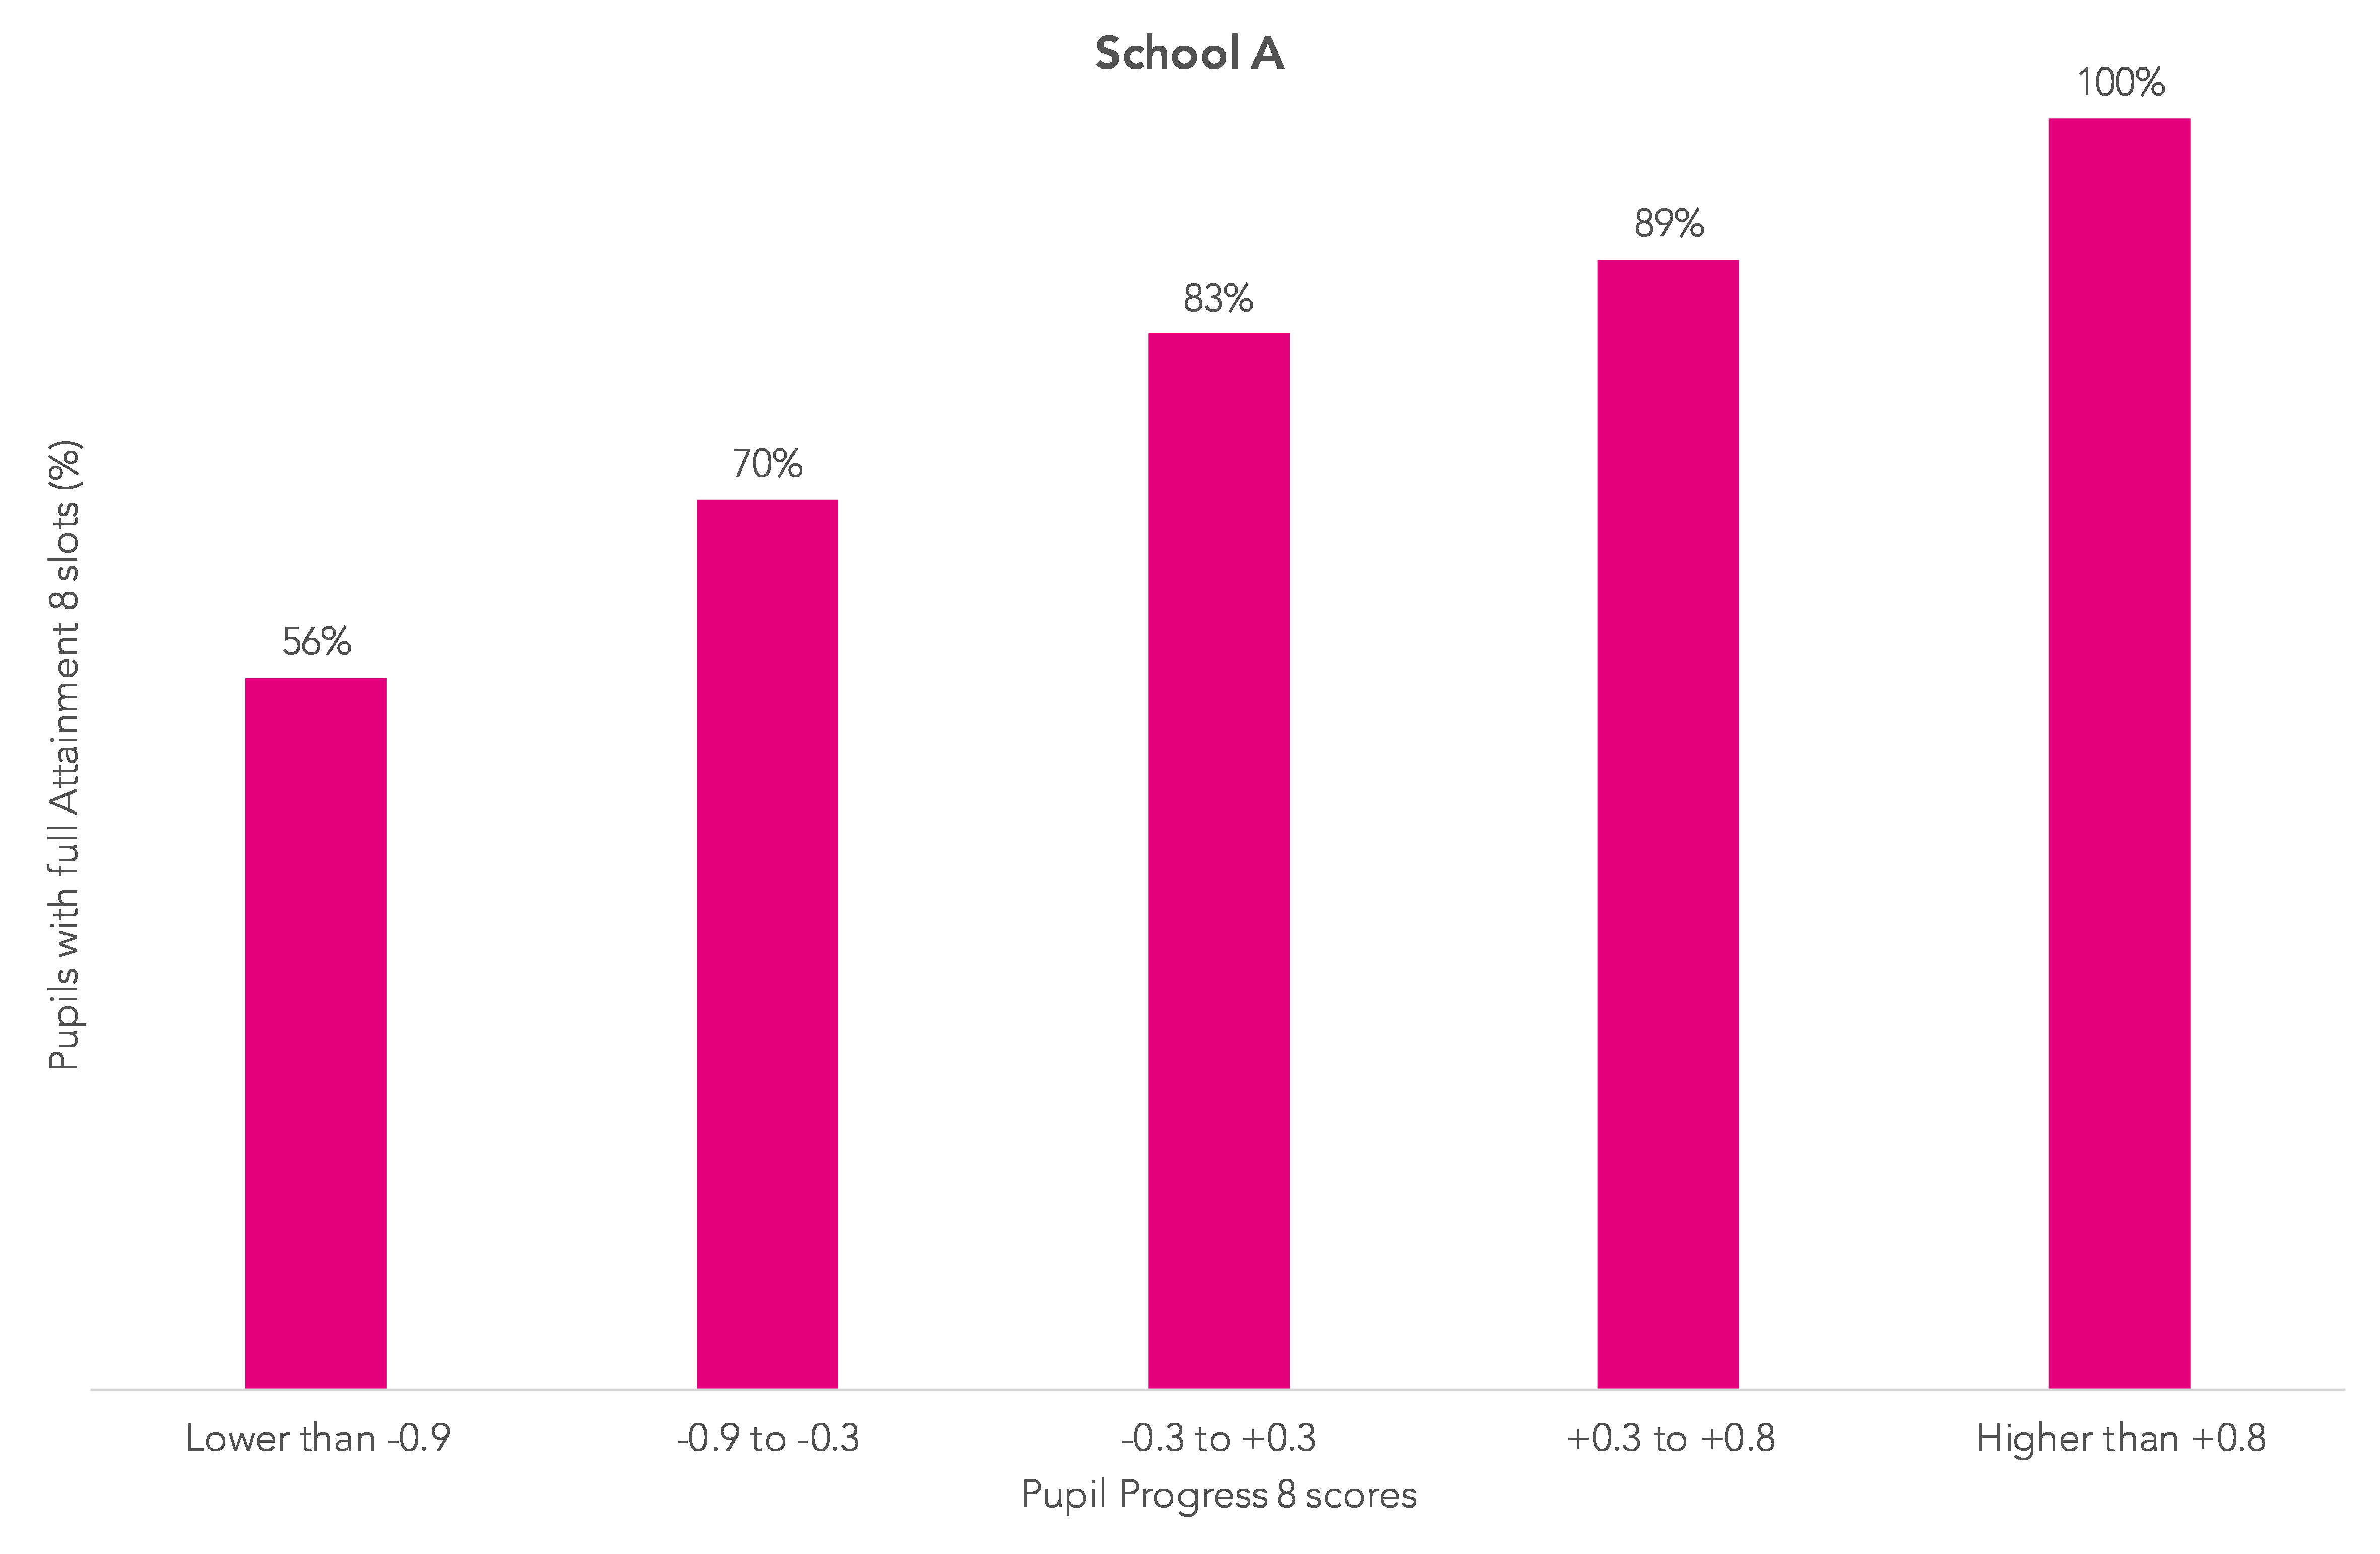
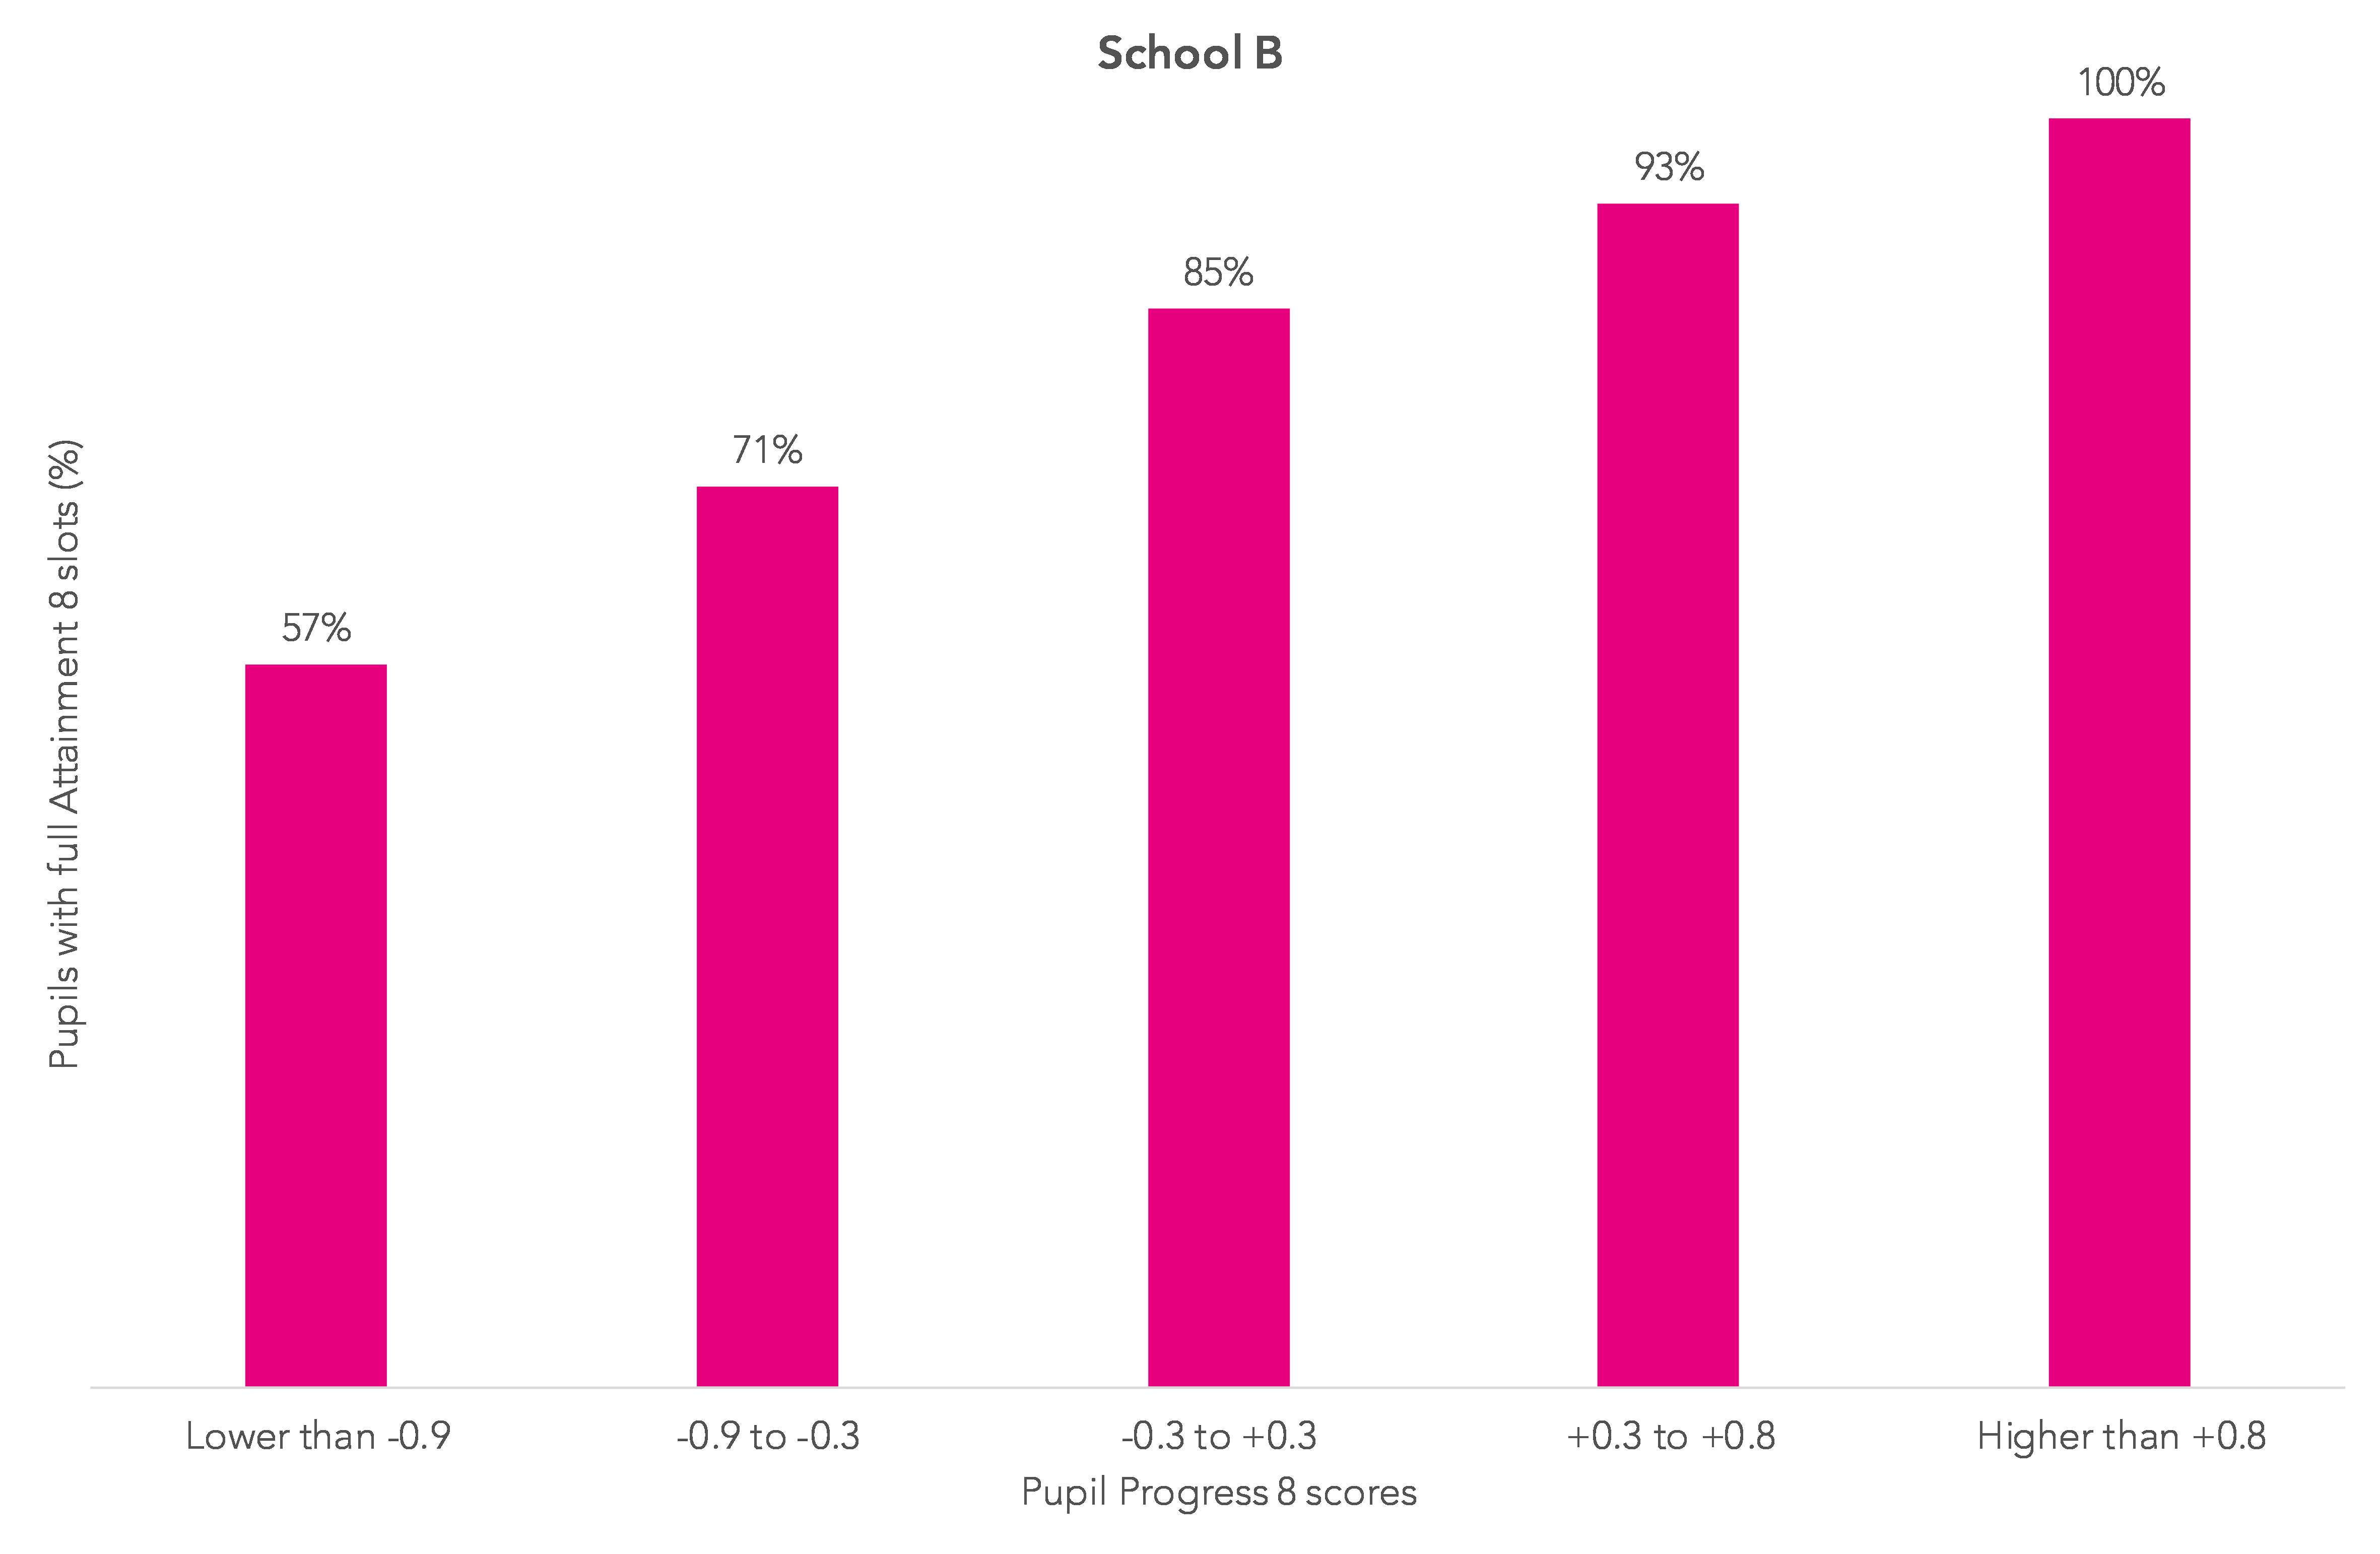
Somewhat unsurprisingly, pupils with low P8 scores have, on average, fewer Attainment 8 slots filled.
What is interesting though is that the pattern in the two schools is very similar.
Looking at all schools, when we allow for variations associated with the number of entries the variation in P8 scores within each school decreases but the variation between schools is still substantial.
Variation in difficulty
Next, a look at variation in difficulty.
It is well known that there are differences in the national grading of subjects. The chart below shows, for a selection of GCSE subjects, how average attainment varies by Key Stage 2 attainment. (Data used is an aggregate of 2014-2016 outcomes, when GCSEs were all graded A*-U – translated into point scores from 8 to 0 . The chart excludes data points where there are fewer than 1,000 pupils.[1])
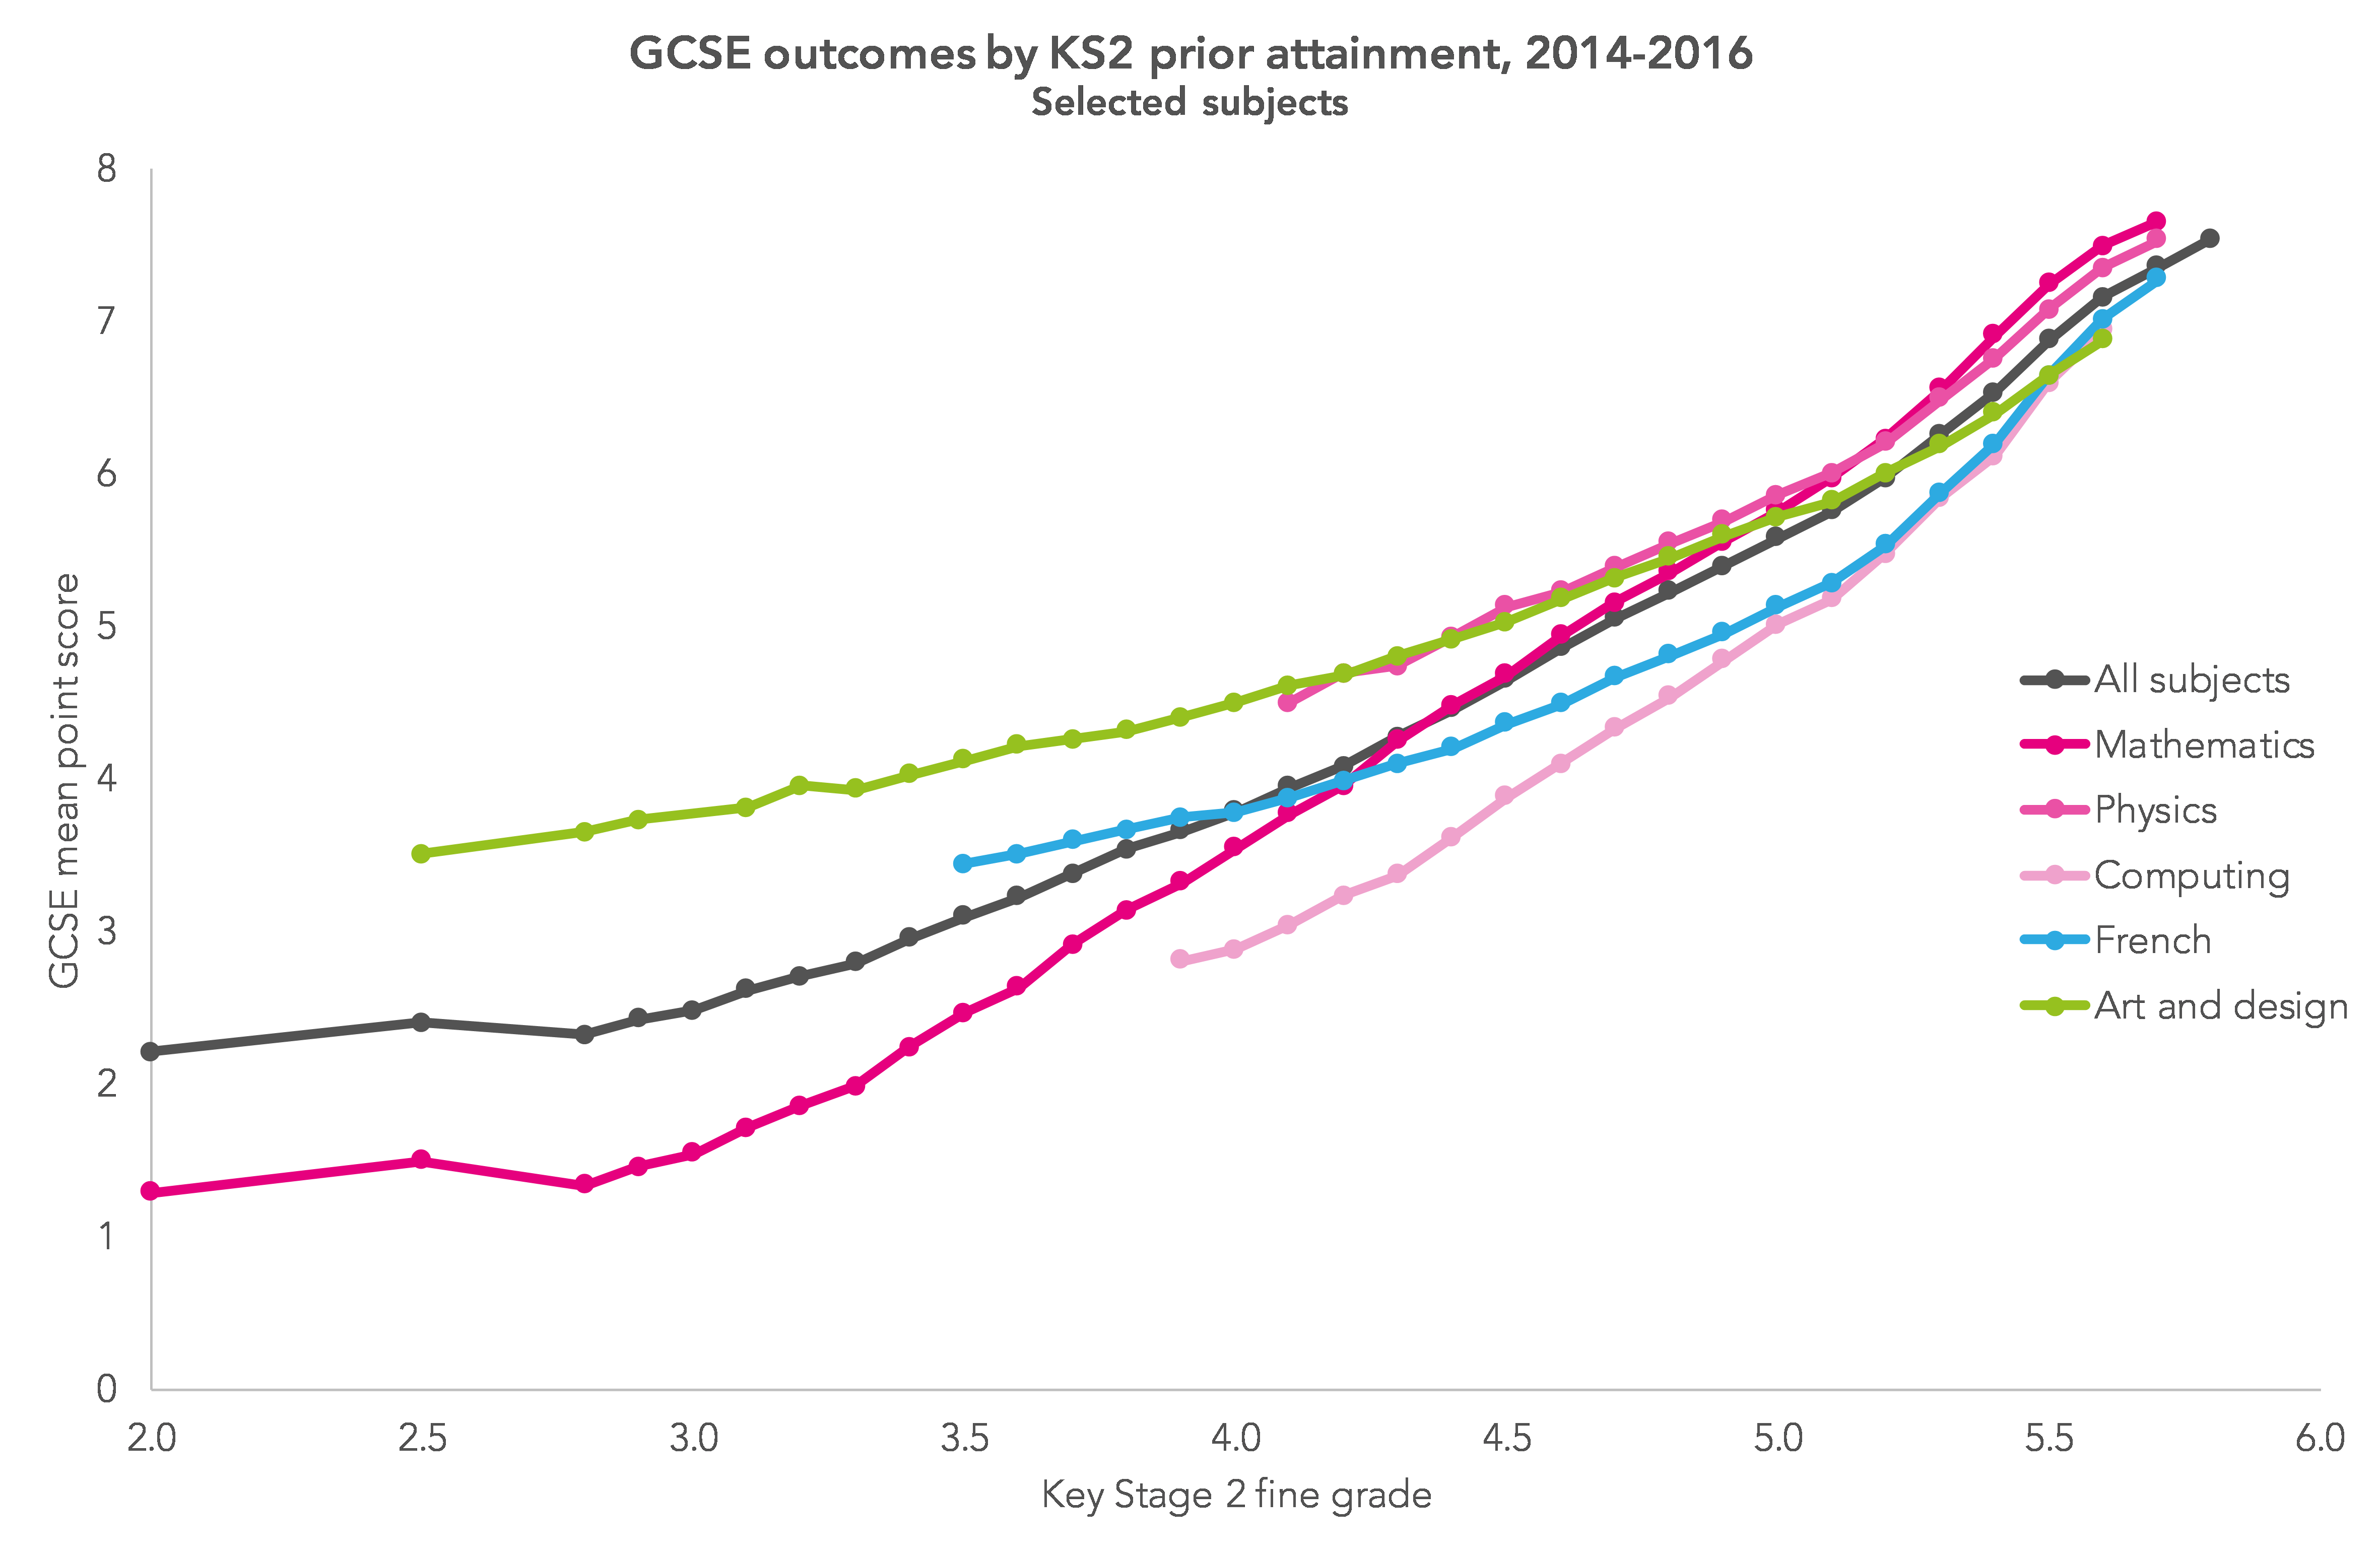
What can we learn from this data? Looking at the chart, we can see that:
- attainment in physics, and in art and design is consistently above the average for all subjects;
- attainment in mathematics is above average for pupils with KS2 attainment above 4.5, but drops below average for pupils with low KS2 attainment;
- attainment in computing and French is lower than average, but the lines diverge for pupils with KS2 attainment below Level 5.
Looking in more detail at variations between the sciences, my colleague Dave Thomson’s analysis suggested that the apparent ‘more lenient’ grading of triple sciences was probably a reflection of the motivation of pupils who chose this option.
Data such as this is a reminder that comparison of subjects within a school using attainment only can lead to highly erroneous conclusions. We can calculate value added separately for each subject and then compare progress in each subject. What we cannot, unfortunately, do is to add up each pupils’ subject value added to arrive at a qualification-neutral P8 score – Dave Thomson showed why here.
So what does subject value added tell us about within-school variation and can it be used to make a fair comparison of the effectiveness of different departments? We’ll look at that in two ways:
- A measure of the range of subject value added scores. Namely, ordering subjects in each school by their value added scores and calculating the difference between the average value added for the top 20% and bottom 20% of subjects
- The variance of subject value added scores within each school
Exploring variance and range
The charts below show data for the two schools used earlier.
Each chart shows subjects with 30+ pupil entries over three years (2014-2016), ordered by the overall subject value added score.
A value added score of +1.00 means that, on average, pupils in that subject attained one grade higher when compared with other pupils nationally in the same subject who had the same KS2 score.
Subjects in the top 20% of value added scores within each school are shaded in green and those in the bottom 20% are shaded in pink.
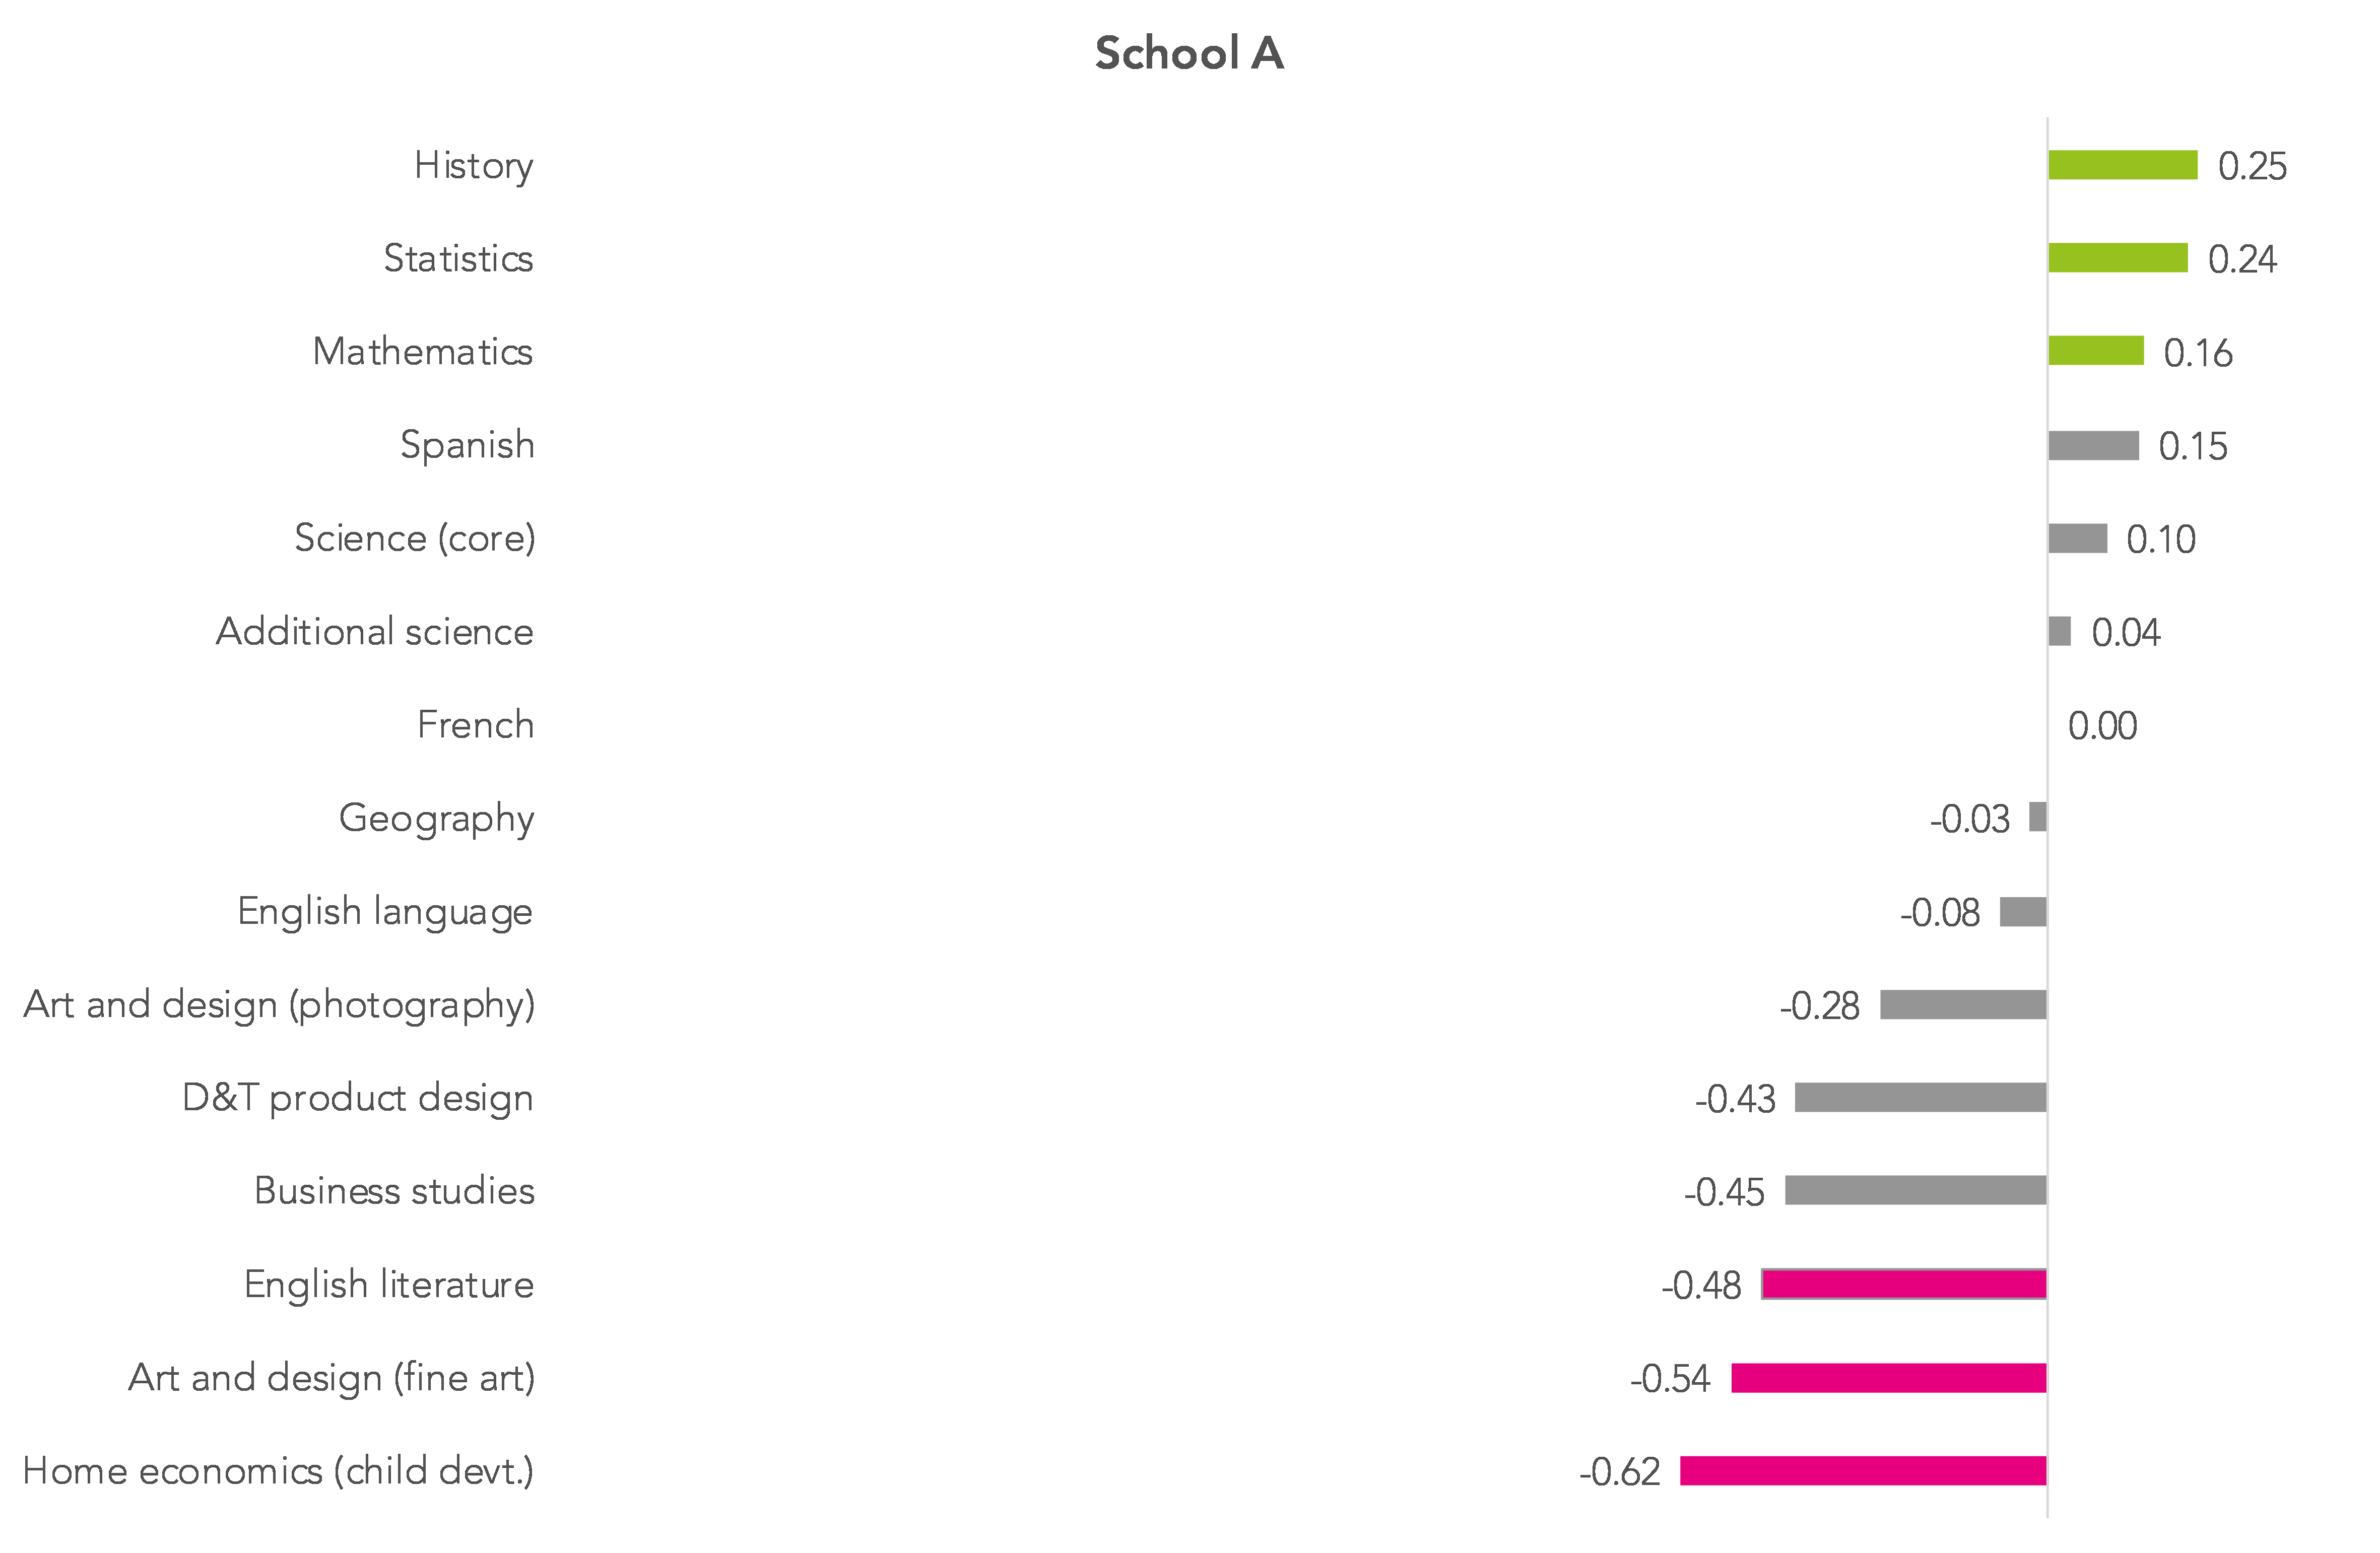
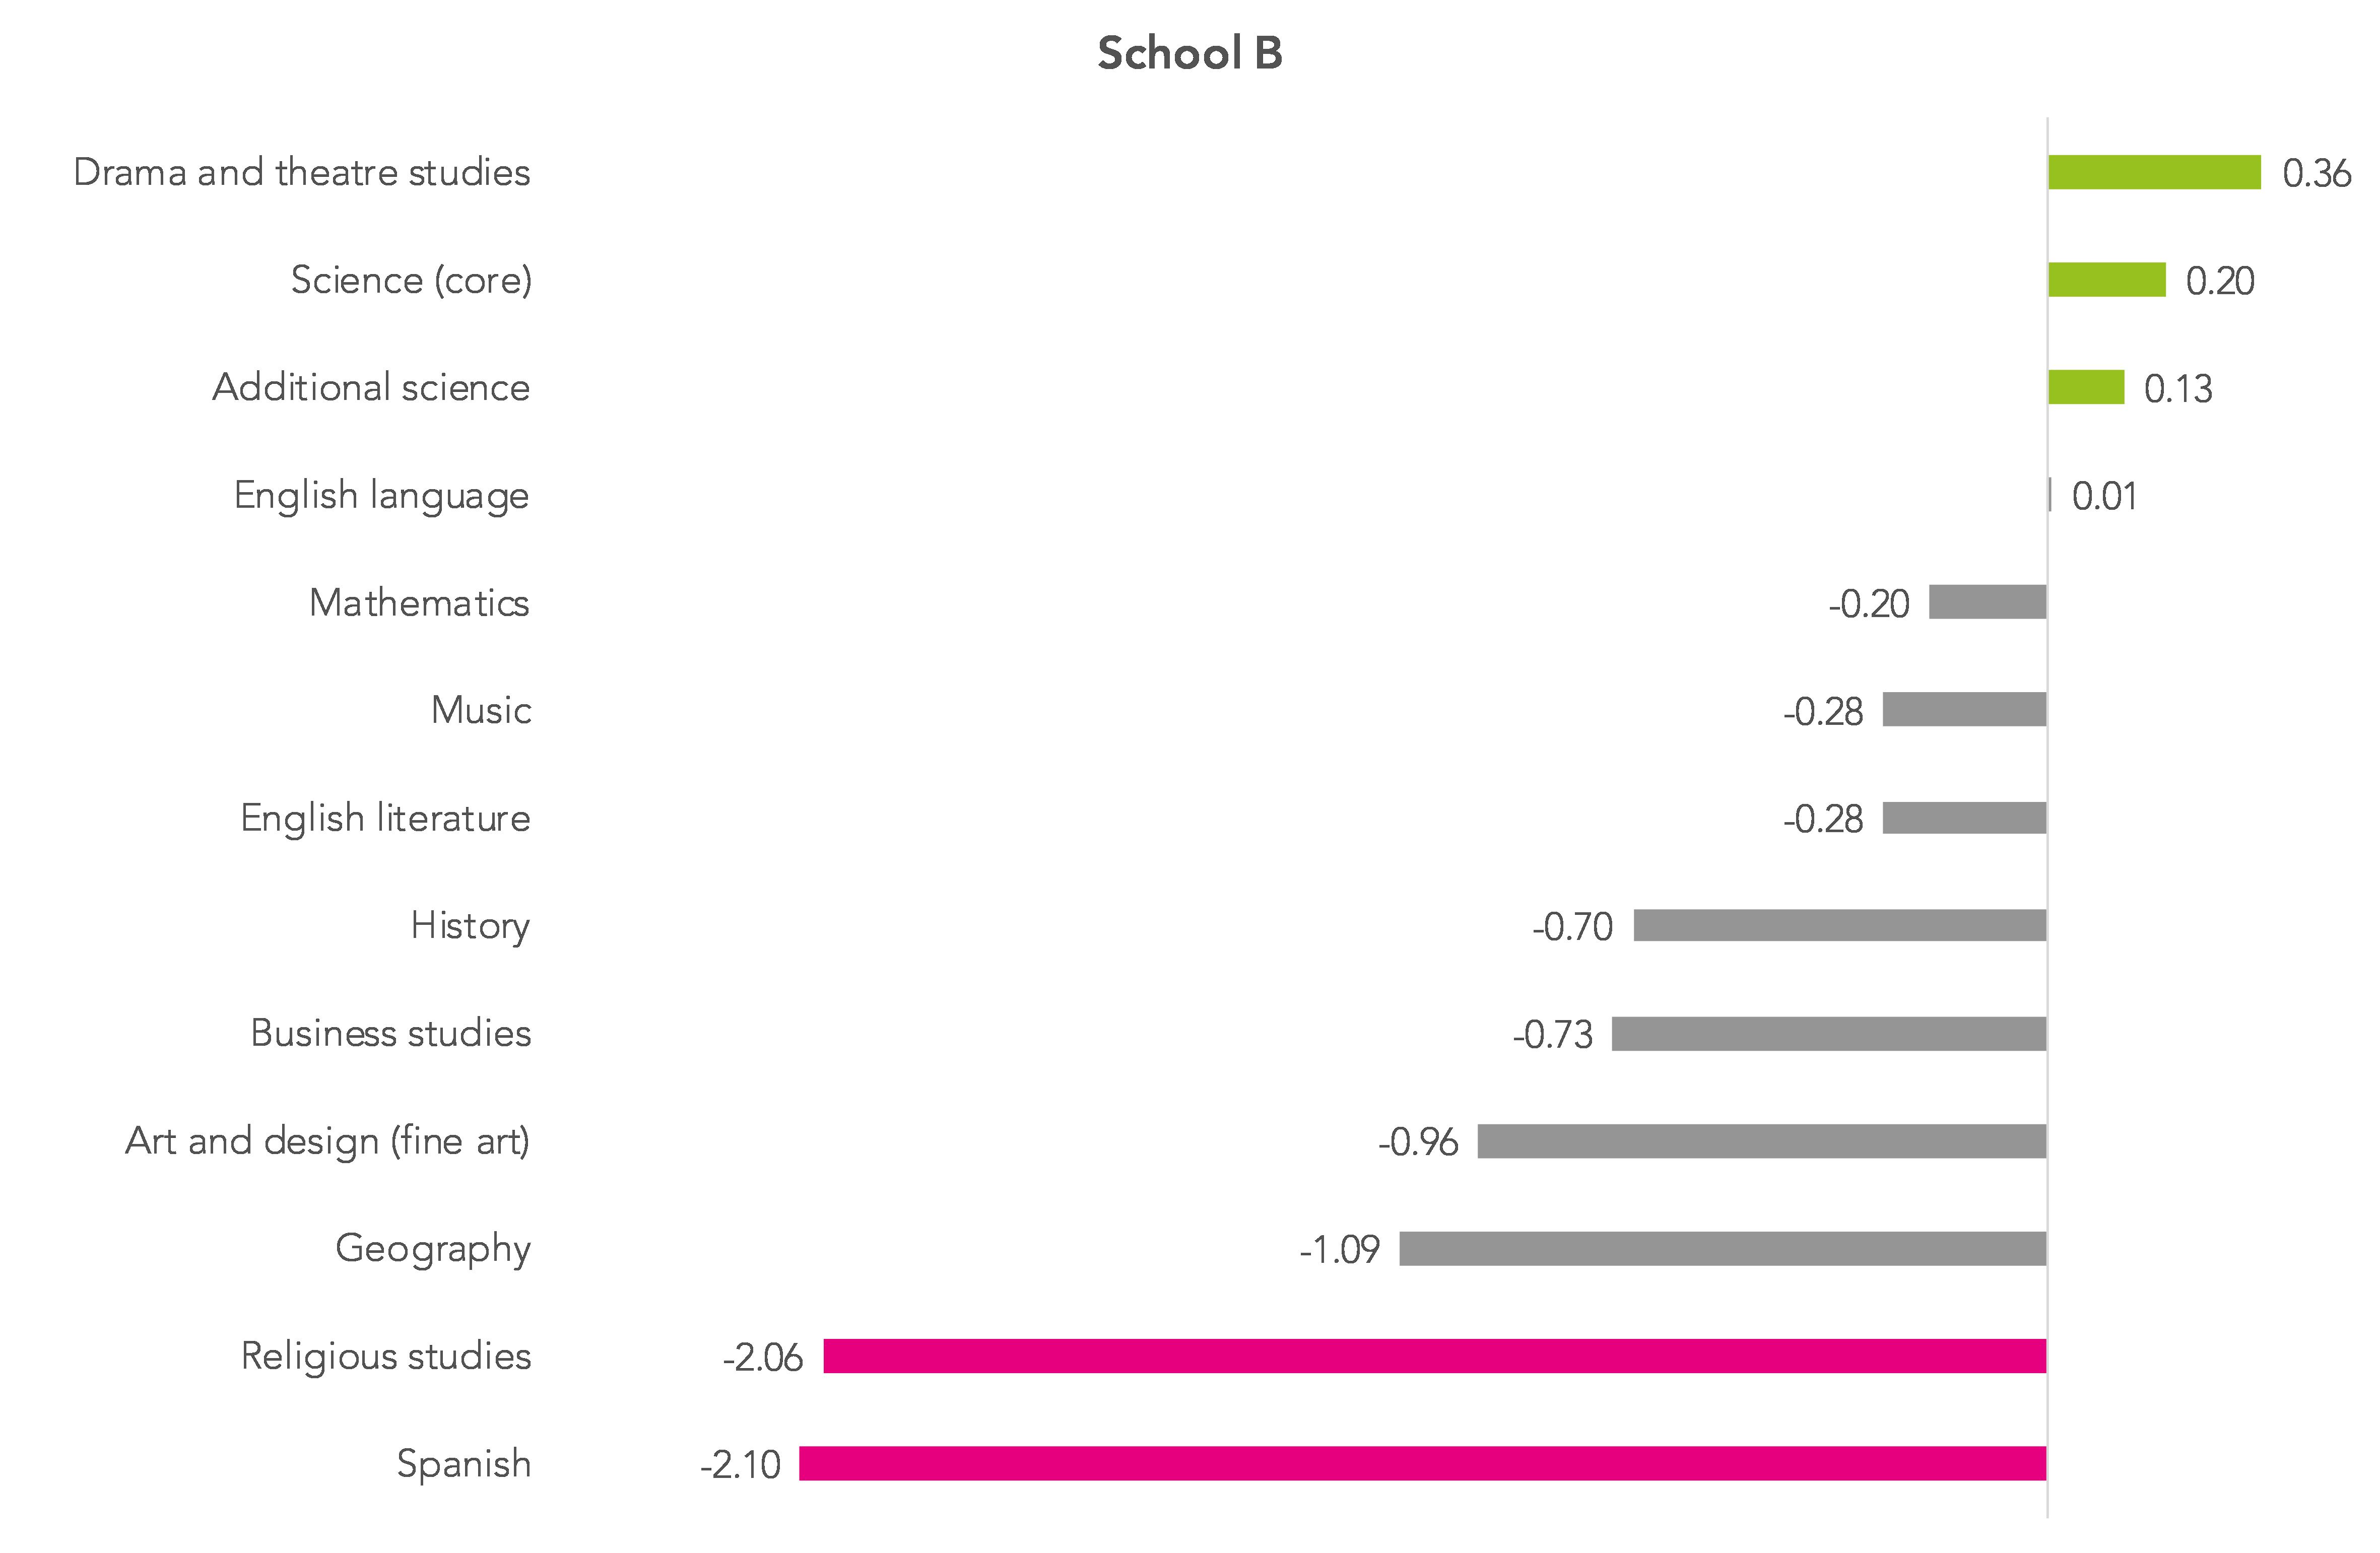
It’s clear that School B has far more variation in value added scores between subjects.
The table below shows the subject value added variance and range for schools A and B, together with their percentile ranks when compared to other secondary schools nationally.

What does this show?
School A has a much lower range and variance of subject value added scores than school B and is in the 10% of schools nationally with the lowest within-school variation. Despite this, it still has a variation of 0.7 of a GCSE grade between its highest and lowest performing 20% of subjects.
In fact, out of 3,030 secondary schools, just over half (1,580) have variations of one grade or more in their subject value added scores.
Does this make any difference to overall value added scores?
The table below shows, for schools divided into five equally sized bands based on their subject value added range scores, the average of their overall value added scores (using mean GCSE grade).
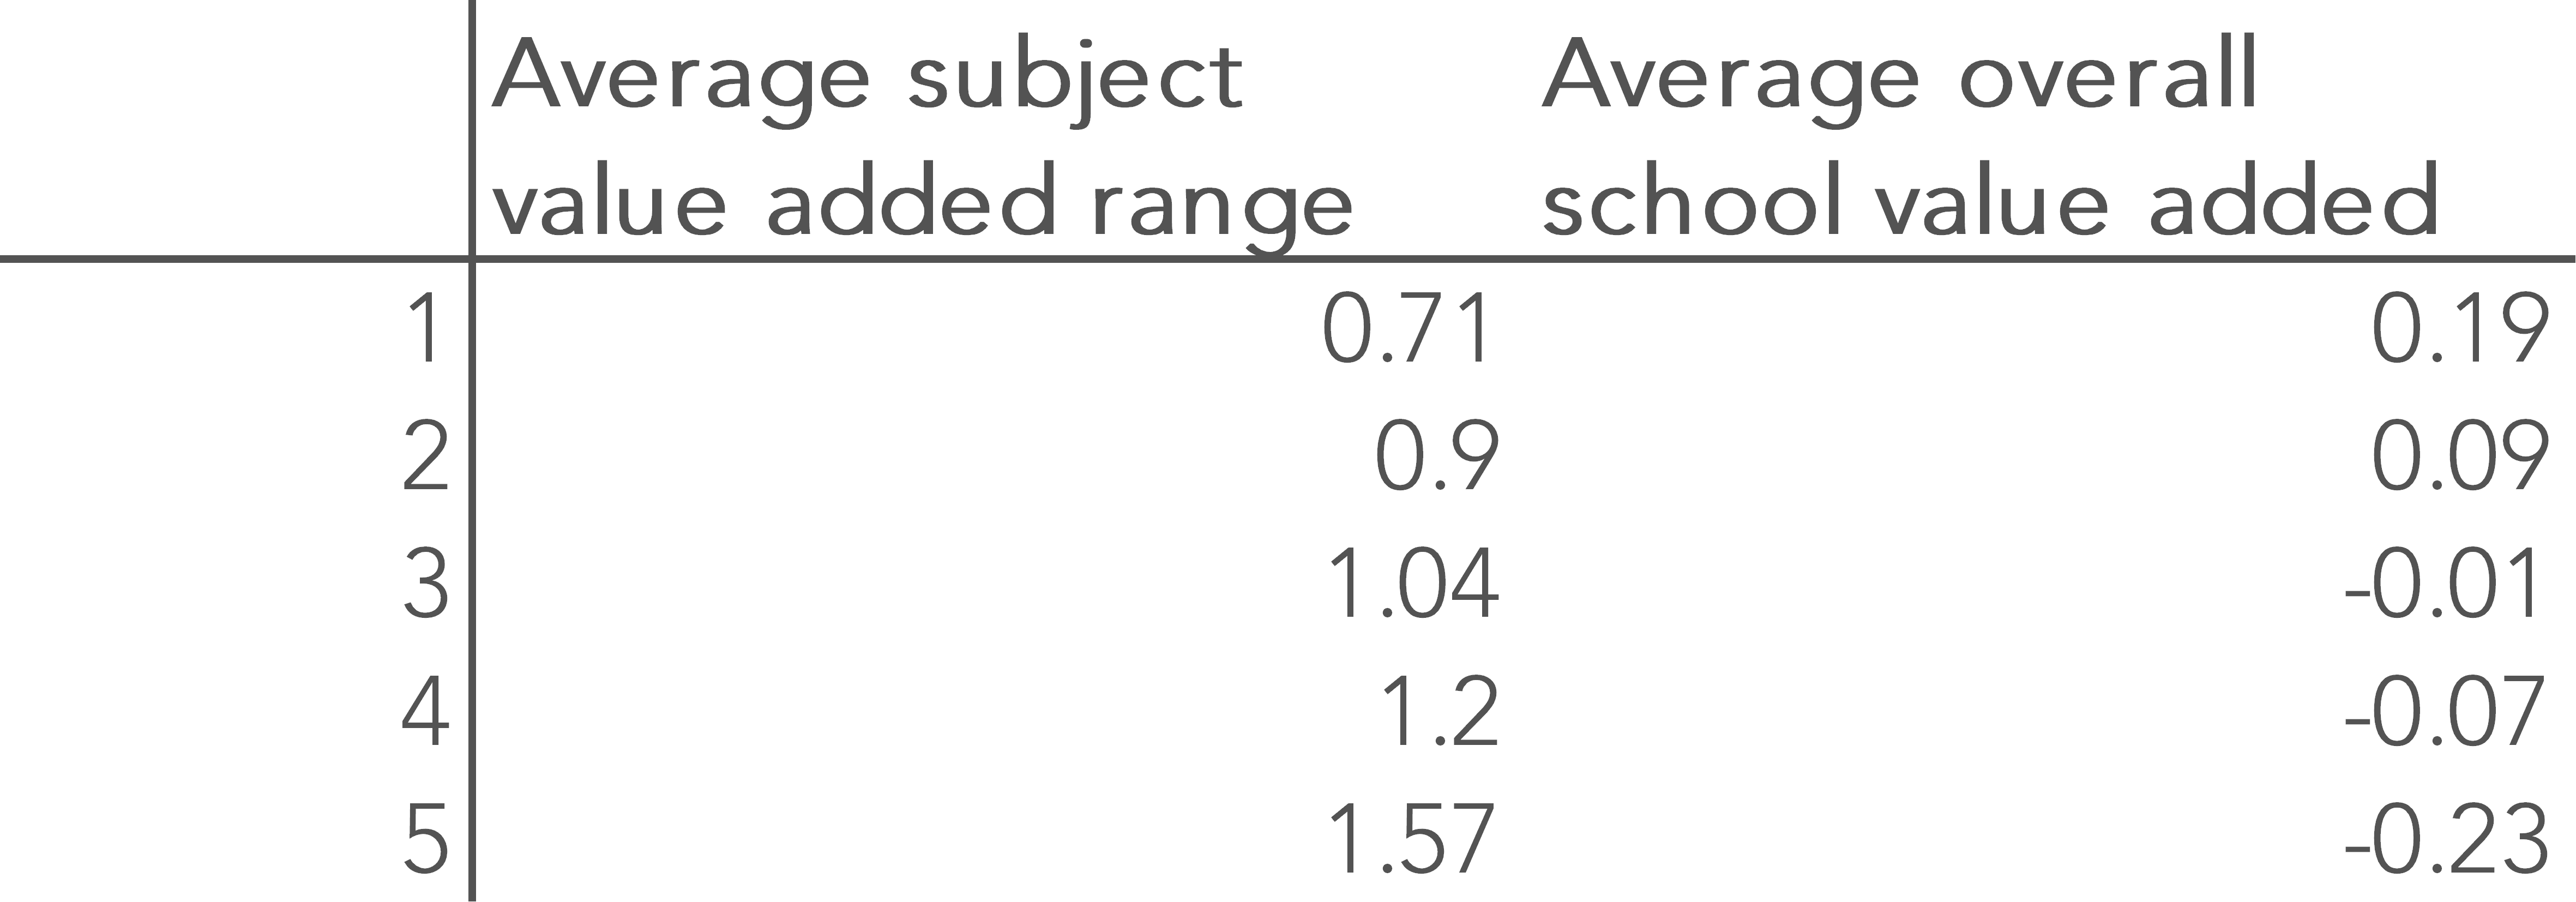
This shows that schools with low variation in subject value added performance have, on average, higher overall value added scores.
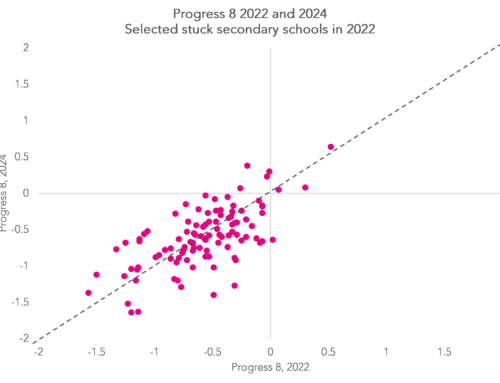
However, as is so often the case, looking underneath the averages raises further questions. The chart below shows the same data as used for the above table but, in this case, plotting the data for each school.
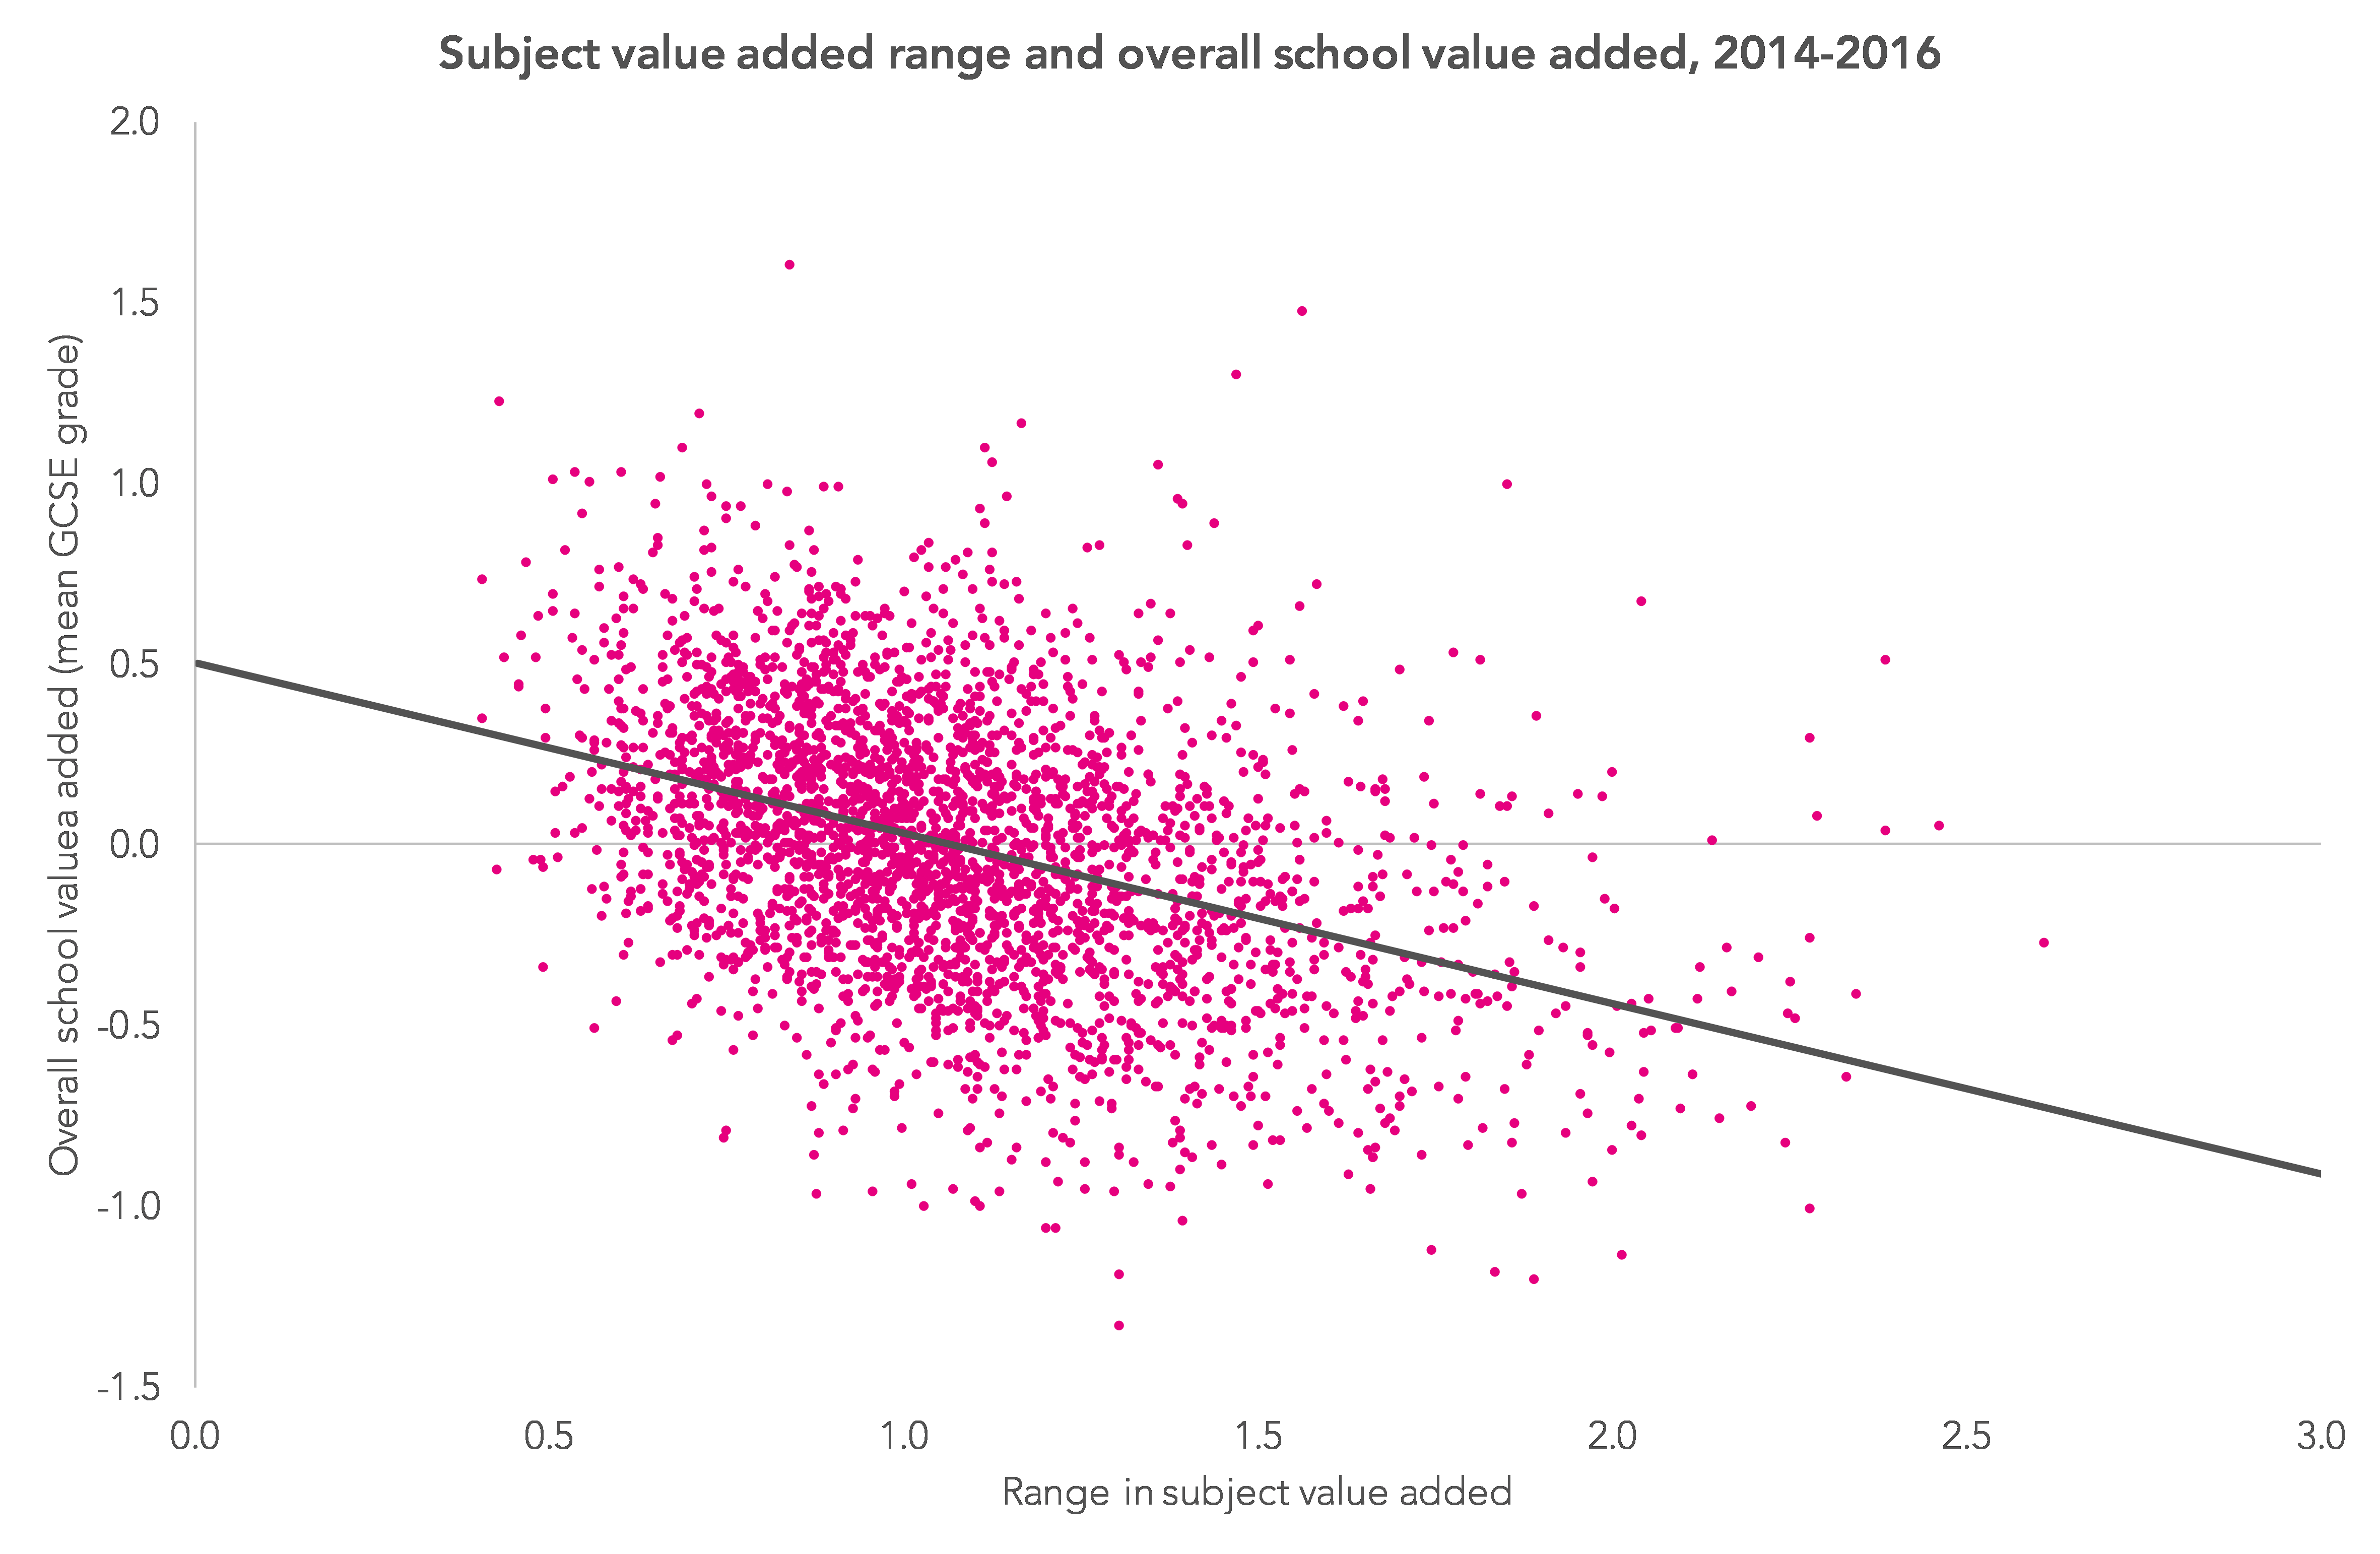
While there is an overall relationship, as shown by the best-fit line, the relationship is fairly weak with an overall correlation of 0.4, meaning that variation in subject value added accounts for less than 20% of the variation in overall value added scores.
Conclusions
This analysis has used value added scores to look at the variations in subject performance within schools. Using value added data eliminates national variations in subject grading and also takes account of the prior attainment of pupils taking each subject.
Despite taking these factors into account there are still wide variations within schools in subject performance.
What is causing this variation? Is it variation in the performance of teachers and individual departments? Does it relate, for subjects outside the core, to differences other than those based on prior attainment, such as gender, disadvantage, ethnicity and first language?
We will see what data analysis can tell us about these questions in part three of this series.
This is the second blogpost in a series looking at within-school variation. A link to the third post in the series will be added once it is published.
Want to stay up-to-date with the latest research from FFT Education Datalab? Sign up to Datalab’s mailing list to get notifications about new blogposts, or to receive the team’s half-termly newsletter.
1. Using data over three years means that a more accurate calculation can be made for small-entry subjects.

Thanks MIke
When will part 3 be out? I’m very keen to see it.
It will be useful to see all of these blogs updated to reflect the new ‘reformed’ world of course.
Glad you’re enjoying the series, Jo. The final instalment should hopefully be out in the next couple of weeks.