Over the last five years, the Department for Education has taken steps to reduce teacher workload. This was spurred by results from the TALIS 2013 survey which illustrated how teachers in England work longer hours than teachers in most other countries. The government subsequently pledged to “[collect] robust evidence on teacher workload at least every two years”.
But what counts as “robust evidence”? And has the DfE kept this promise? Let’s take a look.
What would “robust evidence” look like?
For evidence on teacher workload to really be “robust” it should meet the following three criteria (at least):
- The survey should include a large enough sample of teachers to minimise uncertainty due to sampling error
- The sample of teachers should be randomly selected and have a high response rate
- The questions used to collect data on working hours should have as little measurement error as possible
The main source the DfE uses to track teacher workload is the Teacher Workload Survey – (TWS). How well does this resource meet these criteria?
Well, the sample size is certainly large – over 3,000 teachers in 2016. But, as for the other two criteria? I am not so sure.
Is the TWS really representative of teachers in England?
Although the TWS draws a random sample, its credibility as a reliable source of information about teacher workload is undermined by its low response rates. Take the 2016 TWS. Out of the 900 schools initially selected, just 245 (27%) agreed to take part. Then, of the 10,410 teachers within these schools, just 3,186 (31%) completed the survey.
The final overall response rate can then be calculated by multiplying these two percentages together (27% multiplied by 31%). This gives a figure of just 8%.
Or, put another way, out of every 12 teachers who were meant to respond to the TWS, 11 didn’t.
With such a woeful response rate, the DfE’s promise to collect “robust evidence” on teacher workload looks a bit farfetched.
How reliably are working hours measured within teacher surveys?
The TWS essentially uses questions from TALIS (the Teaching and Learning International Survey) to measure teachers’ working hours. Specifically, respondents are asked:
a. A single question asking about total hours worked in a reference week;
b. Multiple questions asking about number of hours spent upon several different tasks (e.g. teaching, marking, administration, management)
The amount of time spent upon each task in b. can then be added together to give a second, separate estimate of teachers’ total working hours each week.
We can get a sense of how reliably teachers’ working hours are reported by comparing these two measures for the TALIS dataset. This is shown for England in the chart below.

Although there is a reasonable correlation between the two measures, it is far from perfect (the correlation coefficient is 0.74). In other words, there is quite a lot of reporting error in measures of teachers’ total working hours.
One of the implications of this is shown in the chart below, where total working hours of teachers are compared across countries using the two approaches.
England is show as a grey dot, and blue dots show countries with similar PISA performance to England. High-performing PISA countries are show in red; low-performing countries in green.
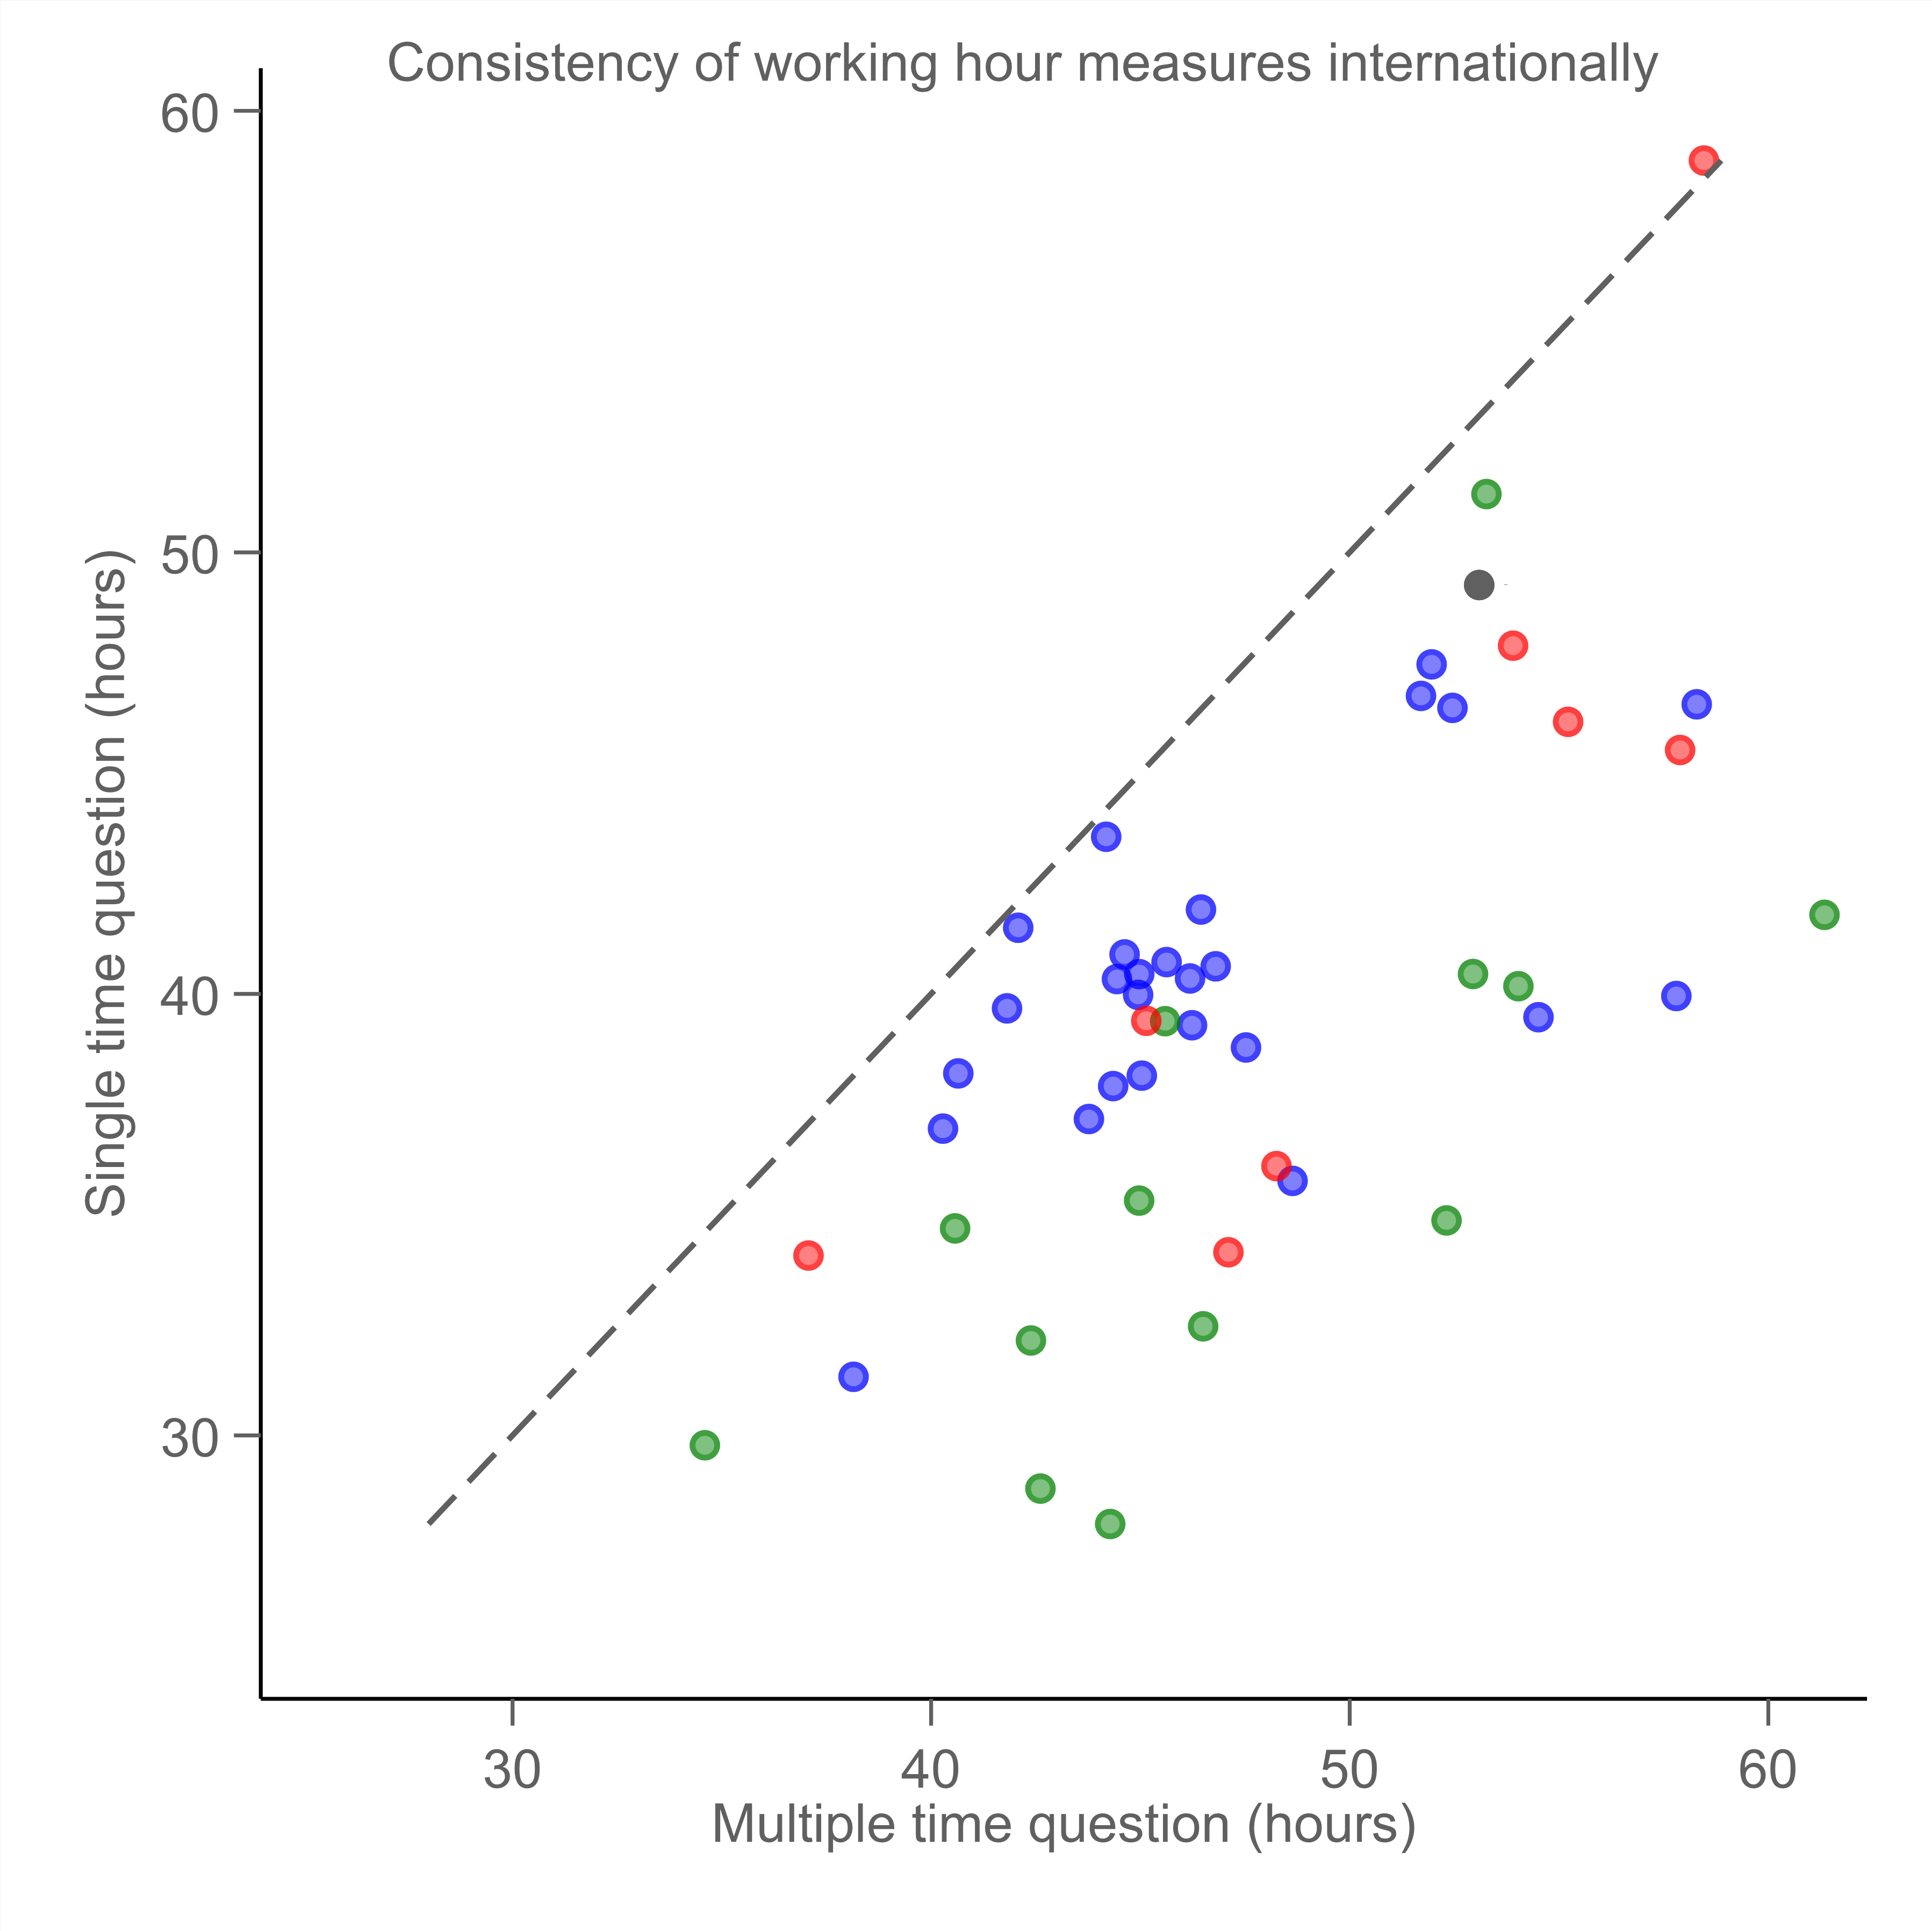 In some countries, the gap between the two measures is vast. In South Africa, for example, total reported working hours differ by 17 hours each week (35 versus 52 hours per week) depending which measure is used.
For England the gap is smaller, at around four hours – 49 hours versus 53. But that still represents a fair difference between the two measures – which raises more questions about measurement error. (It’s also worth saying that, whichever way you look at it, teachers in this country are working long hours.)
Given the fact that the TWS questions are based on those used in TALIS, we might suspect that similar issues exist with the TWS.
What should the DfE do instead?
This combination of low response rates and error in measurement has led me to conclude that the TWS, as it is currently designed, is not fit for purpose. It needs to change.
The gold standard would be for the next workload survey to attempt to gather time-use diary data from a truly representative cross-section of teachers. This will undoubtedly mean that the DfE has to commit more resource to measuring teacher workload, rather than trying to do it on the cheap.
Indeed, unless such data are collected, the DfE will probably never be able to measure teachers’ working hours with the necessary precision to determine whether their efforts to reduce teacher workload has succeeded.
This blogpost is part of a wider study into the health of teachers, funded by the Nuffield Foundation.
A sister blogpost released yesterday, summarising the latest evidence on teacher working hours in England, is available here.
Want to stay up-to-date with the latest research from FFT Education Datalab? Sign up to Datalab’s mailing list to get notifications about new blogposts, or to receive the team’s half-termly newsletter.


Great analysis – thank you
I agree that this is a very helpful analysis – but I think this needs also to be viewed in the wider context of the working hours of other professions e.g. lawyers, accountants, architects, medical staff etc as well as the general picture of working hours of people at work in the UK as well as in other European countries. it would be helpful to look at annualised hours.
The reason that I am suggesting this is that a large number of teachers drop out of teaching to work in other industries. Teaching is not actually a silo.
Thank you for your work which is most instructive: as it is for FFT generally.
Thanks James.
We are actually doing some other work, comparing teachers to other professions. So watch this space!
If this was the basis of the FFT blog from yesterday or the day before, then I found it most surprising. One of the key problems I had with it was that it kept referring to teachers but it seems to me that it was talking about secondary teachers. I had initially been in disbelief that the ‘average teacher’ did no work in the holidays as I would suggest that nearly 100% of primary teachers are required and expected to work in the holidays but also as primary generally requires daily marking, it seemed incredulous to me that only 4/10 reported evening work.
I think for clarity, it should be very clear if this is referring to the profession as a whole or simply secondary staff.
If this is not the methodology that produced yesterday’s blog then i apologise.
Thanks for the comment Matthew.
So in the paper, we sometimes focus upon teachers broadly defined (primary + secondary + SEN), though break out primary and secondary where we can (mainly based upon sample size considerations).
I agree, the results for working in the holidays is a surprise – as we say in the paper and the blog. And conflicts with other evidence presented from Teacher-Tapp. I think the key point here is that we know so little about teachers working hours outside of term-time. The data we use is far from perfect on this; but there is little else out there…..
As per the comments on the ioelondonblog:
This is interesting, but it’s perhaps important to be clear about what might be problematic or not.
1. Sampling error / bias
Overall participation rates and/or small sample sizes aren’t necessarily problems. Problems might follow more from biases, such as different people being more or less likely to respond to a survey, so that the final sample doesn’t match the expected sample.
A ‘low’ participation rate in TWS doesn’t entail that the entire sample/data is problematic or flawed – although it might reduce the statistical power to reveal some findings.
As an aside, schools and teachers cannot be forced to engage in research, and have many other obligations. Forcing teachers to participate isn’t exactly going to help their workloads…
2. Question phrasing
Remember that terms such as ‘measurement error’ are very general, and it’s important to be clear about what might be problematic. Abstracted ‘measurement error’ is somewhat unavoidable in any research – for example, when answering questions, people tend to approximate given limited time, varying motivation, and so on. If this is random, then it’s not necessarily a problem – although ‘random variation’ may entail that ‘variation linked with what we want to explore’ is harder to determine.
It sounds like an issue might be related to question phrasing or design issues, akin to ‘how could and should these areas be measured’ – because the total from across multiple questions about ‘hours worked’ seems to differ from the answer from a single-question about ‘total hours worked’.
In that case, it’s important to be clear about what the questions are exactly asking about – for example, the single-question might explicitly exclude some areas that are asked about within the detailed multiple questions.
Additionally, differences might plausibly reflect that (for example) when asked about a subject in detail over multiple questions, people might apply increased self-reflection and report things that they might have previously overlooked. (Is that necessarily a problem? The entire process seems to be mitigating against ‘everything relies on one single question’?)
3. Time diaries
I’m left feeling rather unclear how making data collection even more extensive, complex, and burdensome via time diaries would help. For example, how would timetabling various activities across an entire day for an entire week help achieve ‘necessary precision’ and eliminate ‘measurement error’? Many people would probably still approximate things – and might need incentives in order to undertake the extra burden (completing a time diary every day for a week rather than completing a 10-minute questionnaire).
4. Collecting data
Remember that, if existing data is considered to be problematic, you are always welcome to collect your own data. That gives you complete freedom to design your own sampling approach, questionnaire, and so on.
Thanks for the comment.
On (1). Bias will be a product of both low response rates and selectivity in the response. We know response rates to teacher workload survey are very poor. The selectivity of response is an open question.
On (2). Yes, how questions are asked are always important. But I think there is a clear case that the information provided in such surveys are less than 100% reliable. I have never really seen this investigated for teacher working hours. What we do is, I think, the best evidence available about the “reliability”
On (3) – time diaries. It is likely people would still approximate. But its likely to be better than trying to recall what work you did an entire week ago. How much work did I do last week – no idea! How much did I do yesterday, if I were now to complete a diary, I could do pretty well.
Dairies would also give much better information about working in evenings, at nights, at weekends, during holidays etc.
On (4) – I would love to! But I obviously don’t have the budget and resource that the Department for Education does…….
Put more simply teachers working long hours have neither time, nor desire to be filling in surveys.
Thanks Graham.
That is always a problem, and I sympathise with this.
Which leads me to think – either do the teacher workload survey properly (good response rates, accurate questions) or don’t do it at all an use existing data collections (e.g. the Labour Force Survey; TALIS).
At the moment, the TWS does not add much value, in my view…..