Contextual value added (CVA) is a technique used to analyse the progress made by pupils which takes into account a wider range of factors than value added.
Typically, value added only takes into account pupil prior attainment whereas CVA can include things such as ethnicity, free school meals status, mobility and first language. CVA can also include aggregate measures such as the average attainment of a school’s intake.
It was first included in Department for Education performance tables in 2005/06 but then dropped in 2010/11.
We – FFT – were calculating CVA before it was introduced into performance tables and have carried on calculating it since the government abandoned it. But do the reasons given for binning it stack up? And should the government bring it back
Why did the government stop calculating CVA?
The main reasons for dropping CVA – as discussed in this paper by George Leckie and Harvey Goldstein – were:
- It was hard to understand
- It was a poor predictor of success (though of what type of success the DfE never made clear)
- It expected different progress from different pupil groups
Do these stand up to scrutiny?
Well, CVA is undoubtedly a much more complex calculation than value added, but if – as argued by supporters of CVA – it was a more accurate reflection of school effectiveness then surely it would have been better to find ways of explaining it more clearly instead of dropping it?
The second reason suggests a misunderstanding of the role of CVA. Like any value added measure it is a retrospective measure and tells us only what happened in the past.
The third reason – that CVA contributed to lower expectations for pupils – was summarised by DfE in 2010:
‘It is morally wrong to have an attainment measure which entrenches low aspirations for children because of their background. For example, we do not think it right to expect pupils eligible for free school meals to make less progress from the same starting point as pupils who are not eligible for free school meals (particularly once the introduction of the Pupil Premium ensures that schools receive extra resources for pupils from poorer backgrounds). We should expect every child to succeed and measure schools on how much value they add for all pupils, not rank them on the make-up of their intake.’
I would argue that this represents a misunderstanding of the role of CVA. Thinking about what pupils might attain in the future is part of the process of setting targets. But, like any value added calculation, CVA provides an evaluation of what has already happened.
Were CVA calculations used to inform target-setting then there would be some justification in the DfE’s argument. But the DfE always said that CVA should not be used in target-setting. And while some schools and local authorities undoubtedly did use it in that way, anecdotal evidence would suggest that this was only a minority of schools.
Did CVA entrench low expectations?
So, is there any evidence that DfE were correct in the assertion that CVA entrenched low aspirations?
If this was true then we might expect to see some changes when we compare trends over two periods:
- 2006 to 2011, the era of CVA. (Although the last year of CVA was 2009/10 it seems likely that, if CVA did have any effect on expectations, these would have been set when pupils were in Year 10.)
- 2012 to 2016, when value added had replaced CVA
What might we expect to find?
Let’s consider schools which ‘benefitted’ from CVA i.e. where their CVA score was much higher than their value added score.
Typically, schools like this would have a high proportion of white British pupils from disadvantaged backgrounds. If CVA really was a factor in reducing expectations then we might expect value added to have improved more at these schools after the removal of CVA than at other schools, once there was no longer a justification for the lower expectations that it’s claimed existed.
We can look at this question by dividing schools into five equal-sized groups, or quintiles, based upon the percentage of their pupils who are white British and entitled to free school meals – focusing in particular on two of these groups:
- The first quintile, with 5% or fewer white British FSM pupils
- The fifth quintile, with 20% of more white British FSM pupils
When analysing KS4 data over the period in question we need to think about the impact of early exam entry. From 2008 until 2013, the proportion of pupils with multiple entries increased substantially, then dropped when the DfE introduced the ‘first entry only’ rule. To get around this, given that most early entry was in English and mathematics subjects we can base value added scores on pupils’ average grade in GCSE subjects excluding English and mathematics.
The chart below shows value added scores for these two groups of schools for the period from 2006 to 2016. It shows standardised value added scores – that is, the scores are in terms of standard deviations from the mean, which is zero.
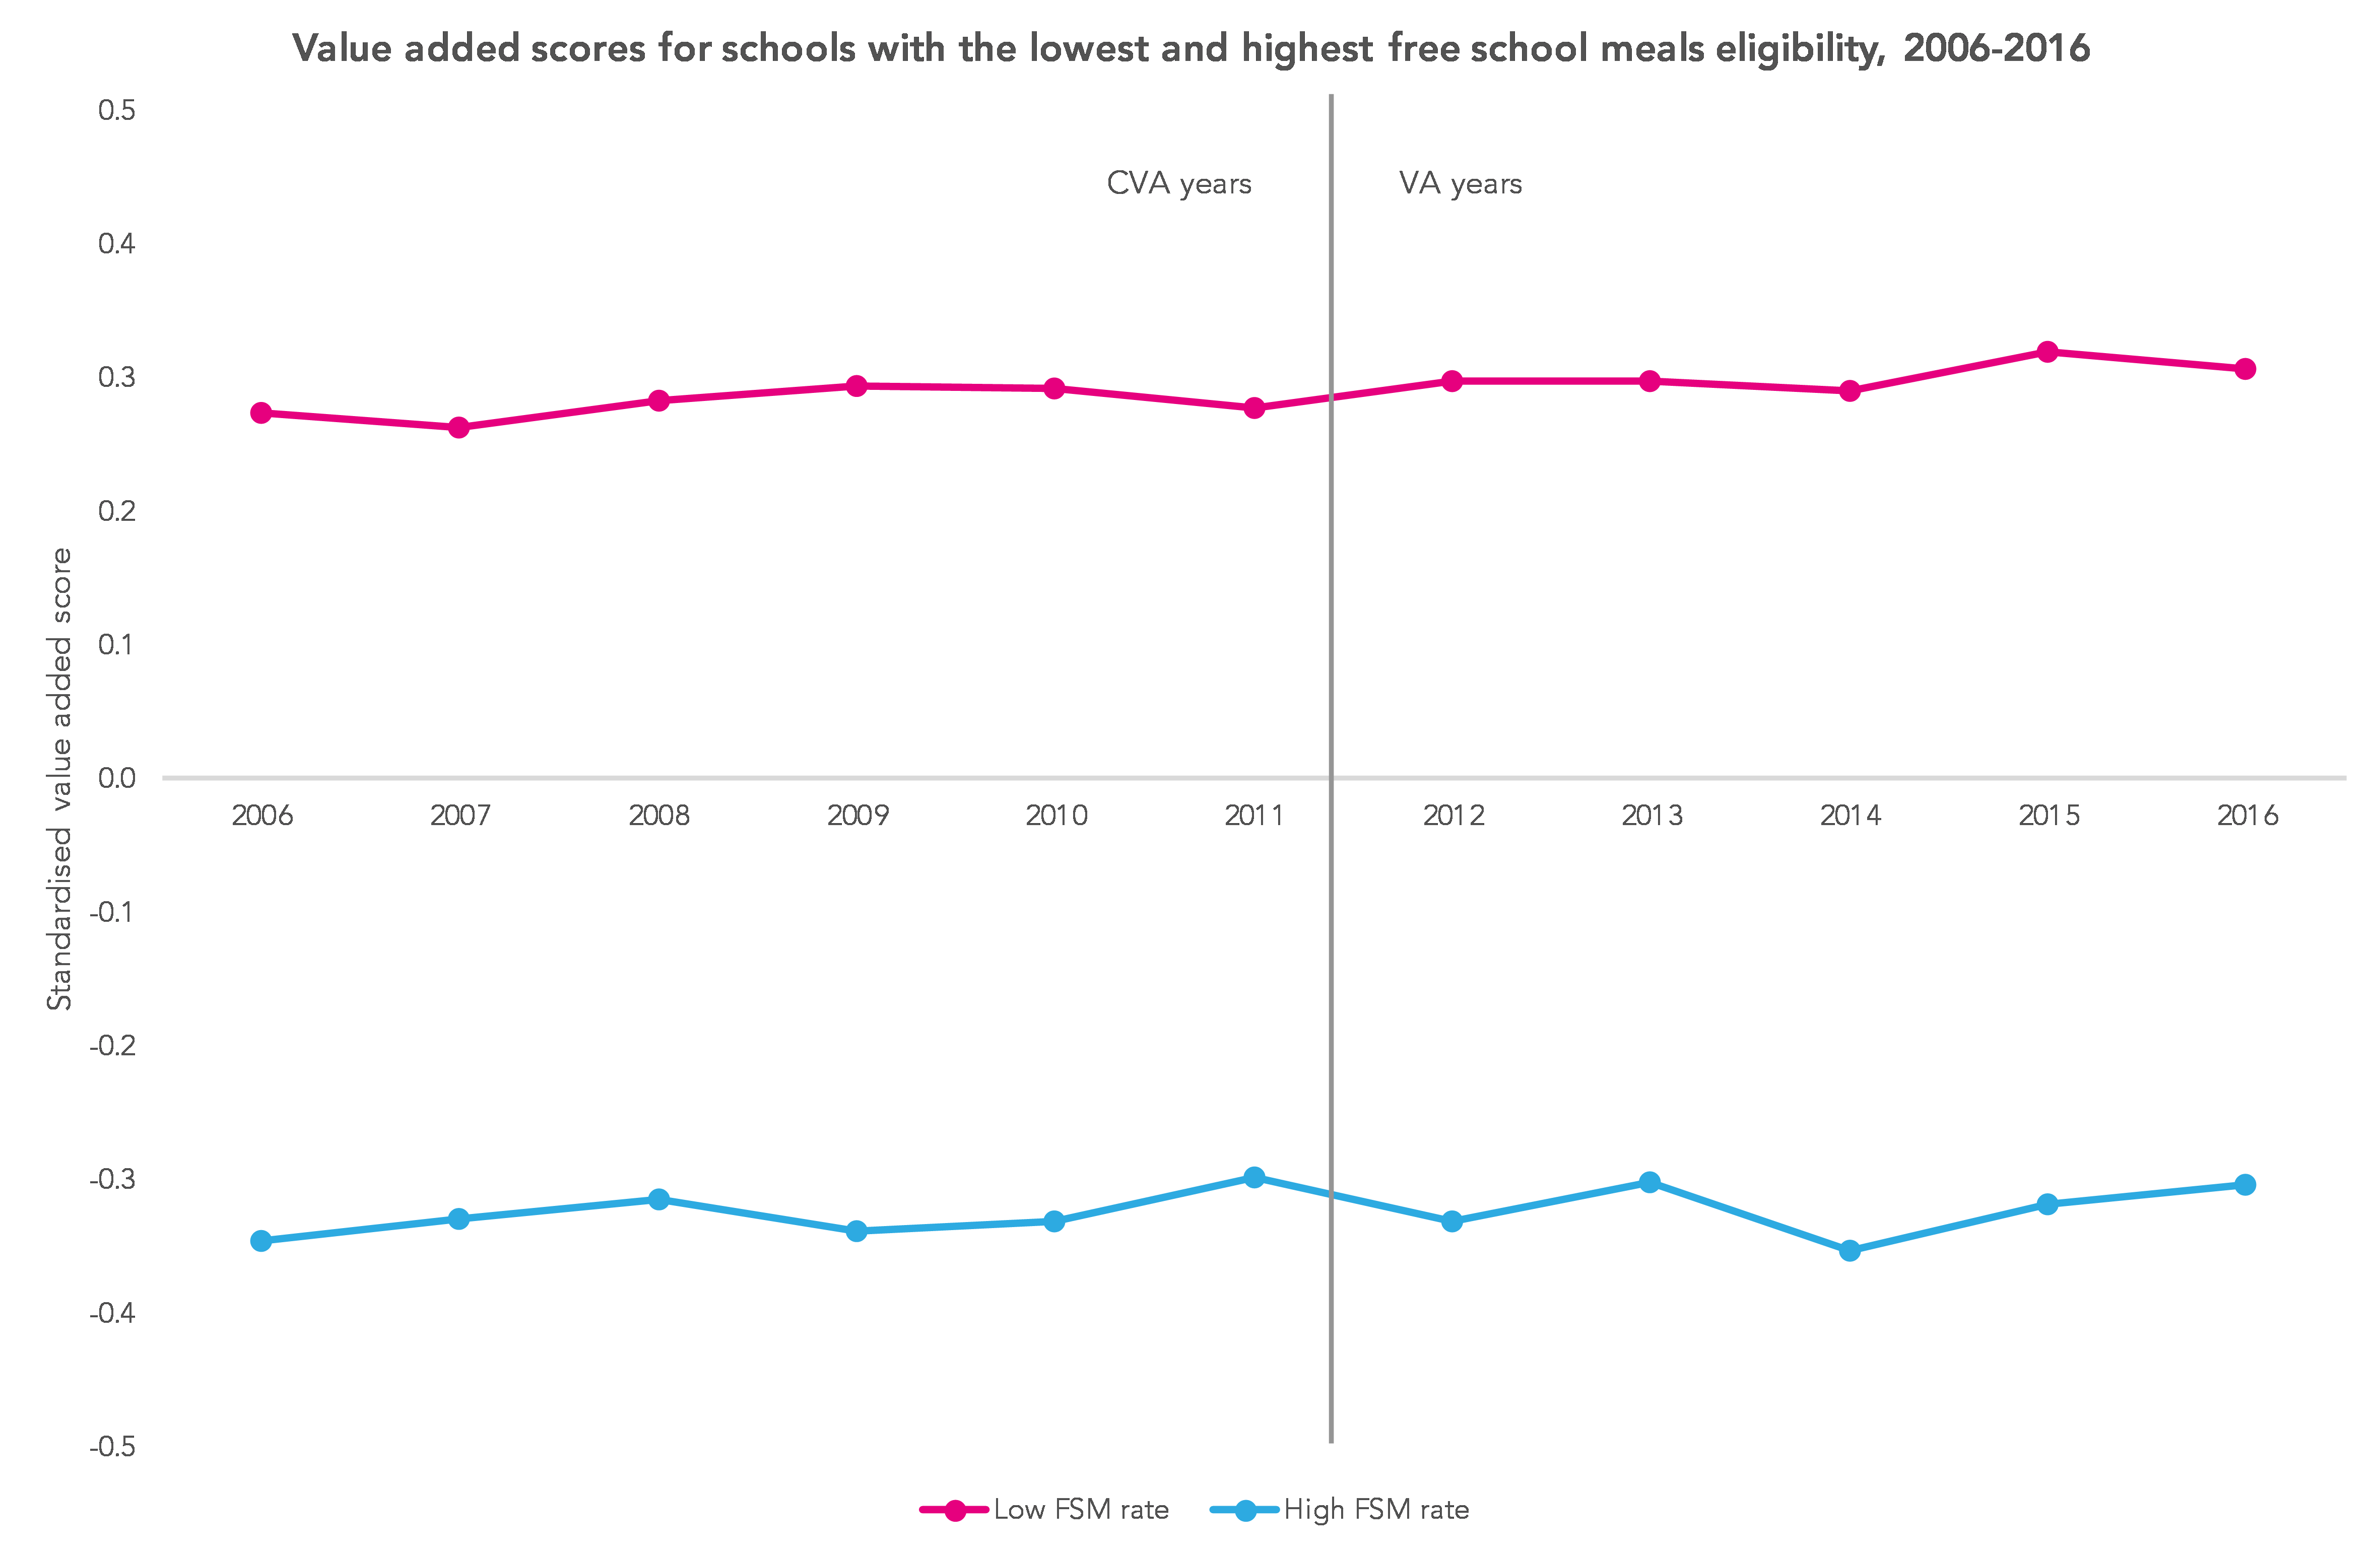
Overall, changes in value added over time are relatively modest.
Looked at another way, the chart below shows the average annual change in value added for the CVA years, 2006 to 2011, and the value added (VA) years, 2012 to 2016, for these two groups of schools.
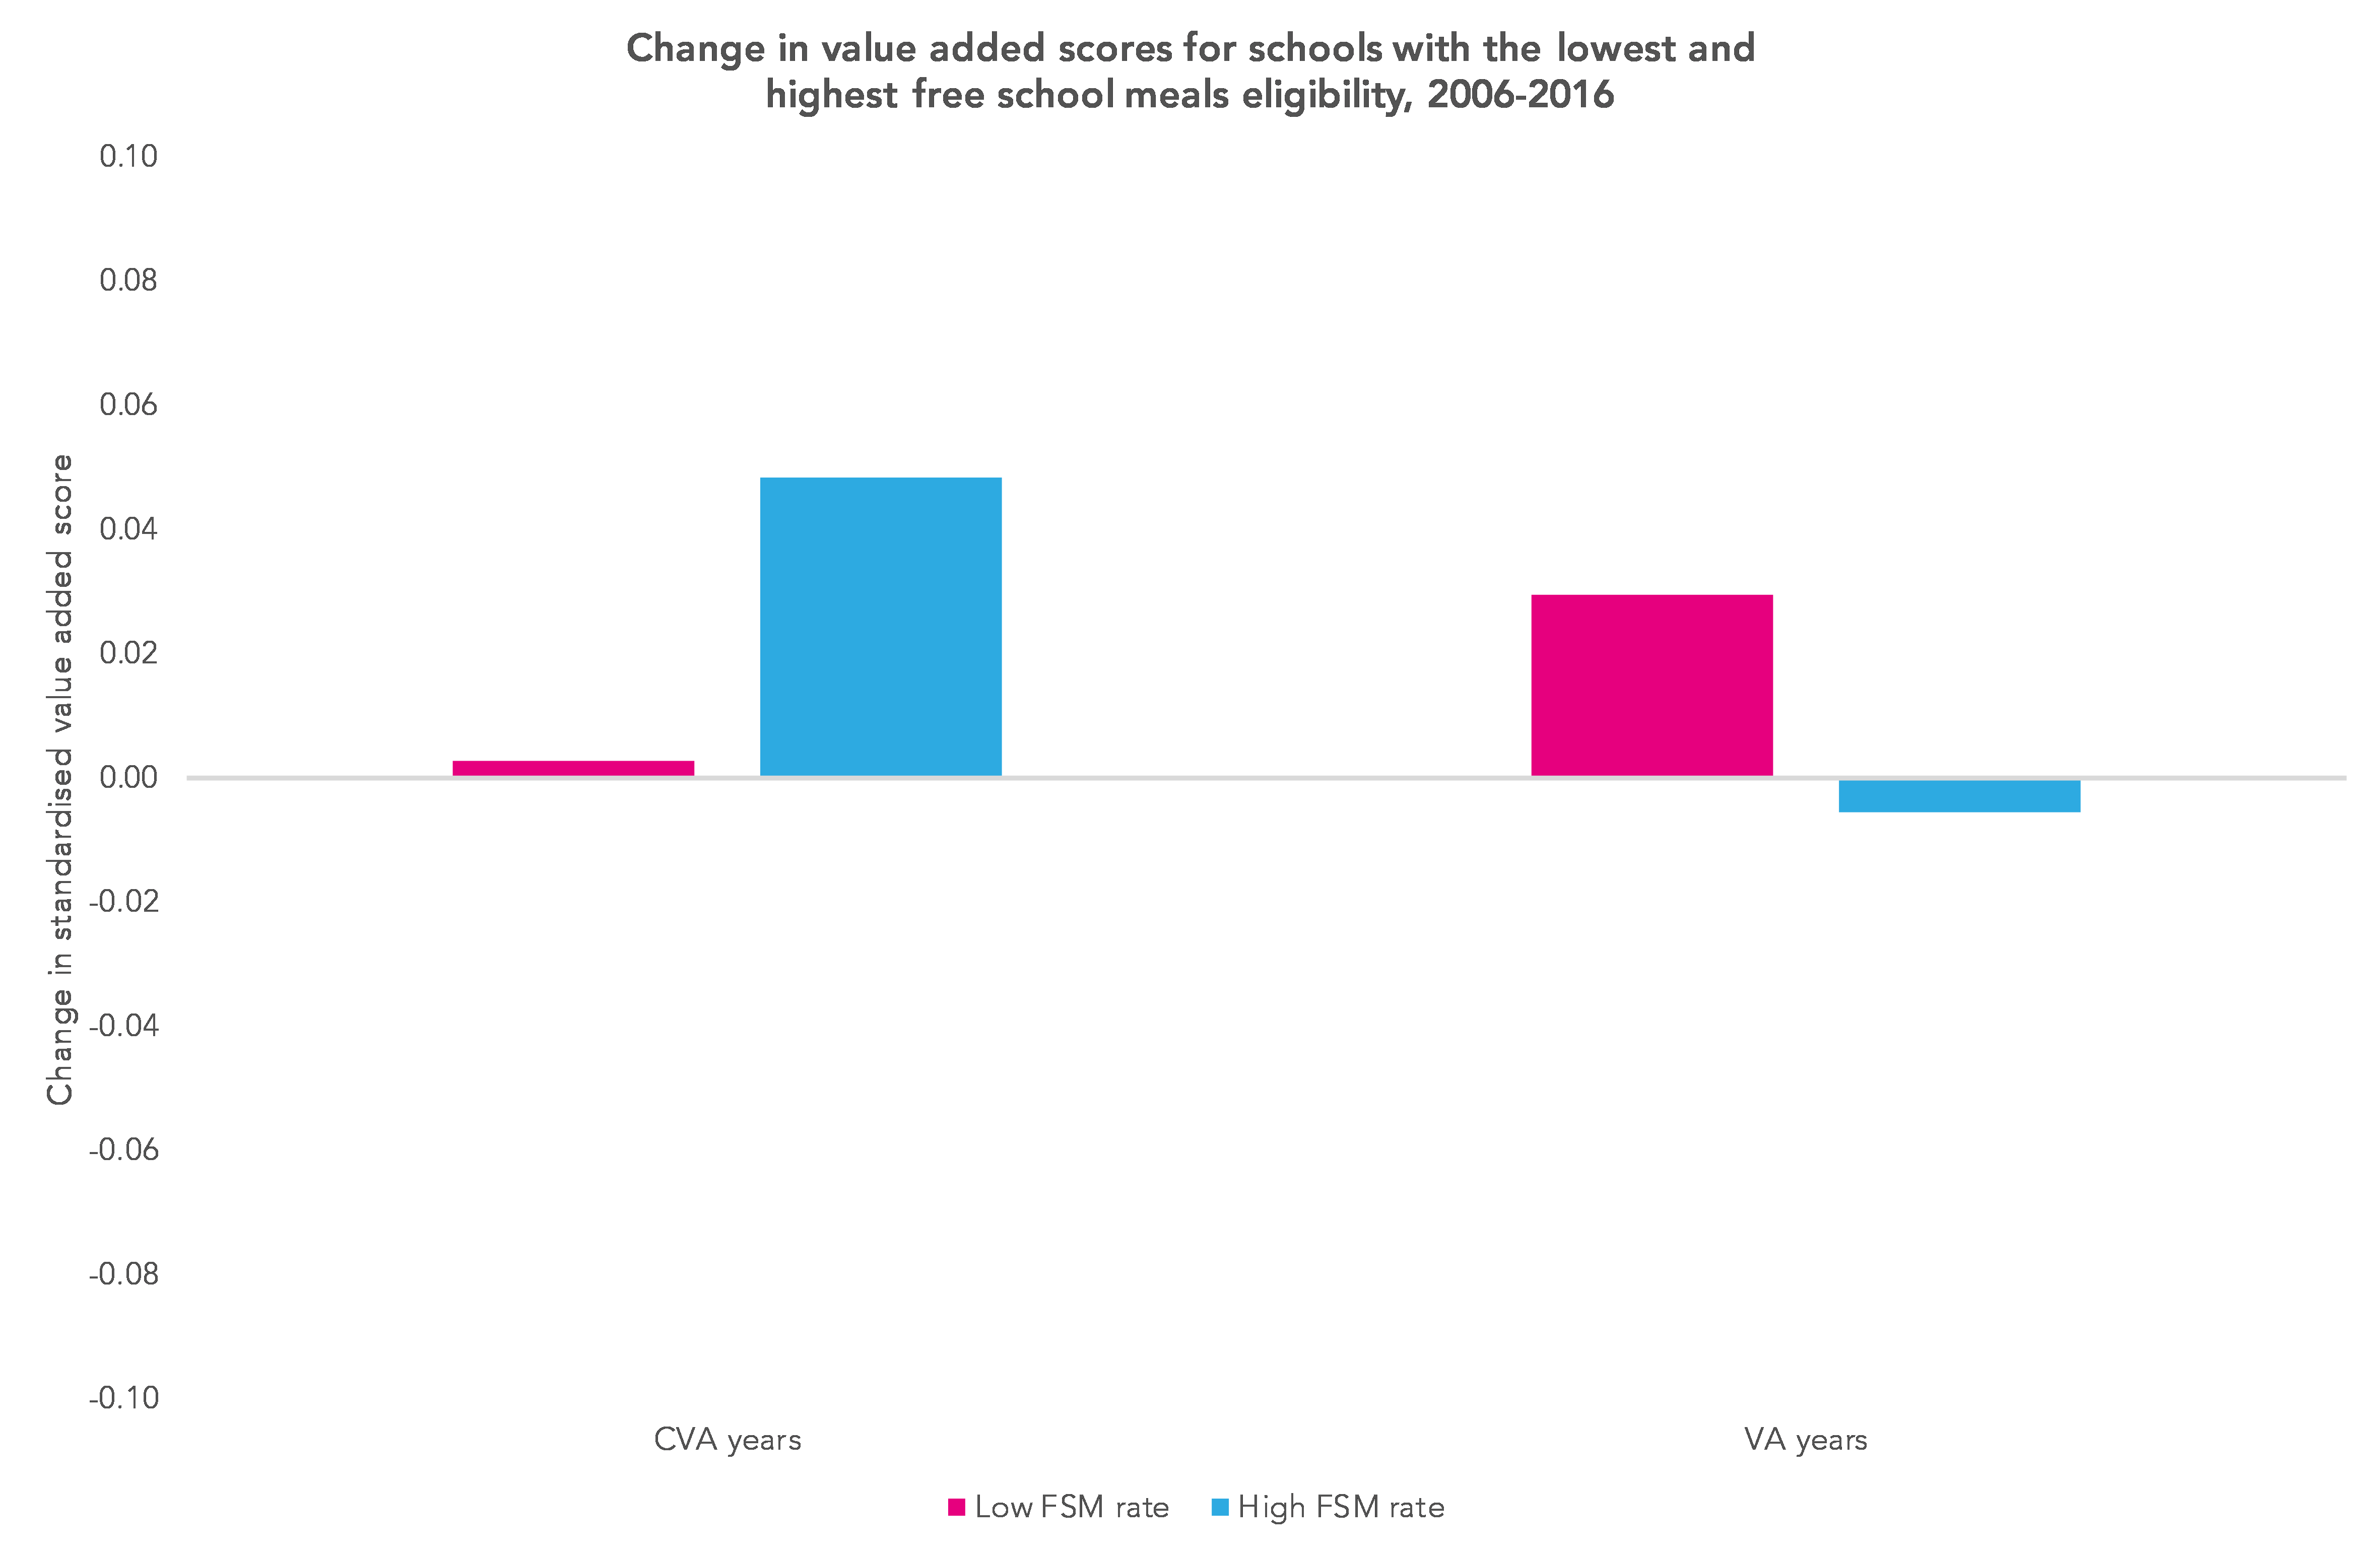
It suggests that value added scores in schools with a high proportion of FSM-eligible pupils improved during the ‘CVA years’ and, after that, showed little change. It’s the opposite of what we would have expected if CVA had lowered expectations for disadvantaged pupils.
Conclusion
Could it be that, instead of reducing expectations, the message that CVA gave to schools serving economically disadvantaged areas was that they were doing well despite the impact of disadvantage? And that this resulted in both the school staff and inspectors having a more positive view of the school, aiding recruitment and retention?
In reality there are lots of factors at play here and it’s probably impossible to separate out their influence. It would, though, seem reasonable to conclude that there is no evidence to support the view that CVA led to lowered expectations for disadvantaged pupils.
So, should we bring back CVA? As Dave Thomson shows here, taking a CVA approach to Progress 8 leads to a view that differences between schools are less than is seen from a value added perspective.
Maybe the real problem here is the need felt by some to have one ‘headline’ measure?
No single indicator and/or methodology can meet the needs of different audiences – parents, governors, inspectors, government – and different purposes – accountability, inspection, and choosing schools.
Might the way forward be to use CVA, along with value added and attainment, but only in the context of inspection and self-evaluation?
Want to stay up-to-date with the latest research from FFT Education Datalab? Sign up to Datalab’s mailing list to get notifications about new blogposts, or to receive the team’s half-termly newsletter.


Leave A Comment