Simon Burgess and I have just published some research into the impact of GCSE reforms on the attainment gap between disadvantaged pupils and their peers.
We found that the reforms have had a tiny, negative effect on the gap, particularly around the new grade 5.
However, this was for disadvantaged pupils as a whole. By convention these are defined as pupils eligible for free school meals at least once in the six years up to and including Year 11.
But in previous Datalab work we’ve seen that the attainment gap for long-term disadvantaged pupils has actually been widening while narrowing for other disadvantaged pupils.
What effect did the GCSE reforms have on this group?
The gap in maths
Just like in the published research, I’m going to look at the period 2016 to 2018. However, rather than comparing all disadvantaged pupils to non-disadvantaged pupils, I’m going to look at the long-term disadvantaged group.
To define long-term disadvantage, we look at pupils’ full free school meals histories from Reception onwards. We define long-term disadvantaged pupils as those eligible for free school meals for at least 80% of their time at school.
Let’s take a look at what happens to grades in maths GCSE for this group compared to grades for non-disadvantaged pupils, looking at pre-reform (2016) results versus post-reform (2017 and 2018) results.
First of all, let’s look at the chart from our research that compares the maths grades of all disadvantaged pupils to those of non-disadvantaged pupils.
In the chart below, the horizontal axis shows the percentage of non-disadvantaged students achieving at least a particular grade. The vertical axis shows the same measure for disadvantaged students. It plots these numbers for the pre-reform grades and the post-reform grades. At the points highlighted in the chart – grades A/7 or above and C/4 or above – a direct comparison can be made between the two grade systems.
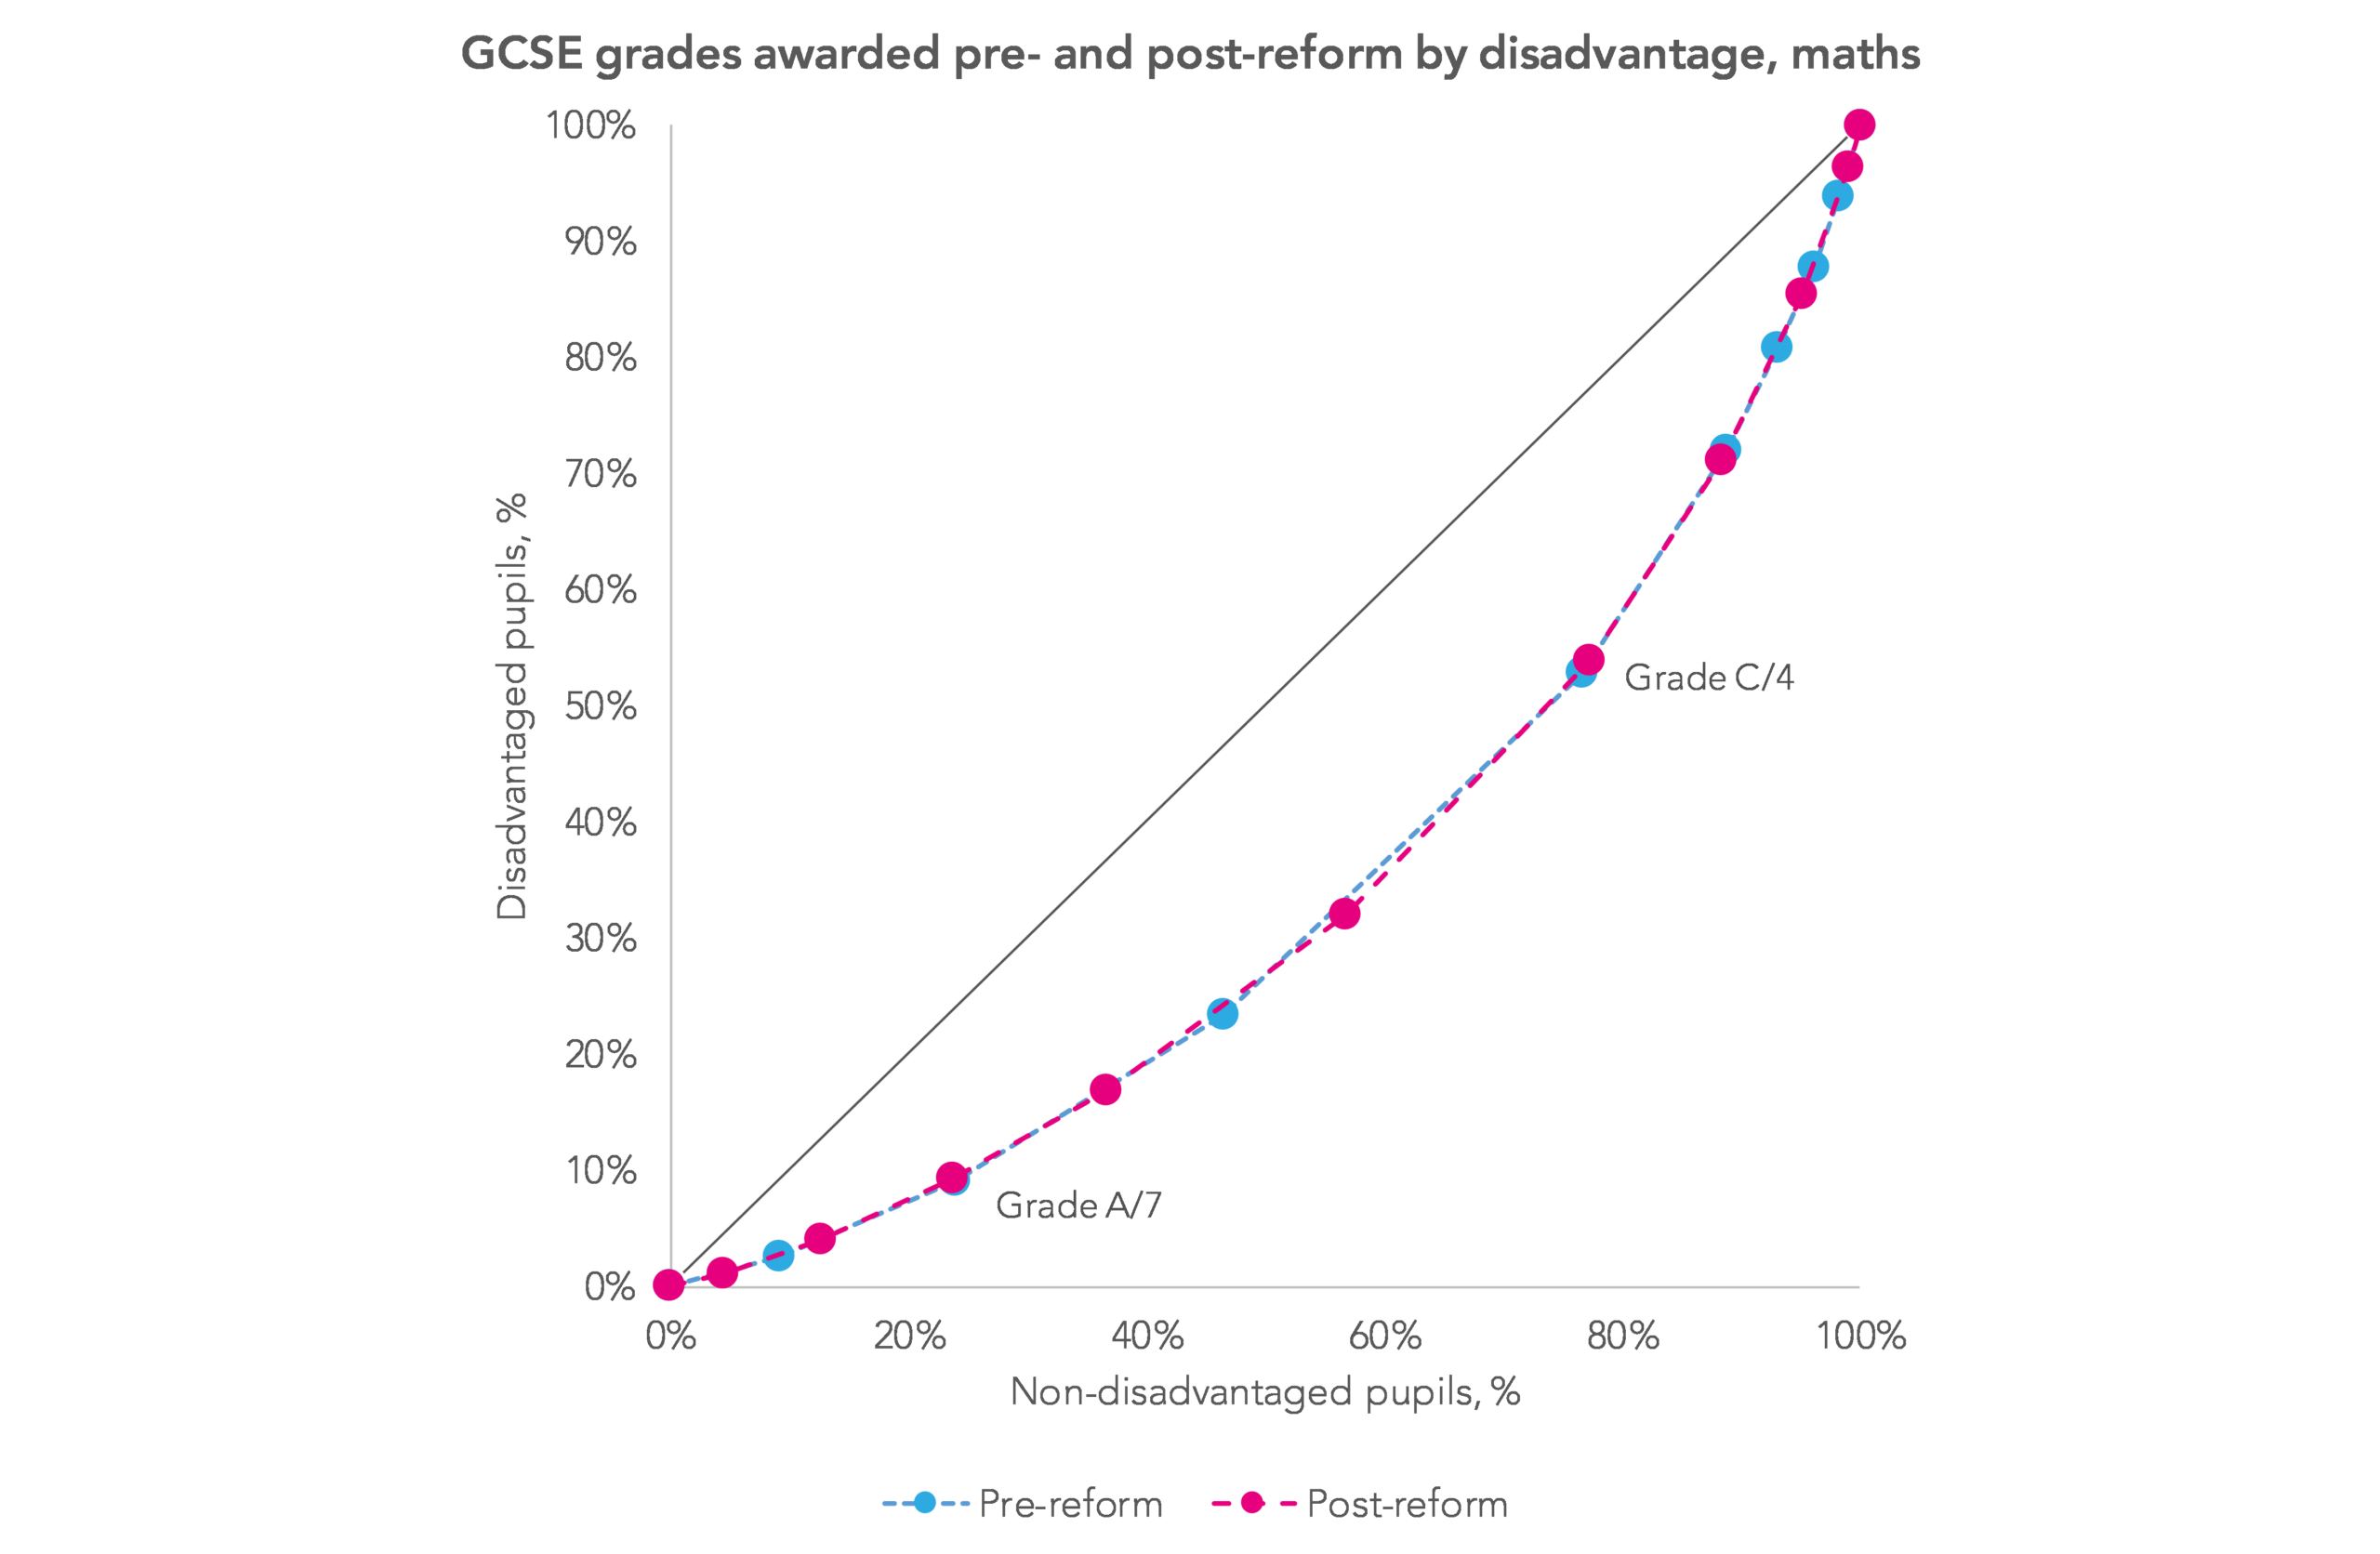
If there were no attainment gap, all the points would fall along the solid 45-degree line. The dashed lines almost lie on each other, indicating little change in the gap, though the pink “post-reform” line lies slightly below the blue “pre-reform” line at grade 5.
Now let’s look at the same chart for long-term disadvantaged pupils – shown below.
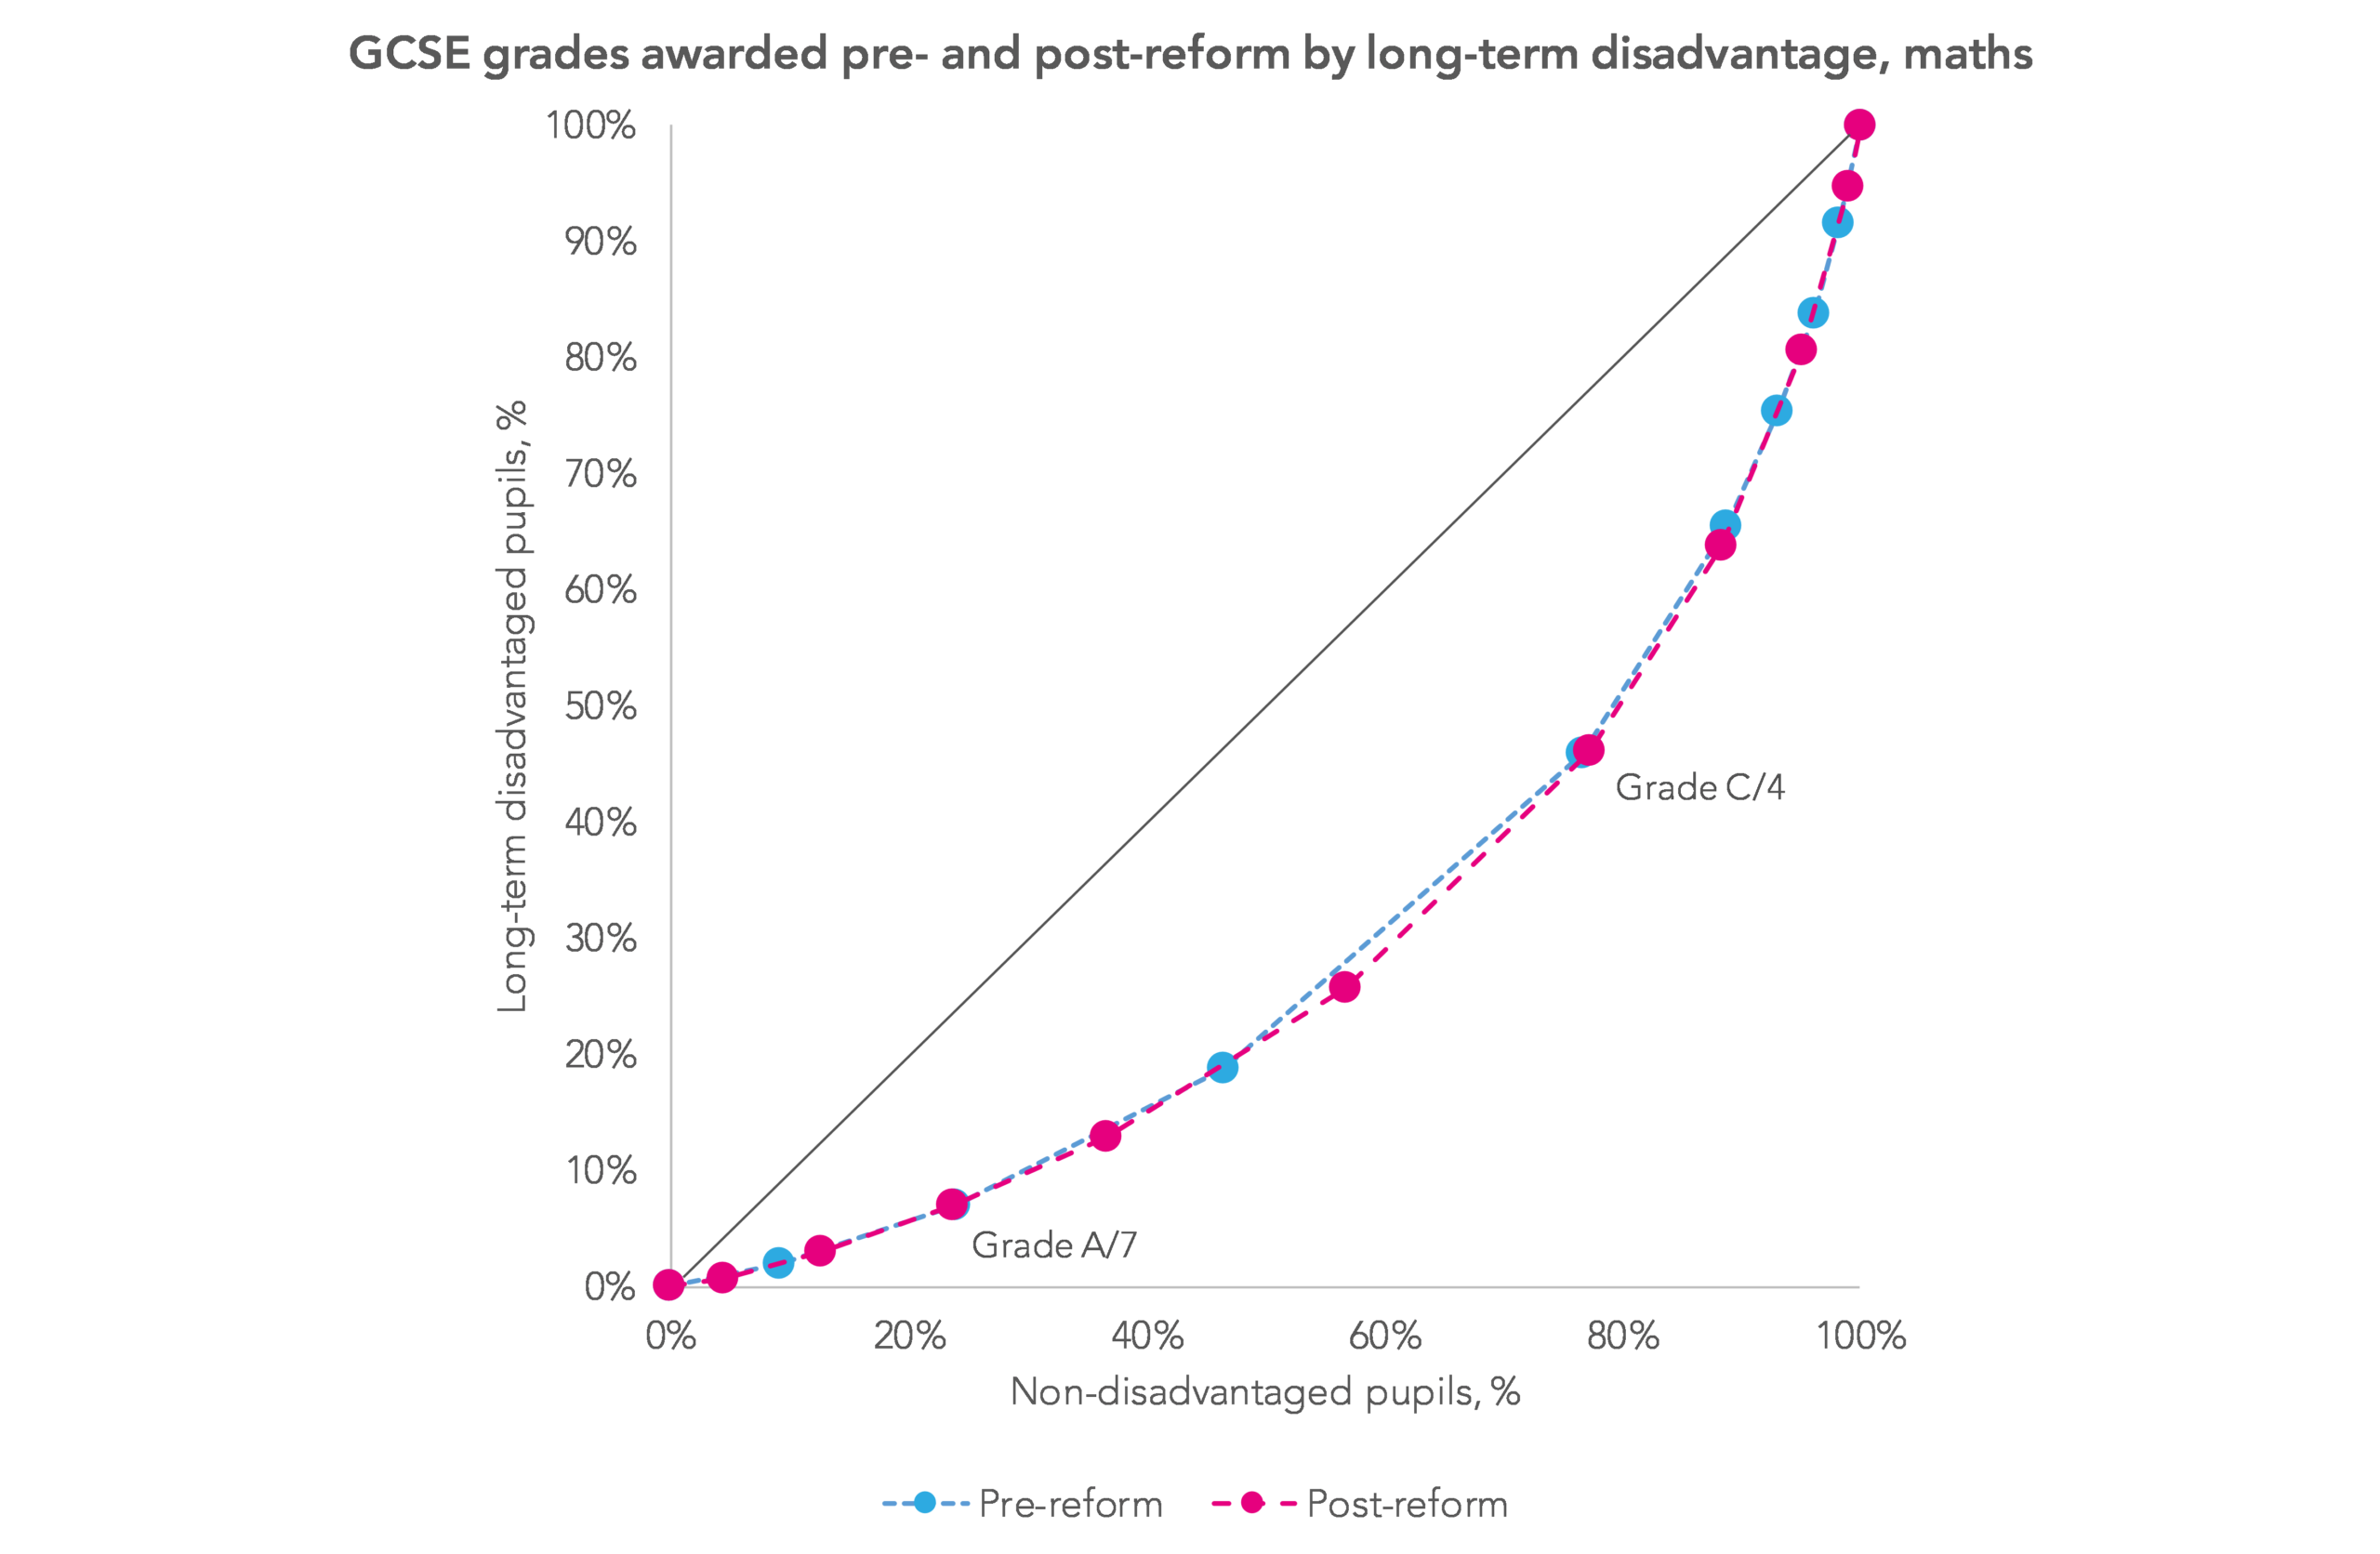
This is similar to that for all disadvantaged pupils, although the dashed lines are further away from the 45-degree line indicating a wider attainment gap. And the post-reform gap at grade 5 appears slightly more pronounced.
The gap in English language
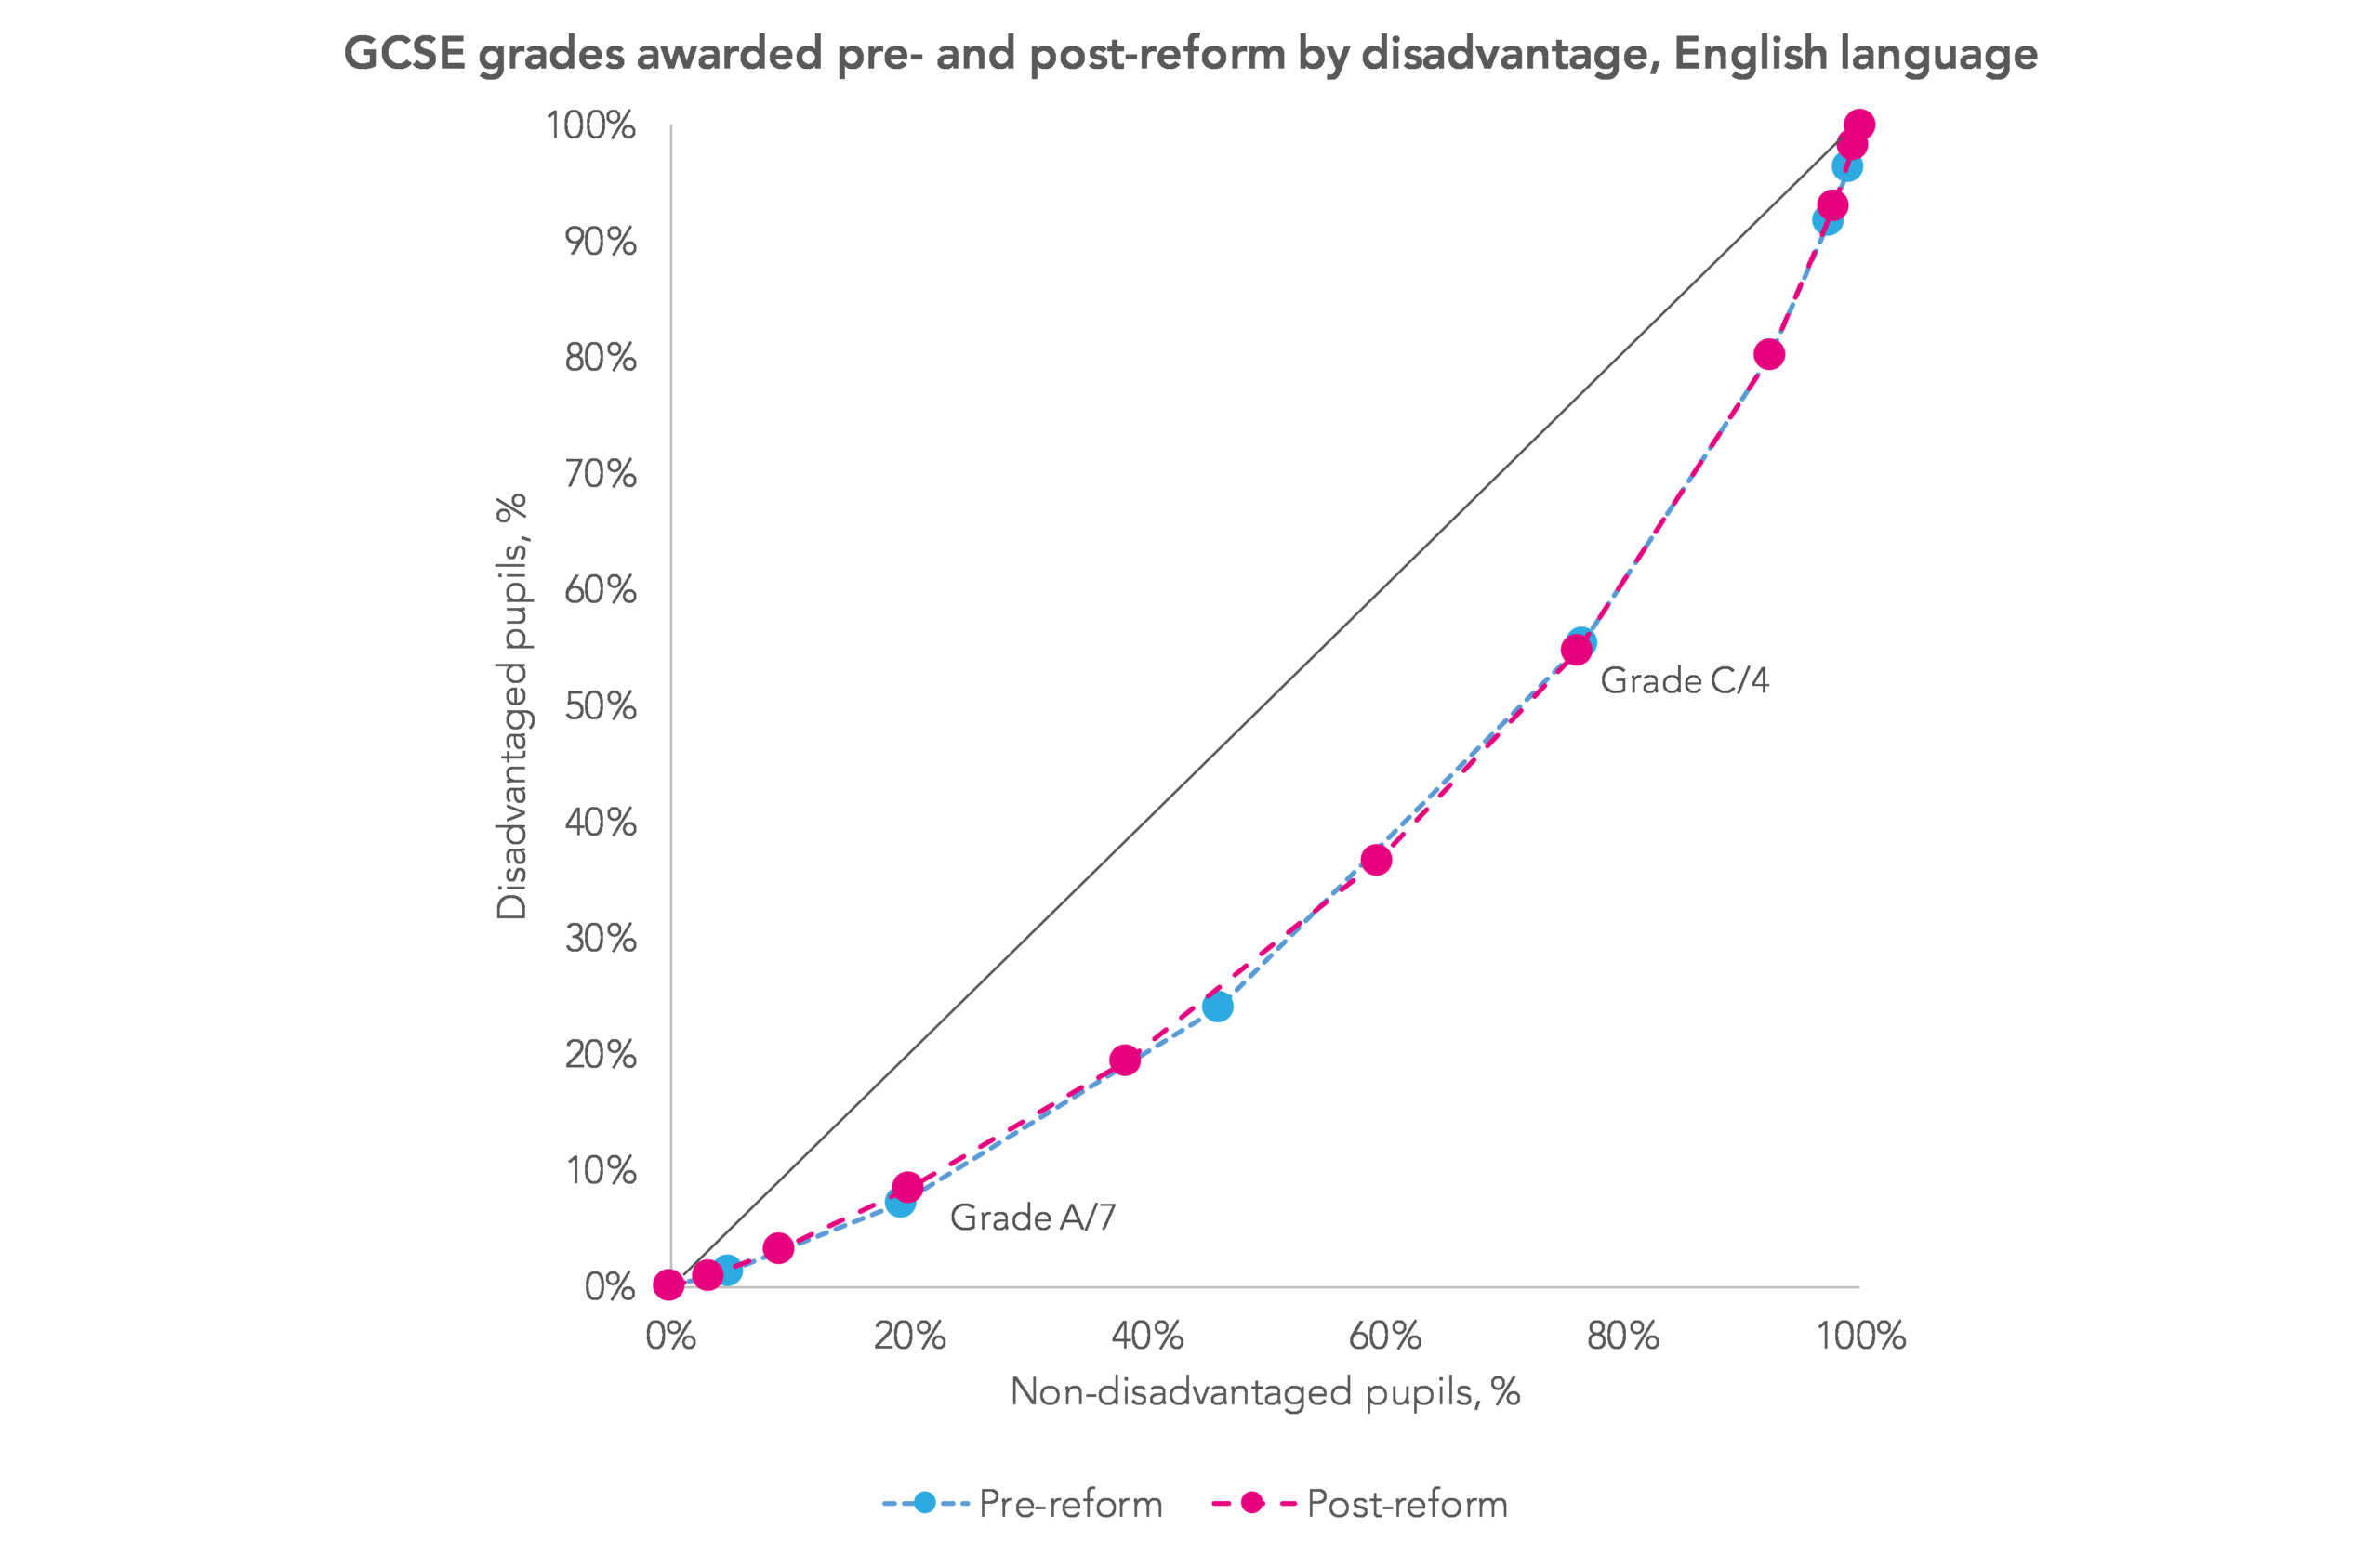
In our research we found that the attainment gap for disadvantaged pupils in English language narrowed very slightly with the introduction of the reformed, particularly at the top grades. The following inequality chart shows this.
The next chart shows that, as with maths, both the pre-reform and post-reform lines for English language are further away from the line of equality for the long-term disadvantaged than for all disadvantaged pupils. However, the difference between the pre-reform and post-reform line is similar. The gap widens slightly at grade 5 and narrows at the higher grades.
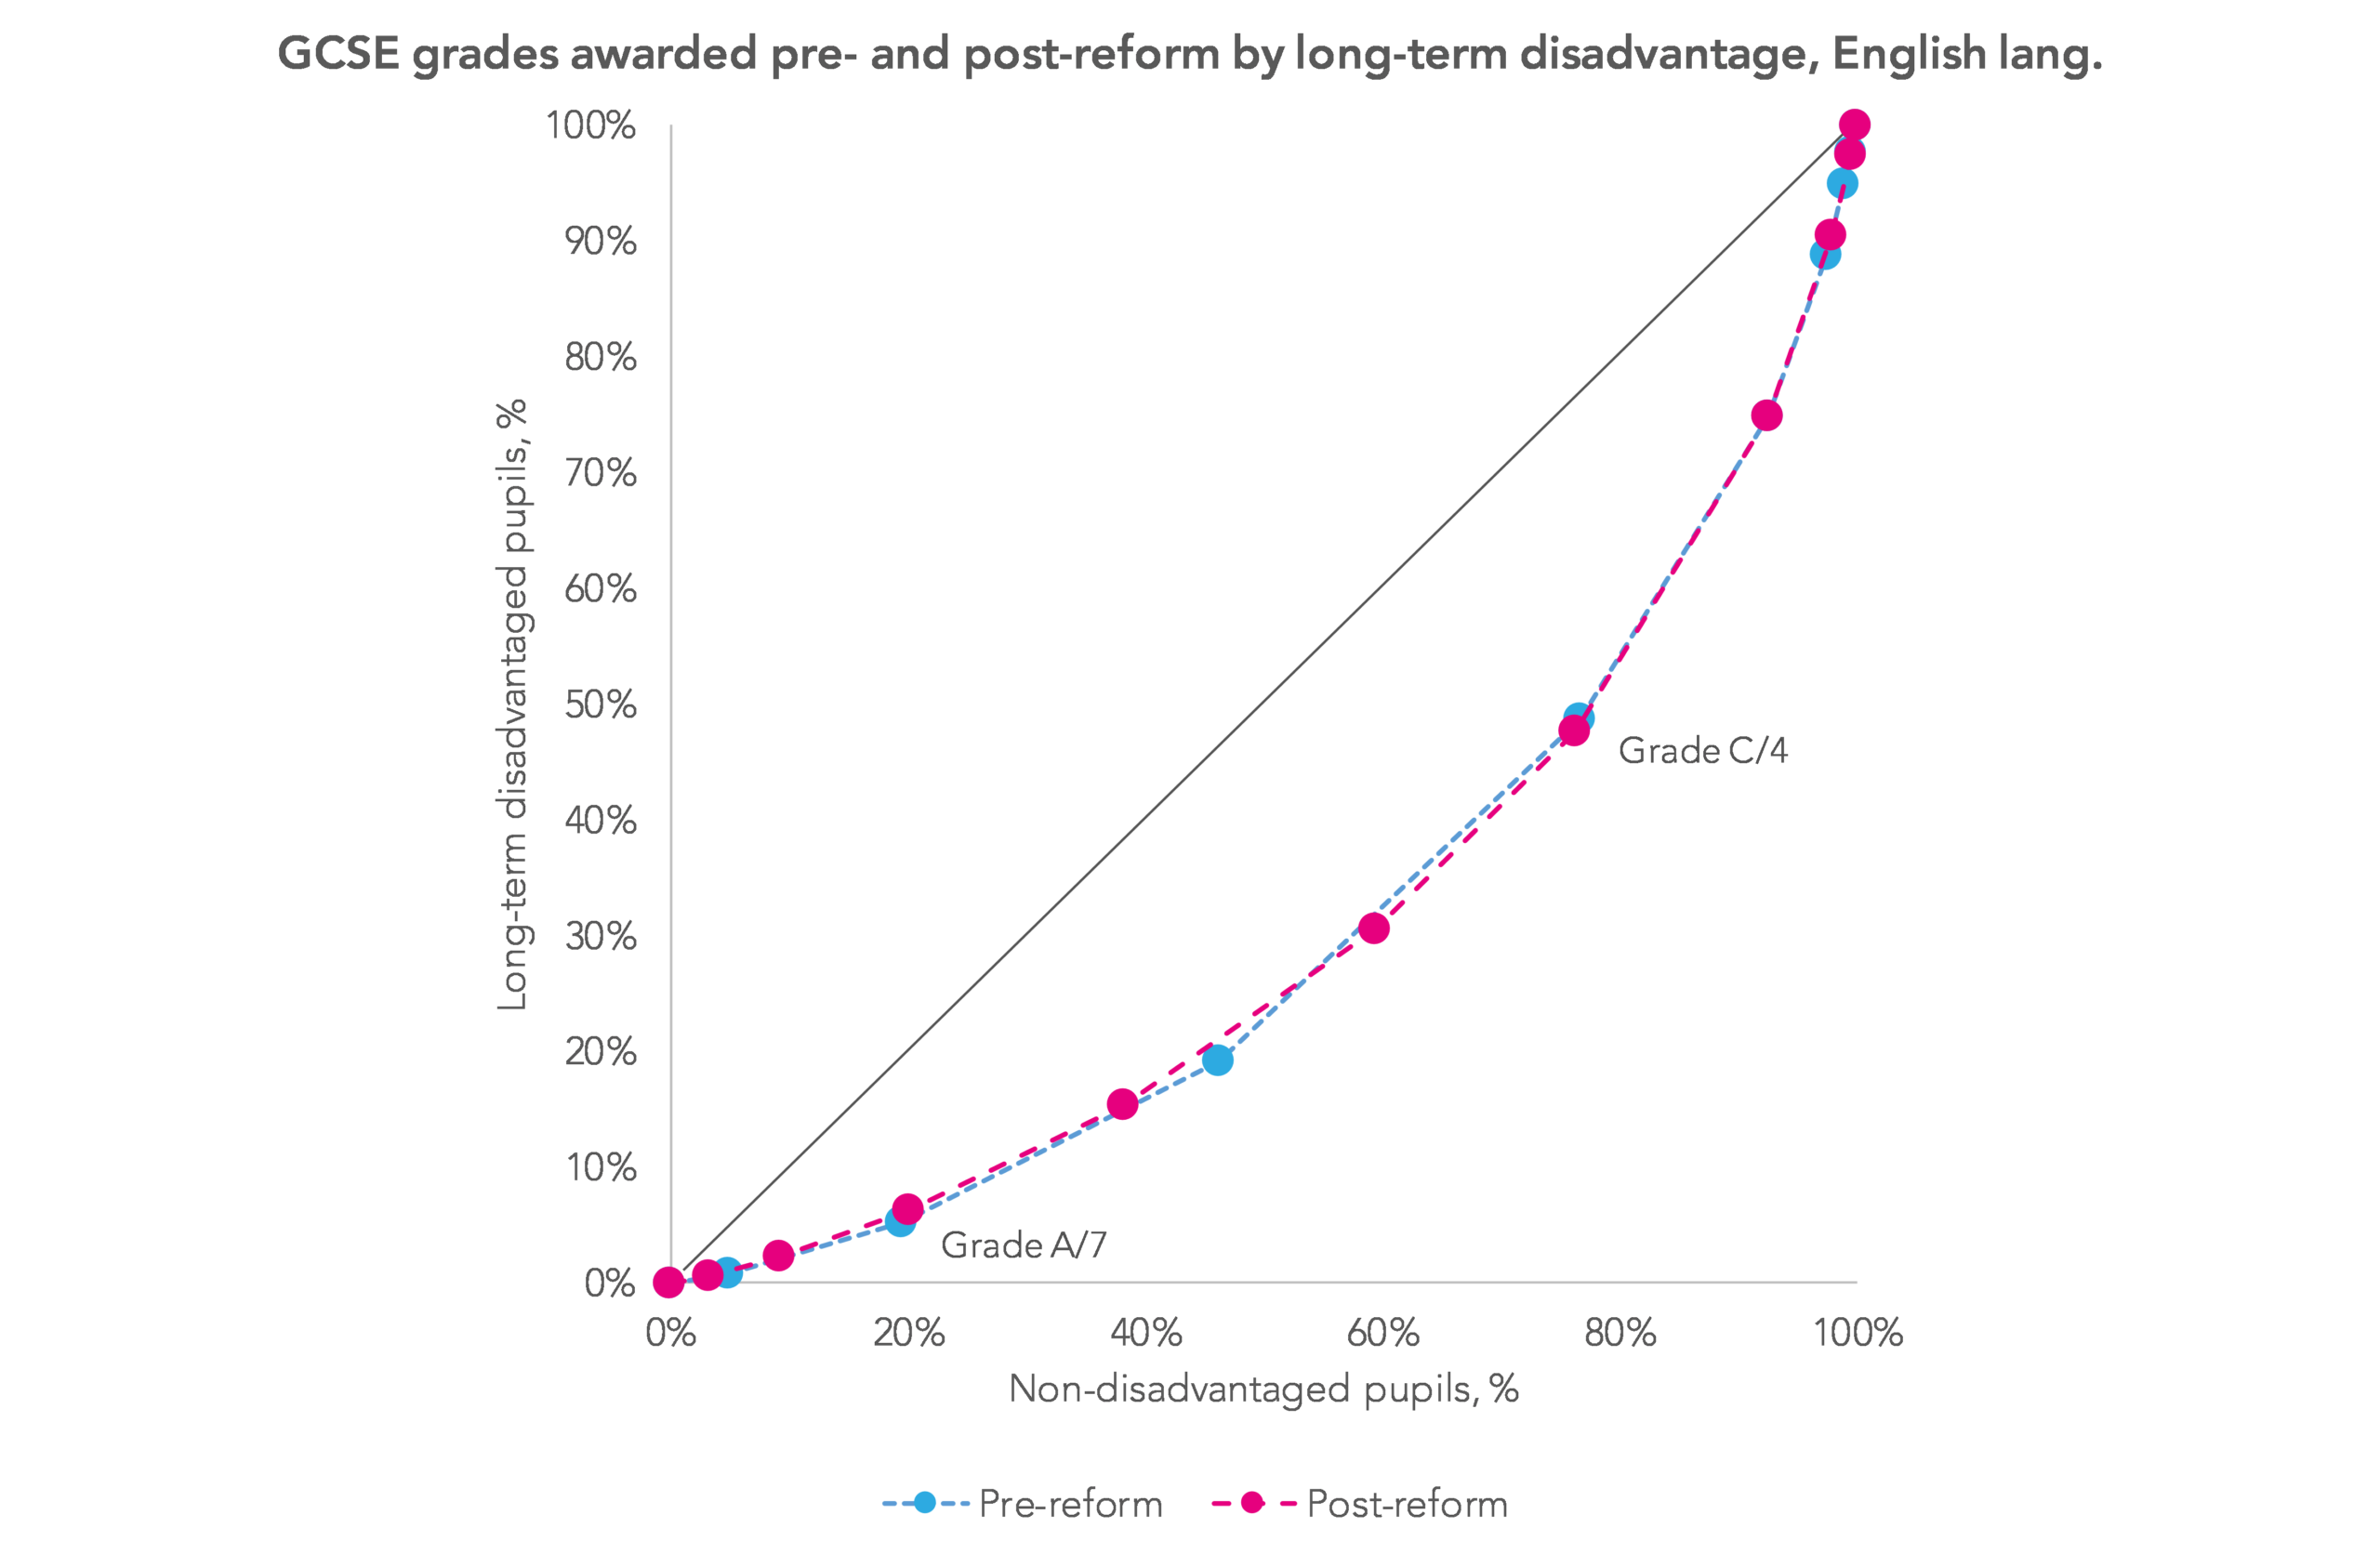
So overall, the effect of GCSE reforms on the attainment gap for long-term disadvantaged pupils in English and maths is similar to that for all disadvantaged pupils – albeit with a slightly greater worsening of the situation in maths.
Want to stay up-to-date with the latest research from FFT Education Datalab? Sign up to Datalab’s mailing list to get notifications about new blogposts, or to receive the team’s half-termly newsletter.


Leave A Comment