This year’s secondary school performance tables (‘league tables’) have been delayed a couple of weeks. To try and help pass the time, I’ve taken a look at whether, and by how much, attainment varies between schools.
As we’ve shown before, the performance of many secondary schools isn’t all that different, particularly when differences in pupil demographic characteristics are taken into account.
This is all rather inconvenient for policy interventions that aim to improve low-attaining schools. Because low-attaining pupils are not clustered together conveniently in particular schools these policy interventions can only slightly reduce differences in attainment between groups of pupils.
Should we be looking elsewhere?
Performance tables publish school averages. They don’t tell us anything about the variation in pupil performance within each school.
This wouldn’t be a problem if the performance of pupils within each school did not vary much: the school average would be a useful statistic and attainment would be improved by focusing on the low-attaining schools.
But this is not the case in practice.
Other researchers have found that schools account for only a relatively small percentage of the differences in pupil attainment. For instance, research last year found that 15% of the variance in 2015/16 Progress 8 scores was between schools, the remainder being within schools (in other words, between pupils).[1]
However, this research looked at an overall indicator of attainment – Progress 8 – derived from results in a number of subjects.
But what if we looked instead at all pupils’ results in each individual subject? How similar are they? And how much variation in schools is between departments? Or between classes?
Exploring the variation between schools
To answer these questions we’ll look at the pupils who reached the end of Key Stage 4 in state-funded mainstream schools in England in 2018. On average, these pupils entered 8.5 qualifications.[2]
Grades in these qualifications have point scores for the purposes of calculating school performance indicators. Higher grades yield more points. Grades in non-GCSE qualifications are given notional GCSE equivalences – in other words, scored on the grade 9-1 scale.
Using a similar approach to that in the research mentioned above[3], we can break the differences we see between pupils’ KS4 point scores down into:
- differences between schools;
- differences between subjects;
- differences between pupils;
- differences within individual pupils’ results – that is, any remaining variation in the results that individual pupils get.
The chart below shows this breakdown.
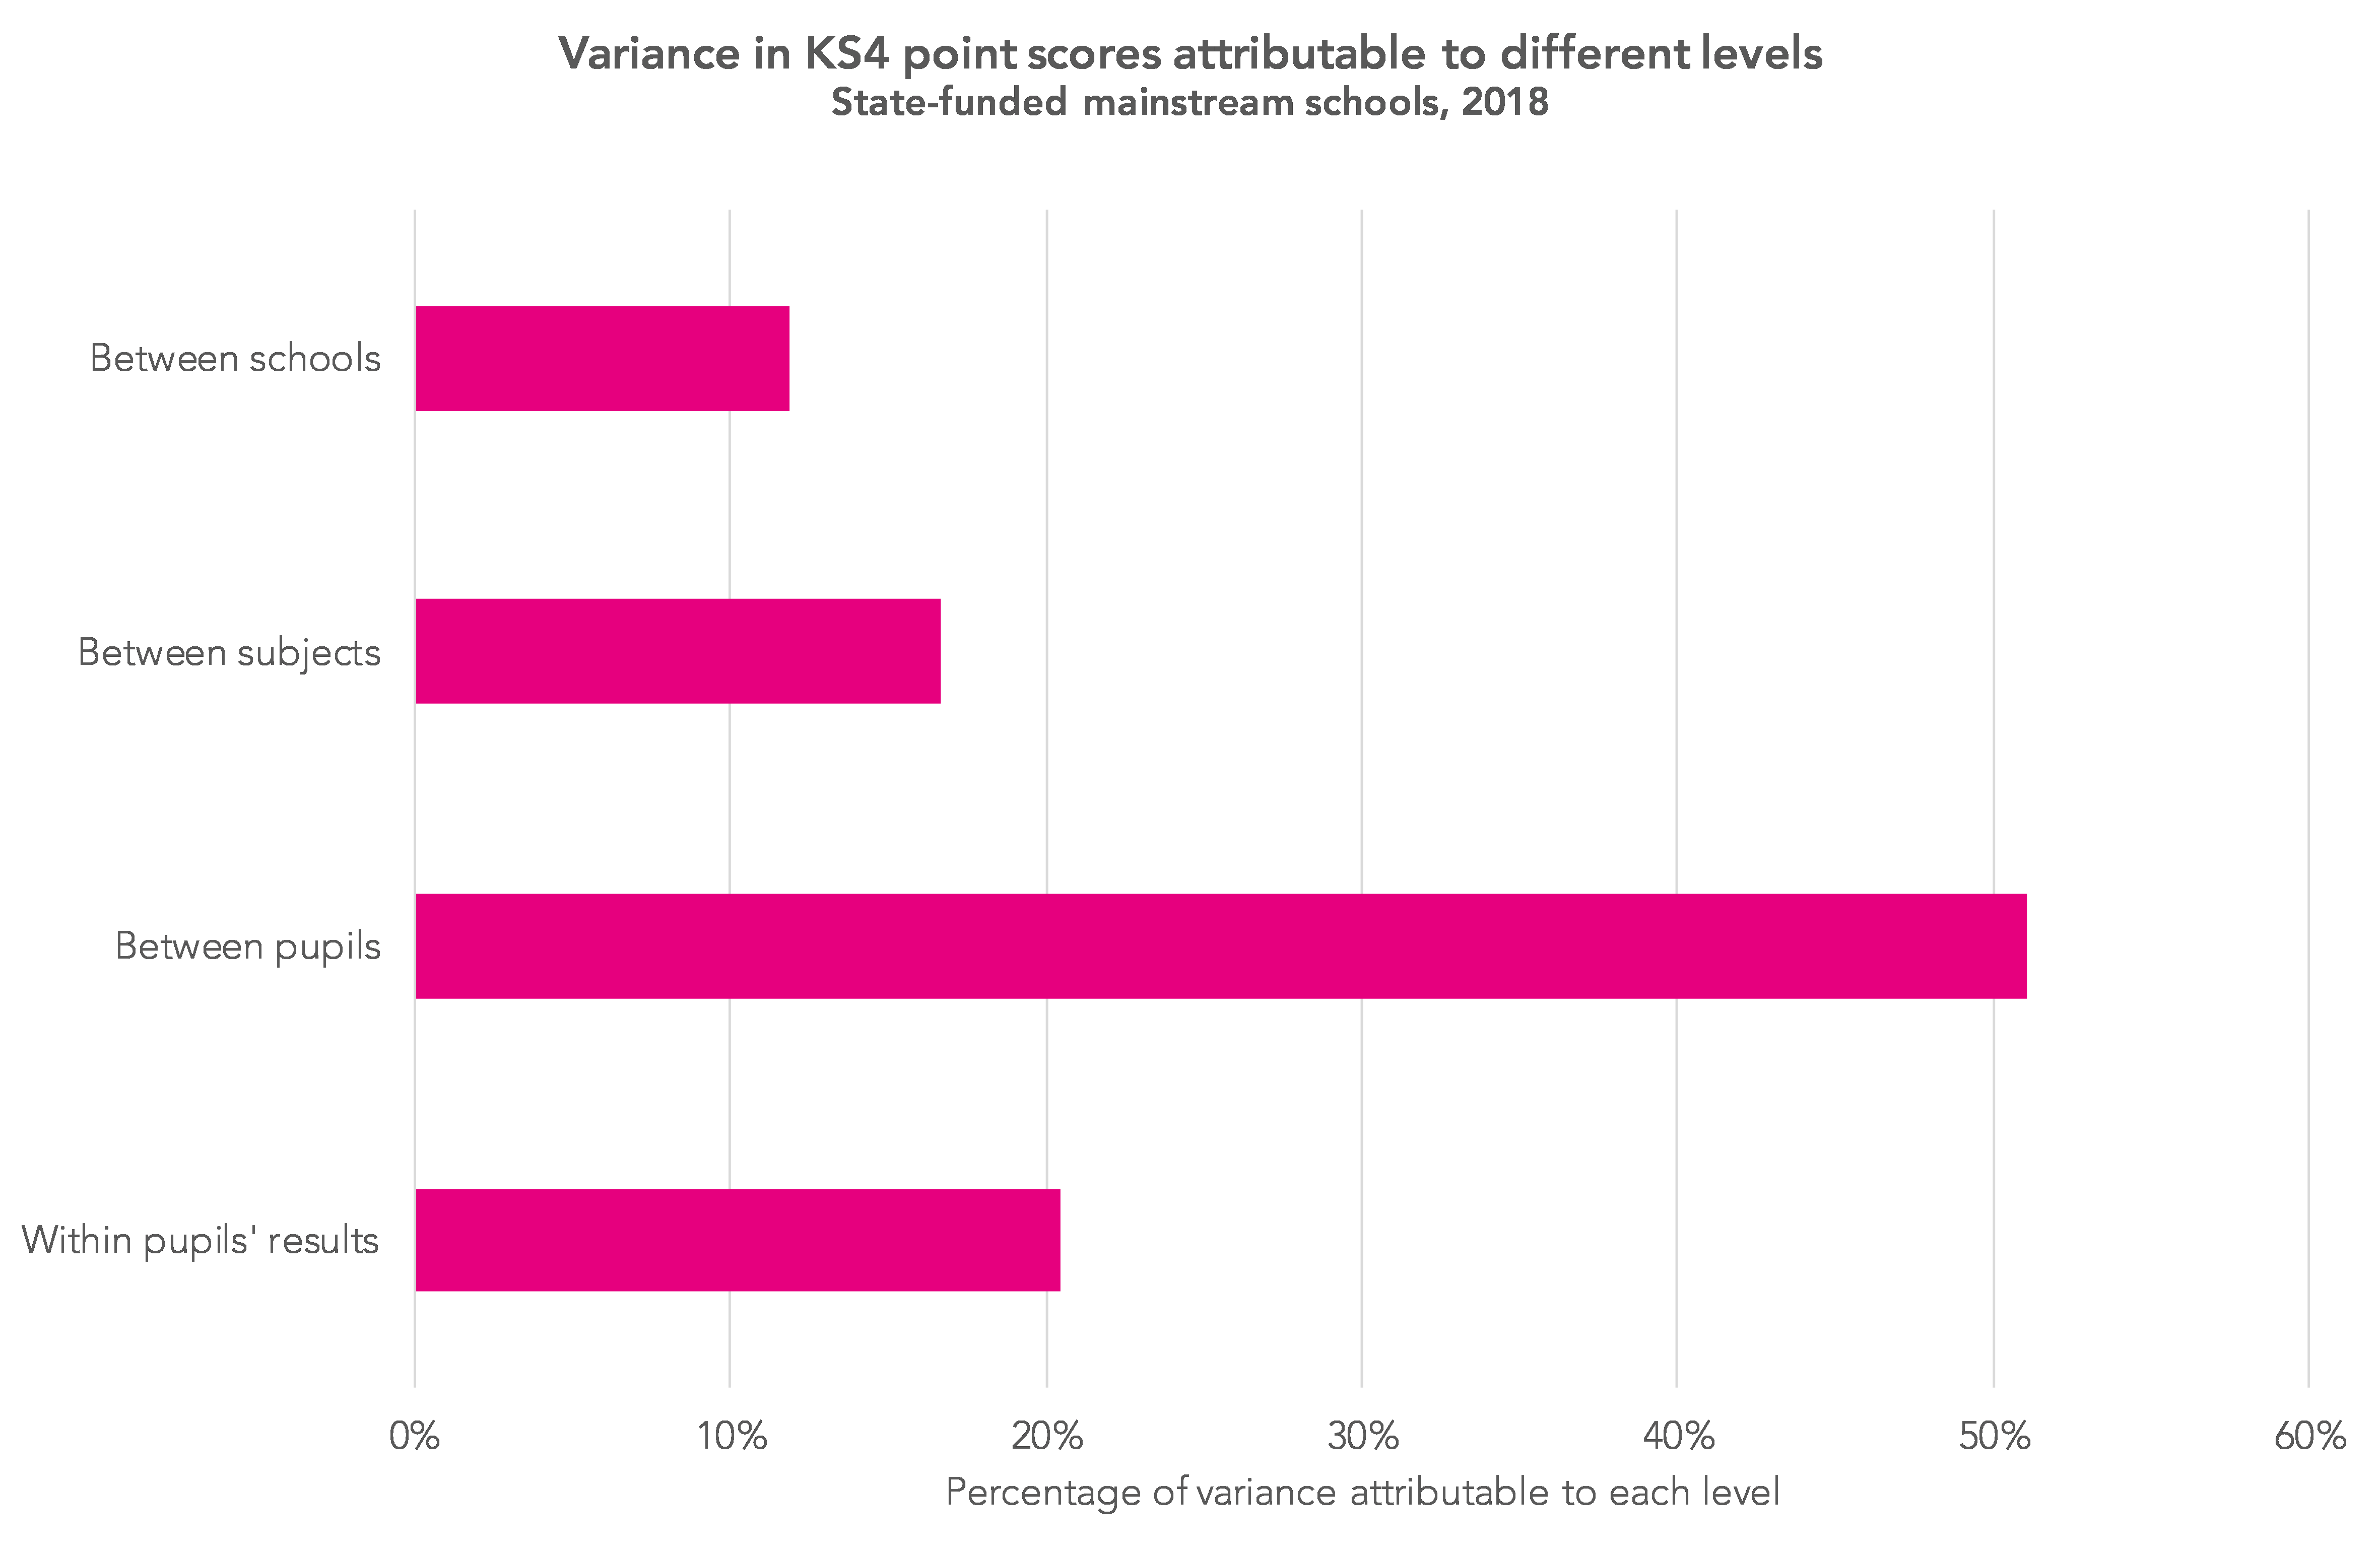
In total, 12% of the variance in pupils’ KS4 point scores is between schools. A further 17% is between subjects within schools. Over half (51%) is due to differences between pupils. The remaining 20% is due to differences within individual pupils’ results. In other words, due to pupils achieving different grades in different subjects.
I should say that this sort of analysis assumes perfect measurement, which we know is not the case. Some of the remaining 20% may well be attributable to one of the other levels.
If we remove the effects of Key Stage 2 prior attainment, though, the picture changes somewhat – see the chart below.[4]

The amount of variance in pupils’ results between schools reduces to 5%, largely because most of the variance is due to selection into grammar schools. In an ideal world, there would be zero (or close to zero) variation between schools once differences in intake had been controlled for as this would mean that, on average, schools would be achieving the same results given their intake.
The amount of variation the difference in KS4 attainment explained by differences between subjects within individual schools increases from 17% to 26%. (We’ve shown before that reducing this within-school variation would have far more effect on attainment than moving schools with a Progress 8 score below -0.5 to just above that score.)
Finally, and obviously, there is less variation between pupils as a result of controlling for prior attainment. And amount of variation within individual pupils’ results – that is, between the qualifications that an individual pupil takes – now accounts for a greater percentage of the variation in point scores.
Accounting for grading severity
We’ve seen previously that some qualifications tend to be graded more (or less) severely than others, though. We want to avoid this affecting results, so we can repeat the analysis using alternative point scores adjusted to account for variation in grading severity between subjects – see the charts below.


The results are broadly similar to those seen above, although there is much less variation between subjects – as we’d probably expect – and slightly more variation between schools and between pupils.
Nonetheless, there is still more variation between subjects within schools than between different schools after we’ve taken prior attainment at KS2 into account.
Implications
What implications does this have for policymakers?
Looking at the final chart shown above – where more of the difference in attainment is explained by each of the factors below school-level – this would suggest that policies to:
- improve poorly performing departments (‘between subject’ difference),
- help low-attaining pupils in all schools (‘between pupil’ difference),
- or even do more to boost subjects in which pupils seem to be struggling compared to their other subjects (‘within pupil’ difference)
would all be more effective at improving attainment than focusing efforts on whole schools.
Want to stay up-to-date with the latest research from FFT Education Datalab? Sign up to Datalab’s mailing list to get notifications about new blogposts, or to receive the team’s half-termly newsletter.
1. Not only that, but this fell to around 9% when the makeup of schools in areas such as gender, ethnicity and disadvantage were taken into account.
2. We need to focus just on those with Key Stage 2 results, giving 478,000 pupils in total. I’ve only included qualifications eligible for performance tables at least equivalent in size to a GCSE. This excludes free standing maths qualifications and graded music and drama.
3. I use a three-level multilevel model with the following nested structure: Schools | Pupils*Subjects | Results. In other words, results are nested within a cross-classification of pupils and subjects which is nested within schools.
4. Rather than portioning the total variance (as in the first chart), here we are partitioning the residual variance having controlled for prior attainment.

Revealing, thank you. Interesting that when you adjust for grading severity, the relative size of attibutable variance of ‘within-pupils’-results’ and ‘between-subjects’ rises signficantly, from near parity to almost 3 times as much. I’m reading this as ‘pupils do worse in some subjects than others, but this is typically different subjects for different pupils. This is less an effect of some departments (/subjects) relatively underperforming, rather different pupils find – for them – particular subjects more challenging’ – is that fair?
Hi Matt. Many thanks. Yes, I think that would be fair. There’s also the issue of measurement error- pupils may get lower (or higher) grades in some subjects than others and this may result in the variance being misallocated to the ‘within-pupil’ bars. I’ve added a line to the blog to say this.
Dave
You will find this GL Assessment Report to be relevant to your research and findings
https://lesacreduprintemps19.files.wordpress.com/2012/,02/glassessment.pdf
GL Assessment no longer publish such data, I suspect for commercial reasons as they seek to deny that their CATs are a form of IQ test – too controversial. See especially the ethnic and FSM data on P10
However table 2 on p7 is highly relevant to this article.
Note the very high correlations between the mean CATs score and total GCSE score (0.70) and ‘best 8’ score (0.72) for individual students.
My own work shows that mean intake school CATs scores correlate with mean school GCSE performance even more strongly (0.85).
Despite these GL Assessment data being dated (2010) and the subsequent changes in DfE performance measures, it is very clear that variations in pupil cognitive completely swamp assumed variations in school effectiveness in relation to school performance table ratings.
This is hugely significant in terms of the entire statistical validity of the DfE school marketisation policy in which parents are advised by the government to choose schools on the basis of DfE school performance tables.
It also follows that schools should concentrate on raising the cognitive ability/IQ of all pupils rather than knowledge cramming for GCSE.
This definitive paper by Michael Shayer provides solid evidence for this.
http://www.education.uwa.edu.au/tsa/__data/assets/pdf_file/0014/1025150/1999_CASE_evaluation.pdf
Hi Roger. Thank you. I certainly agree that a large part of the differences we see in school performance measures are due to variations in intake. Incidentally, the correlations between KS2 and KS4 (both at pupil-level and school-level) are very similar to the correlations between CAT and KS4.
Do you know which subjects are the most variable? Is it something intrinsic to particular subjects or is a general phenomenon? Can you correlate across the between subject and within pupil datasets?
Tricky. Might have to think about it a bit more. Some of the variation may be due to the way pupils select/ are selected into some subjects (e.g. higher attaining pupils taking the triple sciences) and this will vary between schools too.