The TES reported today that Ofqual has identified that some types of school have been more ‘optimistic’ with this year’s GCSE and A-Level centre assessment grades, but that it would not say which.
We collected some preliminary GCSE centre assessment grades from schools back in May. In one of our three blogposts we wrote on the data, we looked at centre variability in each subject. In other words, the extent to which schools’ results change from one year to the next.
In this blogpost, we’ll look at overall centre variability, defined as the change in average point score in GCSEs. Is there any evidence that some types of schools were more optimistic?
Comparing results from year to year
As before, there are limitations. We are working with a subset of around 1,900 secondary schools and we don’t have any information on independent schools. The grades were also preliminary. Some schools may well have made further changes before submitting to the awarding bodies.
We’ll start by using published 2018 and 2019 examination-level data to calculate the GCSE average point score (APS) in all subjects for a school. To ensure a like-for-like comparison, we’ll restrict subjects to those which had been reformed by 2018.[1]
Let’s first take a look at what happened to this measure between 2018 and 2019. The chart below shows schools’ 2018 APS, and the change in their APS between 2018 and 2019.
On the whole, there is a spread, with some schools’ results falling and others’ increasing – generally by between -1.0 and +1.0 points. There was less variation among schools with high results.[2] The correlation between the two measures displayed is very slightly negative (-0.2). As we wrote here, schools with low results one year are more likely to improve the next.
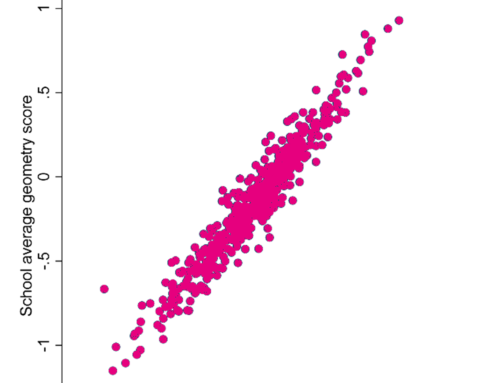
Now let’s look at the change in APS between 2019’s actual results and 2020’s proposed results – shown on the next chart.

Clearly, there are far fewer schools reporting lower results in 2020 than 2019 (those plotted below the horizontal axis). But the correlation between the values plotted has increased in magnitude to -0.4. In other words, lower-attaining schools were more likely to report very large increases in results. There were 44 schools that reported increases in their APS of more than +1.0.
But do we see much difference between different types of school? The table below would suggest, on average and for state-funded mainstream schools at least, not really. Studio schools and UTCs tended to report the largest rises but there are relatively few of these schools and numbers of pupils tend to be small.
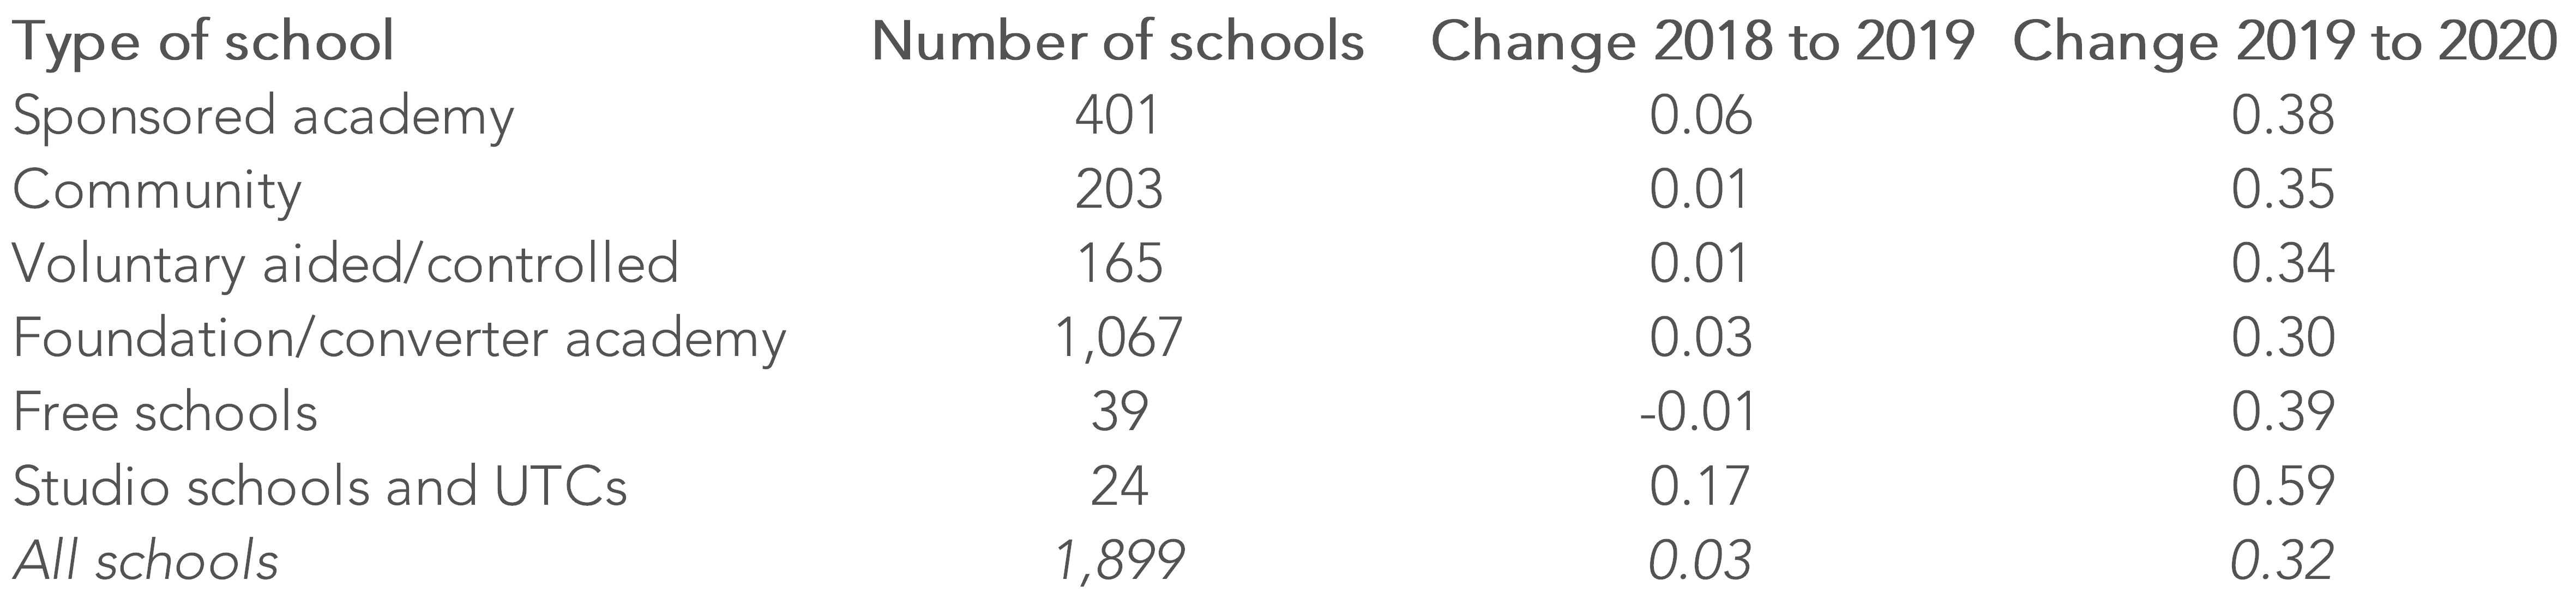
However, this is only a quick analysis. Ofqual would have had more data available to it (including data from independent schools) and undoubtedly will have been able to undertake a more detailed analysis given the time and resources available to it.
Concluding thoughts
If the grades schools submitted to the awarding bodies are anything like those they sent us then it looks like lower attaining schools tended to submit more optimistic results.
We would expect lower attaining schools to improve the most as a group, but what Ofqual’s statistical moderation process is unlikely to have been able to detect is which of those would have improved, and which would not, had exams been in place.
Want to stay up-to-date with the latest research from FFT Education Datalab? Sign up to Datalab’s mailing list to get notifications about new blogposts, or to receive the team’s half-termly newsletter.
1. We only include schools with three years of data and remove schools where the average number of centre assessment grades per pupil was less than five. In total, we use 1,899 schools in our analysis.
The subjects included art and design, art and design (photo), biology, chemistry, citizenship, computing, food and nutrition, dance, drama, English language, English literature, French, geography, German, Greek, history, Latin, mathematics, music, physical education/sport studies, physics, religious studies, combined science and Spanish.
2. These are mostly, but not exclusively, grammar schools.

At a glance the results in Scotland were allowed to be a lot more generous than I was expecting. I would describe some of those % rises as huge. Are we expecting something similar for England?
Hi Andrew, Ofqua has said that we can expect GCSE results to be up something like 1 percentage point at grade 4 and above (and 2 percentage points at A-Level grade A and above) overall – see this blogpost from them: https://ofqual.blog.gov.uk/2020/07/24/reflections-on-the-summer-symposium/
So what does this exactly mean is it going to be negative or positive
This could be attributed to regression towards the mean, rather than any real effect
Hi Andrew. Under “business-as-usual” circumstances, yes, I would agree. We would see lower-attaining schools tending to improve and higher attaining schools tending to decline as the first chart shows. But this year, as the second chart shows, we tend to see rises across the board (but more so among lower-attaining schools).
> it looks like lower attaining schools tended to submit more optimistic results.
This is exactly what you’d expect, just using statistical considerations. In a school where 90% of entries achieve A* or A there’s almost no scope for optimism: even if you predict A* for everyone, your predictions will be pretty close to last year’s grades.
In more detail: suppose that you took the actual mark M for each entry, and changed it to a random mark in the lower quartile of the range between M and 100%. If the mark was 40% then you’d pick a random mark between 40% and 55% (the first quartile of 40%-100%); if the mark was 80% you’d pick a random mark between 80% and 85%. It’s clear that the lower grades would be affected by this optimistic upgrade more than than higher grades. Changing 80% to 85% is probably just a move within the A* band, while changing 40% to 55% could be a move from a D to a B.
Just a point about the use of “school type” for analysis. It is really interesting, but there are lots of different ways of categorising schools, many of which, if used appropriately, would give a fair indication of the specific “challenges” which a school might face (eg prior attainment of intake, profile of intake, socio-economic factors impacting school [coastal, rural etc], impact of academic selection on the school…). Have you plans to carry out any further analysis looking at some/all of these factors?
Hello Ian. Thanks for the comment. To be honest, I only looked at this because it came up in the news. As we’ve talked about before, any “school type” effects more or less disappear once you take account of all the other factors you suggest. All being well we’ll do some more on this in the next few weeks.