A-Level results come out on Thursday – the end point to a particularly odd academic year.
Here are four things to watch out for.
1. A slight rise in grades
All public exams were cancelled this year, meaning students will simply be allocated grades by their exam boards instead.
Schools and colleges in England had to submit proposed grades for each student at the start of June, as well as a rank ordering of their students in each subject.
The exam boards will then have worked out a grade for each student taking into account:
- the establishment’s results in that subject over the last three years;
- the prior attainment of the establishment’s current cohort, compared to the prior attainment of previous cohorts;
- the rank ordering of students mentioned above.
Where the grade which an exam board thinks should be awarded is in line with that proposed by the school or college the result will be confirmed; where it differs, the grade proposed by the establishment will be adjusted up or down.
At the end of July, the exams regulator, Ofqual, released figures that showed that, overall, schools and colleges had been optimistic in the grades they proposed – submitting a higher mix of grades than was awarded last year. The chart below shows how the two things differed.

As a result, Ofqual has said that there will be an overall adjustment down of the grades proposed by schools and colleges.
The regulator has, however, provisionally said that it will allow results to rise a little when compared with last year – it indicated that this could be a rise of two percentage points in the proportion of results awarded a grade A or above (with, presumably, an increase lower down the grade range too).
So, that’s the first thing we think we can anticipate on Thursday: slightly higher results overall.
2. Things might look quite different in low-entry subjects
Now things get interesting. The approach described above is how things will work in general. But a different approach will be followed where a school or college has only a small number of entries in a particular subject – where results would be too unpredictable to use the above method.
The TES reported last week that the grades proposed by teachers will be used for cohorts of five or fewer, and that a mix of proposed grades and Ofqual’s statistical approach will be used for slightly larger cohorts (up to 15 students).
So, given that we know that establishments’ proposed grades were higher than those awarded in previous years, are there certain subjects where a majority of entrants come from establishments with very small numbers of entrants? If there are, could we see results increase by a greater amount in those subject?
We can make a decent stab at answering the former question by looking at last year’s results.
The chart below shows the ten subjects that we estimate have the greatest share of entries coming from schools or colleges with five or fewer entries.[1] (We’ve excluded from our analysis subjects with very low entry numbers overall, such as modern foreign languages besides French, German and Spanish.)

There are three subjects – German, Latin and music – where we estimate that over half of the total number of entries come from establishments with five or fewer entries.
If we look instead at establishments with 15 or fewer entries – the upper limit for where proposed grades will having a bearing on the final grade awarded – we get the following picture.
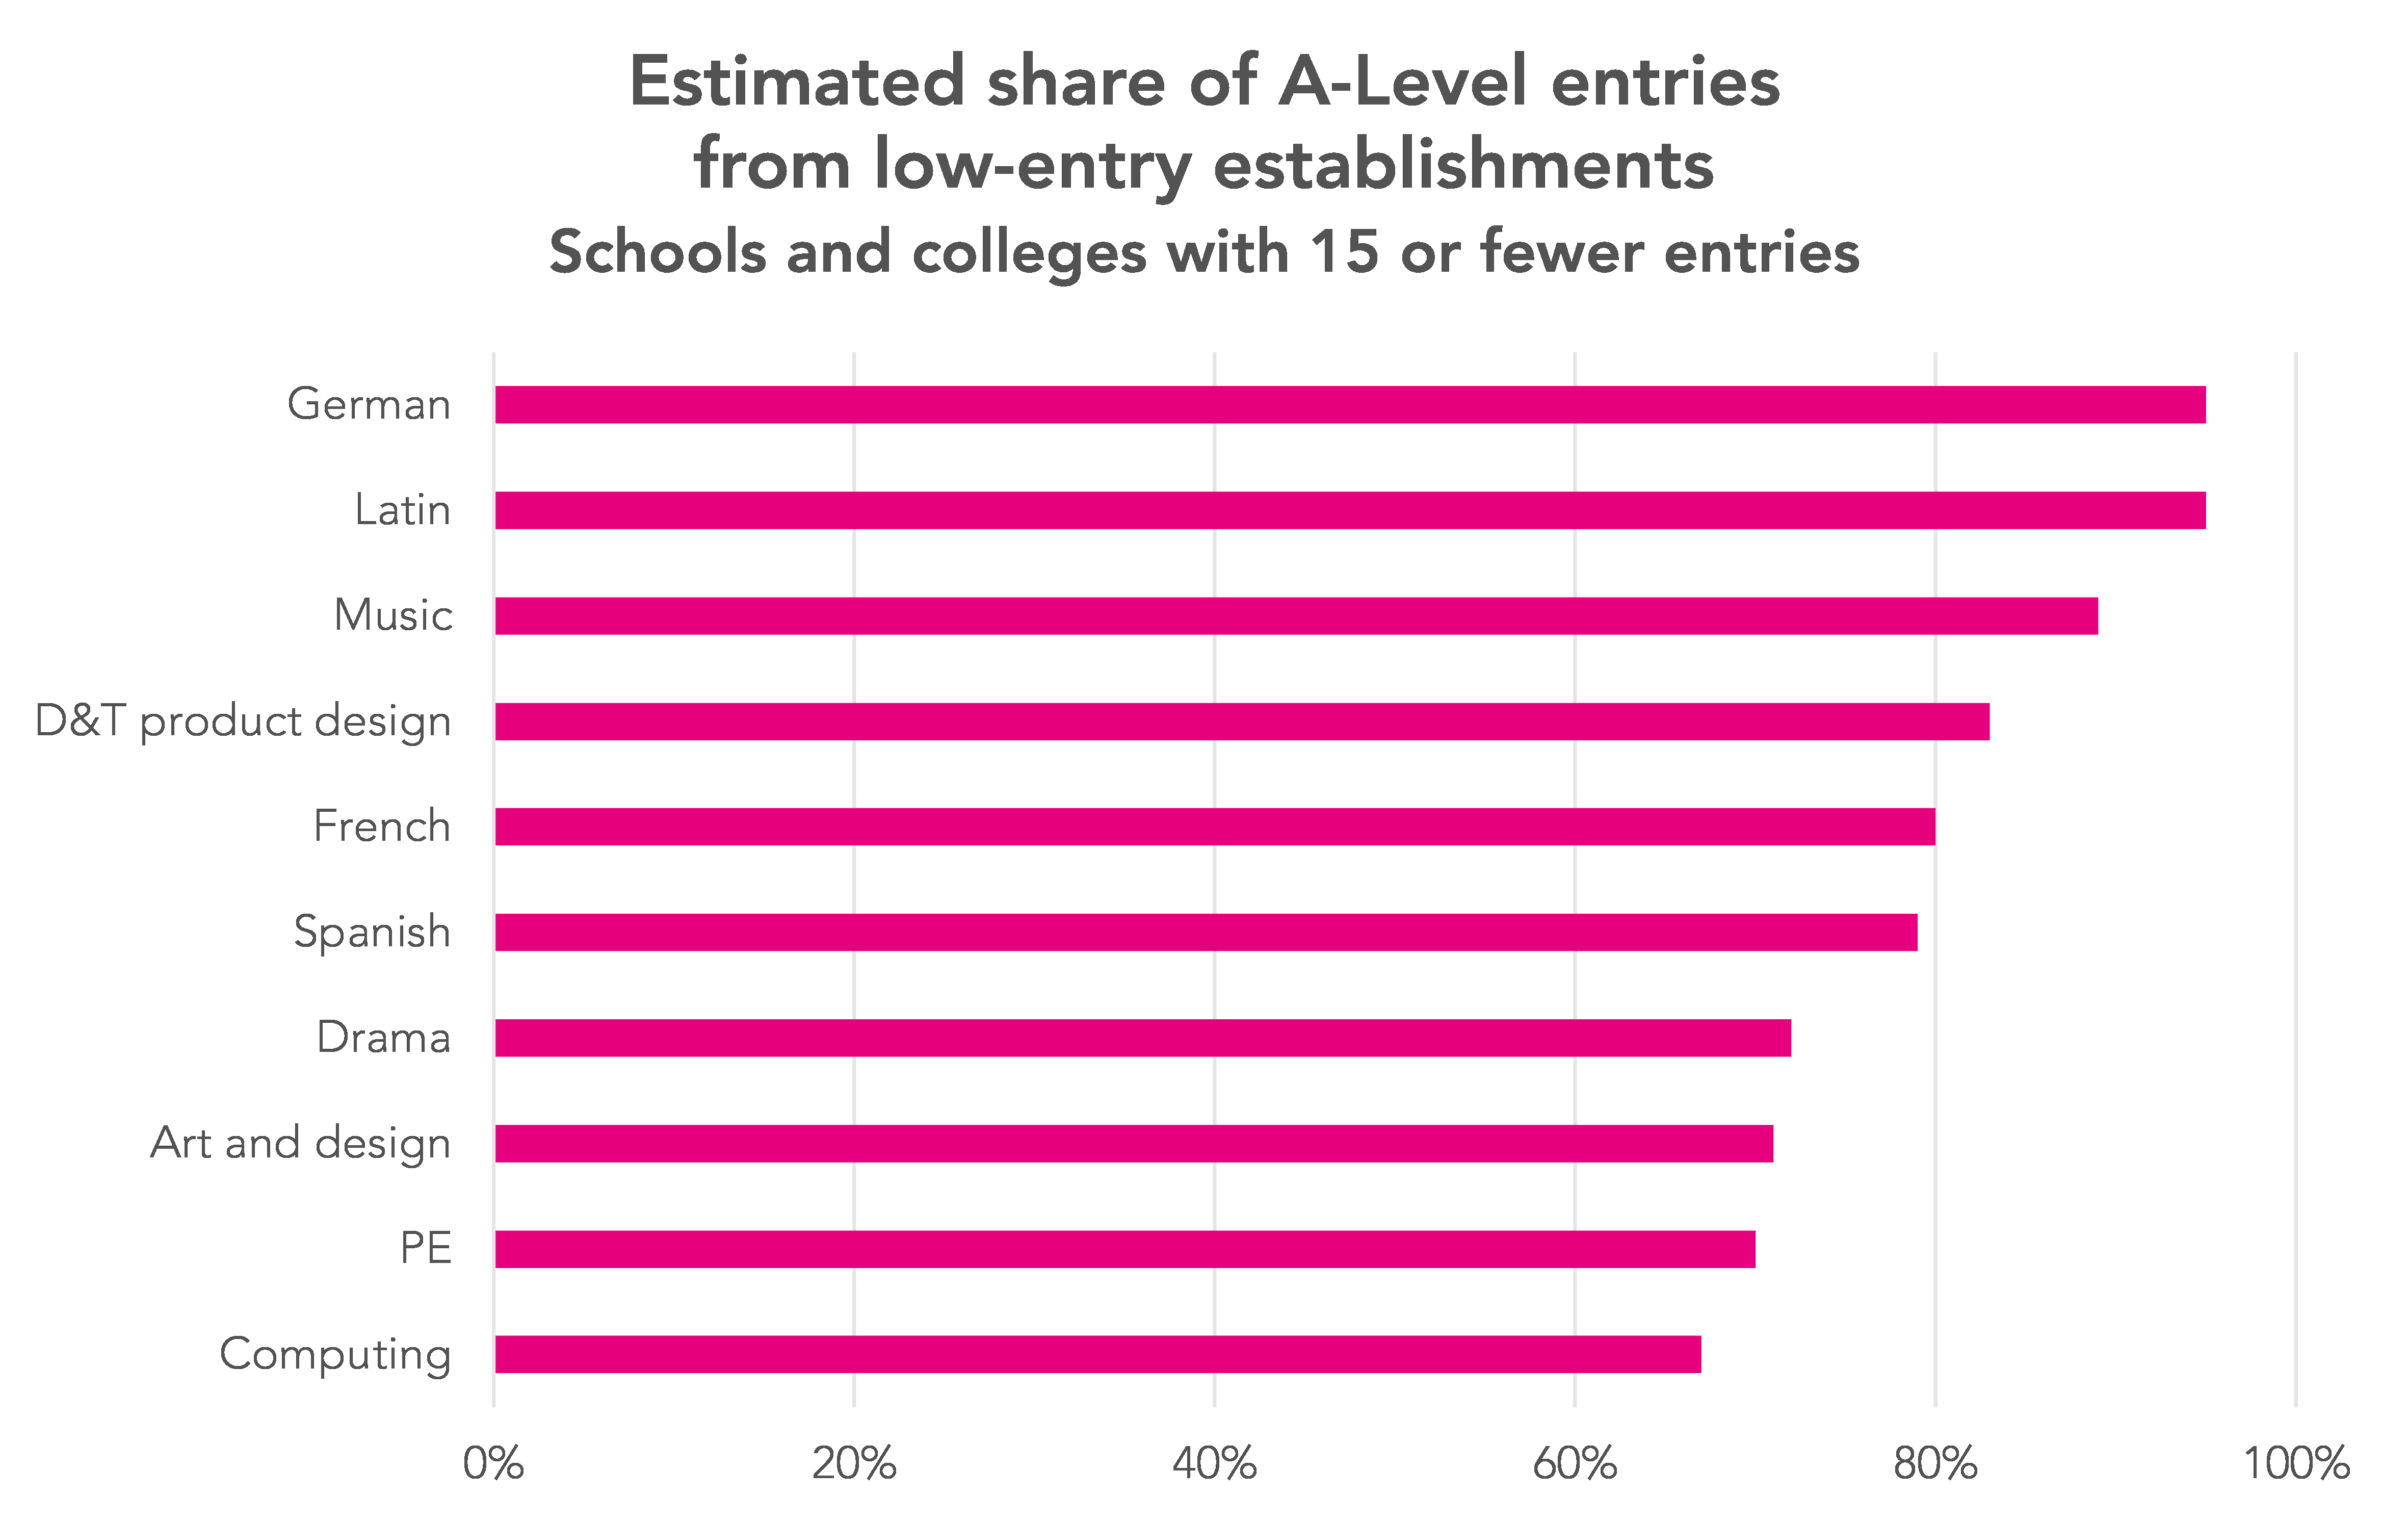
More than half of all entries come from establishments with 15 or fewer entries in a range of other subjects, including French, Spanish, art and design and computing.
So could we see results increase by more than two percentage points in these subjects?
We think that’s likely in German, Latin and music at least – and we’ll be keeping our eyes on the other subjects that we identify here on Thursday.
3. Entry numbers will be down in the sciences and a number of other high-profile subjects
Nearly all A-Level subjects are into at least their second year of being awarded in reformed form now, but despite that there look like there might be some interesting changes in entry numbers this year.
Based on preliminary data that Ofqual published in June, it looks like A-Level entry numbers in England will be:
- up in maths (by around +4%);
- up in English language and English literature (around +7%, and +2%, respectively);
- down in biology (-5%) and chemistry (-4%), broadly stable in physics (-2% – but against a backdrop of a fall of roughly 3% in the age 18 population), but up strongly in computing (+11%);
- down sharply in history (-13%), geography (-14%) and politics (-11%);
- up in Spanish (+3%), stable – but really up, when we take into account the fall in the 18-year-old population – in French (no real change), and down in German (-6%).
We’ll be adding this year’s data to our results microsite at 9.30 on Thursday, so bookmark that page and check whether entry numbers in these subjects and others come in as expected.
4. What we won’t learn
There are a number of things that we won’t learn on Thursday.
We always have to wait until well into the next academic year before breakdowns by student characteristics – by disadvantage and ethnicity, say – are available, and this year is unlikely to be any different.
It’s likely that Ofqual will publish some figures on the performance of different groups of students on Thursday, to offer reassurance that this year’s process hasn’t led to particular groups being penalised or advantaged. But we’d expect that to be in rather less detail rather than more.
And, while there’ll be plenty of coverage in the news about university admissions, it won’t be until well after Thursday that we start to get a true idea of the impact of this year’s results process.
1. We’ve come up with these estimates by studying establishment-level entry data from 2019. Our figures are estimates because entry patterns may have changed between 2019 and 2020, and because we’ve assumed an average of 2.5 entries for establishments for which entry numbers aren’t available due to suppression. This looks reasonable to us, based on triangulation with other data sources.


Very interesting, thank you.
It is clear (and understandable) that schools’ proposed results are elevated compared to historic results, so if all schools proposals are accepted for schools with entry numbers below 5, do you think that means that entries from schools with numbers above 5 will be correspondingly penalised, to make the averages more “normal”? Especially for those subjects you mention with above-average proportions of low entry establishments.
I have two Y13s, one whose A levels include French and Spanish and the other Further Maths (which you don’t mention, but which I presume has a higher than average number of small cohorts too). All of which were in classes above 5, but only slightly.
Hi Rachel, you’re correct in thinking that further maths is often small classes.
Your question about grading is a good one, and the honest answer is that we don’t know the full mechanics of how the grade-setting will work – we don’t have enough details from Ofqual at this stage. I’d be surprised if the results from >5 entry schools were brought down by a greater extent to keep overall results in line with last year though. I think that’s why grades will be permitted to rise a little this year – and why we think they could rise to a greater extent in subjects with lots of low-entry classes.
Hi, my son is in year 13. His Computer Science class has 7 students and his Further Maths class has 8 students. Am I correct in understanding from your article that this could potentially increase their grades?
Given today’s announcement about a triple lock throwing mock grades (potentially a very noisy random number) into the mix, how can we, as teachers plan for the best outcomes for our student in the future?
The promise to match AS results is a nonsense. The whole idea of the new AS is to downgrade it (to 40%) and because the exams are in May many centres won’t use it anyway. The proposal to match “mock” results is even more batshit crazy. As Simon says ‘a very noisy random number’. There are a lot of very highly paid individuals involved right now in proving that to get into top level in education policy and management you have to be a complete idiot.