This blogpost is part of FFT’s 2020 Secondary Results Service. Participating schools can now download their first GCSE Summary Analysis from the ‘Special reports’ area of FFT Aspire
As we wrote back in March, changes in schools’ GCSE results are predictably unpredictable. We know that each year, in each subject, some schools’ results will improve and some will fall, more often by smaller amounts than larger amounts.
But what we don’t know with any certainty, as the saga of Ofqual’s algorithm showed, is by how much any individual school’s results will change. While Ofqual tried to moderate centre assessment grades (CAGs) to account for changes in prior attainment, awarding grades to pupils via exams is itself an imprecise science. There’s more than a fair bit of chance involved.
Thinking about how much change we would expect to see in schools’ results can help us see the impact of this year’s arrangements for awarding GCSE grades.
Some of this will be familiar to readers who have followed our series on centre assessment grades over the summer, in particular this post where we looked into whether some schools’ CAGs were more optimistic than others.
This time, we’re going to use the confirmed GCSE results of 1,700 schools that have been good enough to share them with us as part of this year’s FFT Secondary Results Service. These grades are the highest of a) submitted CAGs, and b) Ofqual’s calculated grades.
Overall variability
To begin with, let’s think about what might have happened in 2020 had exams gone ahead.
To help do so, we can look at the change in results between 2018 and 2019 in state-funded mainstream schools.[1] We’ll focus on an overall measure of attainment, the GCSE average point score, in reformed (9-1) GCSEs. We’ll only include subjects for which 9-1 grades were awarded in 2018.[2]
Below is a histogram of the school-level changes – together with one showing looking changes between 2019 and 2020.
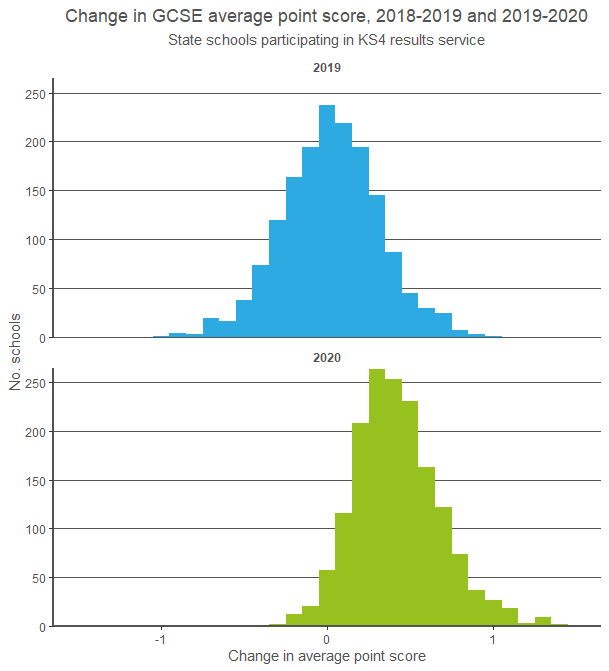
These charts are similar to Ofqual’s centre variability charts and show that changes in schools’ results are (approximately) normally-distributed (‘bell-shaped’) with a peak around zero (no change) and small proportions of schools with very large changes, either negative or positive.
Broadly speaking, from 2018 to 2019 there was a balance in terms of improving and falling results among schools. No schools improved (or declined) by more than a whole grade per entry. And just 78 improved by more than half a grade.
The picture for 2020 was very different. In summary:
- Just 55 schools recorded a lower score than in 2019;
- 573 schools recorded an increase of 0.5 points – half a grade per entry – or more;
- 45 schools recorded an increase of 1 point or more – equivalent to a whole grade per entry;
The net result is that the 2020 distribution has shifted to the right. It is also noticeable that it is somewhat narrower. Schools are more tightly bunched around the average (0.4 or 40% of a grade). As we showed here, lower-attaining schools were more likely to report larger increases in results, although some of this would have been expected due to regression to the mean.
Subject variability
We can also look at the change in results in each subject.
The charts below show the change in attainment in different subjects at different thresholds, and follows the same format as Ofqual’s centre variability charts.
We’re taking all Key Stage 4 subjects as our starting point here, not just those that had been reformed by 2018. Like Ofqual, our analysis is restricted to schools with more than 25 entries in a subject, and to subjects with 100 such schools entering them.
Ofqual’s centre variability charts tend to show a fairly symmetrical distribution around zero, with similar numbers of schools recording increases in a given subject as numbers recording decreases.
Ours, by contrast, are skewed to the right to a greater or lesser extent, with more extreme values (increases of 75 percentage points in attainment at a given threshold, in some cases). Most schools improved in most subjects. In some subjects, such as computer science, increases tended to be more substantial. Relatively few schools achieved lower results in English language.
We’ve also looked at a couple of large-entry BTECs – shown on a chart below.
School-level changes in these two BTECs, in sport and health and social care, look poles apart – one is quite balanced in terms of those with higher and lower results, the other is far from balanced. However, we may not have final BTEC data for some pupils after hold-ups in the results being issued, so we’ll look at this again later in the year.
Conclusion
Clearly this year’s GCSE results were higher than last year’s, but this work shows that the picture varies considerably between schools and between subjects.
When we talk about things at a very high level, as we are doing here, it’s important that we keep in mind that the main role that GCSEs play is in matching young people to post-16 opportunities, be they more full-time education, training or employment.
So once the dust has finished settling on this summer’s results fiasco, that is where we should direct our attention: to asking what effect this year’s GCSE grades seem to have had, for better or worse, on pupils’ subsequent paths.
Want to stay up-to-date with the latest research from FFT Education Datalab? Sign up to Datalab’s mailing list to get notifications about new blogposts, or to receive the team’s half-termly newsletter.
1. We don’t include pupil referral units or special schools. We also don’t include schools for which we don’t have three years of GCSE results, and small schools (those with fewer than 150 entries in total in all reformed GCSEs). This reduces our sample from 1,700 schools to around 1,620.
2. The subjects included are art and design, art and design (photography), biology, chemistry, citizenship, computing, food and nutrition, dance, drama, English language, English literature, French, geography, German, Greek, history, Latin, mathematics, music, physical education/sport studies, physics, religious studies, combined science and Spanish.


One of the foundational principles of statistics is that what’s true at the population level is often not true at the individual level. Things can be true for populations that aren’t true at all for individuals.