This blogpost is part of FFT’s 2020 Secondary Results Service. Participating schools can now download their first GCSE Summary Analysis from the ‘Special reports’ area of FFT Aspire
Concerns about how different groups of pupils would fare were at the centre of the conversation about how to award GCSE grades ever since it was first announced that this summer’s exams would be cancelled.
When it was announced that teachers would be tasked with setting grades for their pupils, various parties, rightly, highlighted research that showed that disadvantaged pupils and those of certain ethnicities tended to lose out in similar situations.
And when Ofqual’s moderation approach was ditched in August – with pupils awarded the higher of the grades their school set for them and grades calculated by the regulator – concerns about the impact on certain groups of pupils were a big part of the motivation.
Now, thanks to an exercise carried out by our parent organisation, FFT Education, we can offer a first look at whether attainment gaps appear to have widened or not based on the results that were finally awarded.
The data
The data that we’re going to use was collected by FFT between the end of August and 11 September. More than 1,700 state secondary schools in England submitted their results, which were used to provide those schools with reports analysing their pupils’ attainment and progress.
We’re working with a slightly smaller group of schools in this blogpost – 1,216 in total – for which we have enough data on pupil characteristics, and we’ll be comparing these results to results published for 2019 by the Department for Education.
We think the results from this exercise are sound enough to form reasonable conclusions about state schools overall, but see whether you agree.
Disadvantage
Among our group of 1,216 schools, overall 73% of pupils achieved a grade 4 or above in English and maths GCSEs this year. That compares to 66% last year (slightly higher than the national average of 65%).
Where there were fears about the impact that using teacher assessment to award grades would have on disadvantaged pupils’ results, pleasingly these do not seem to have been borne out.
In fact, our data suggests that the grade 4+ attainment gap in English and maths might have closed slightly.
It shows that 78% of non-disadvantaged pupils achieved a grade 4 or above in English and maths, compared to 56% for disadvantaged pupils – a gap of 22 percentage points.
While that’s still a very large gap, the comparable figures for these schools last year were 72% and 46% – an attainment gap of 26 percentage points. (The gap for all state schools last year was 27 percentage points.)

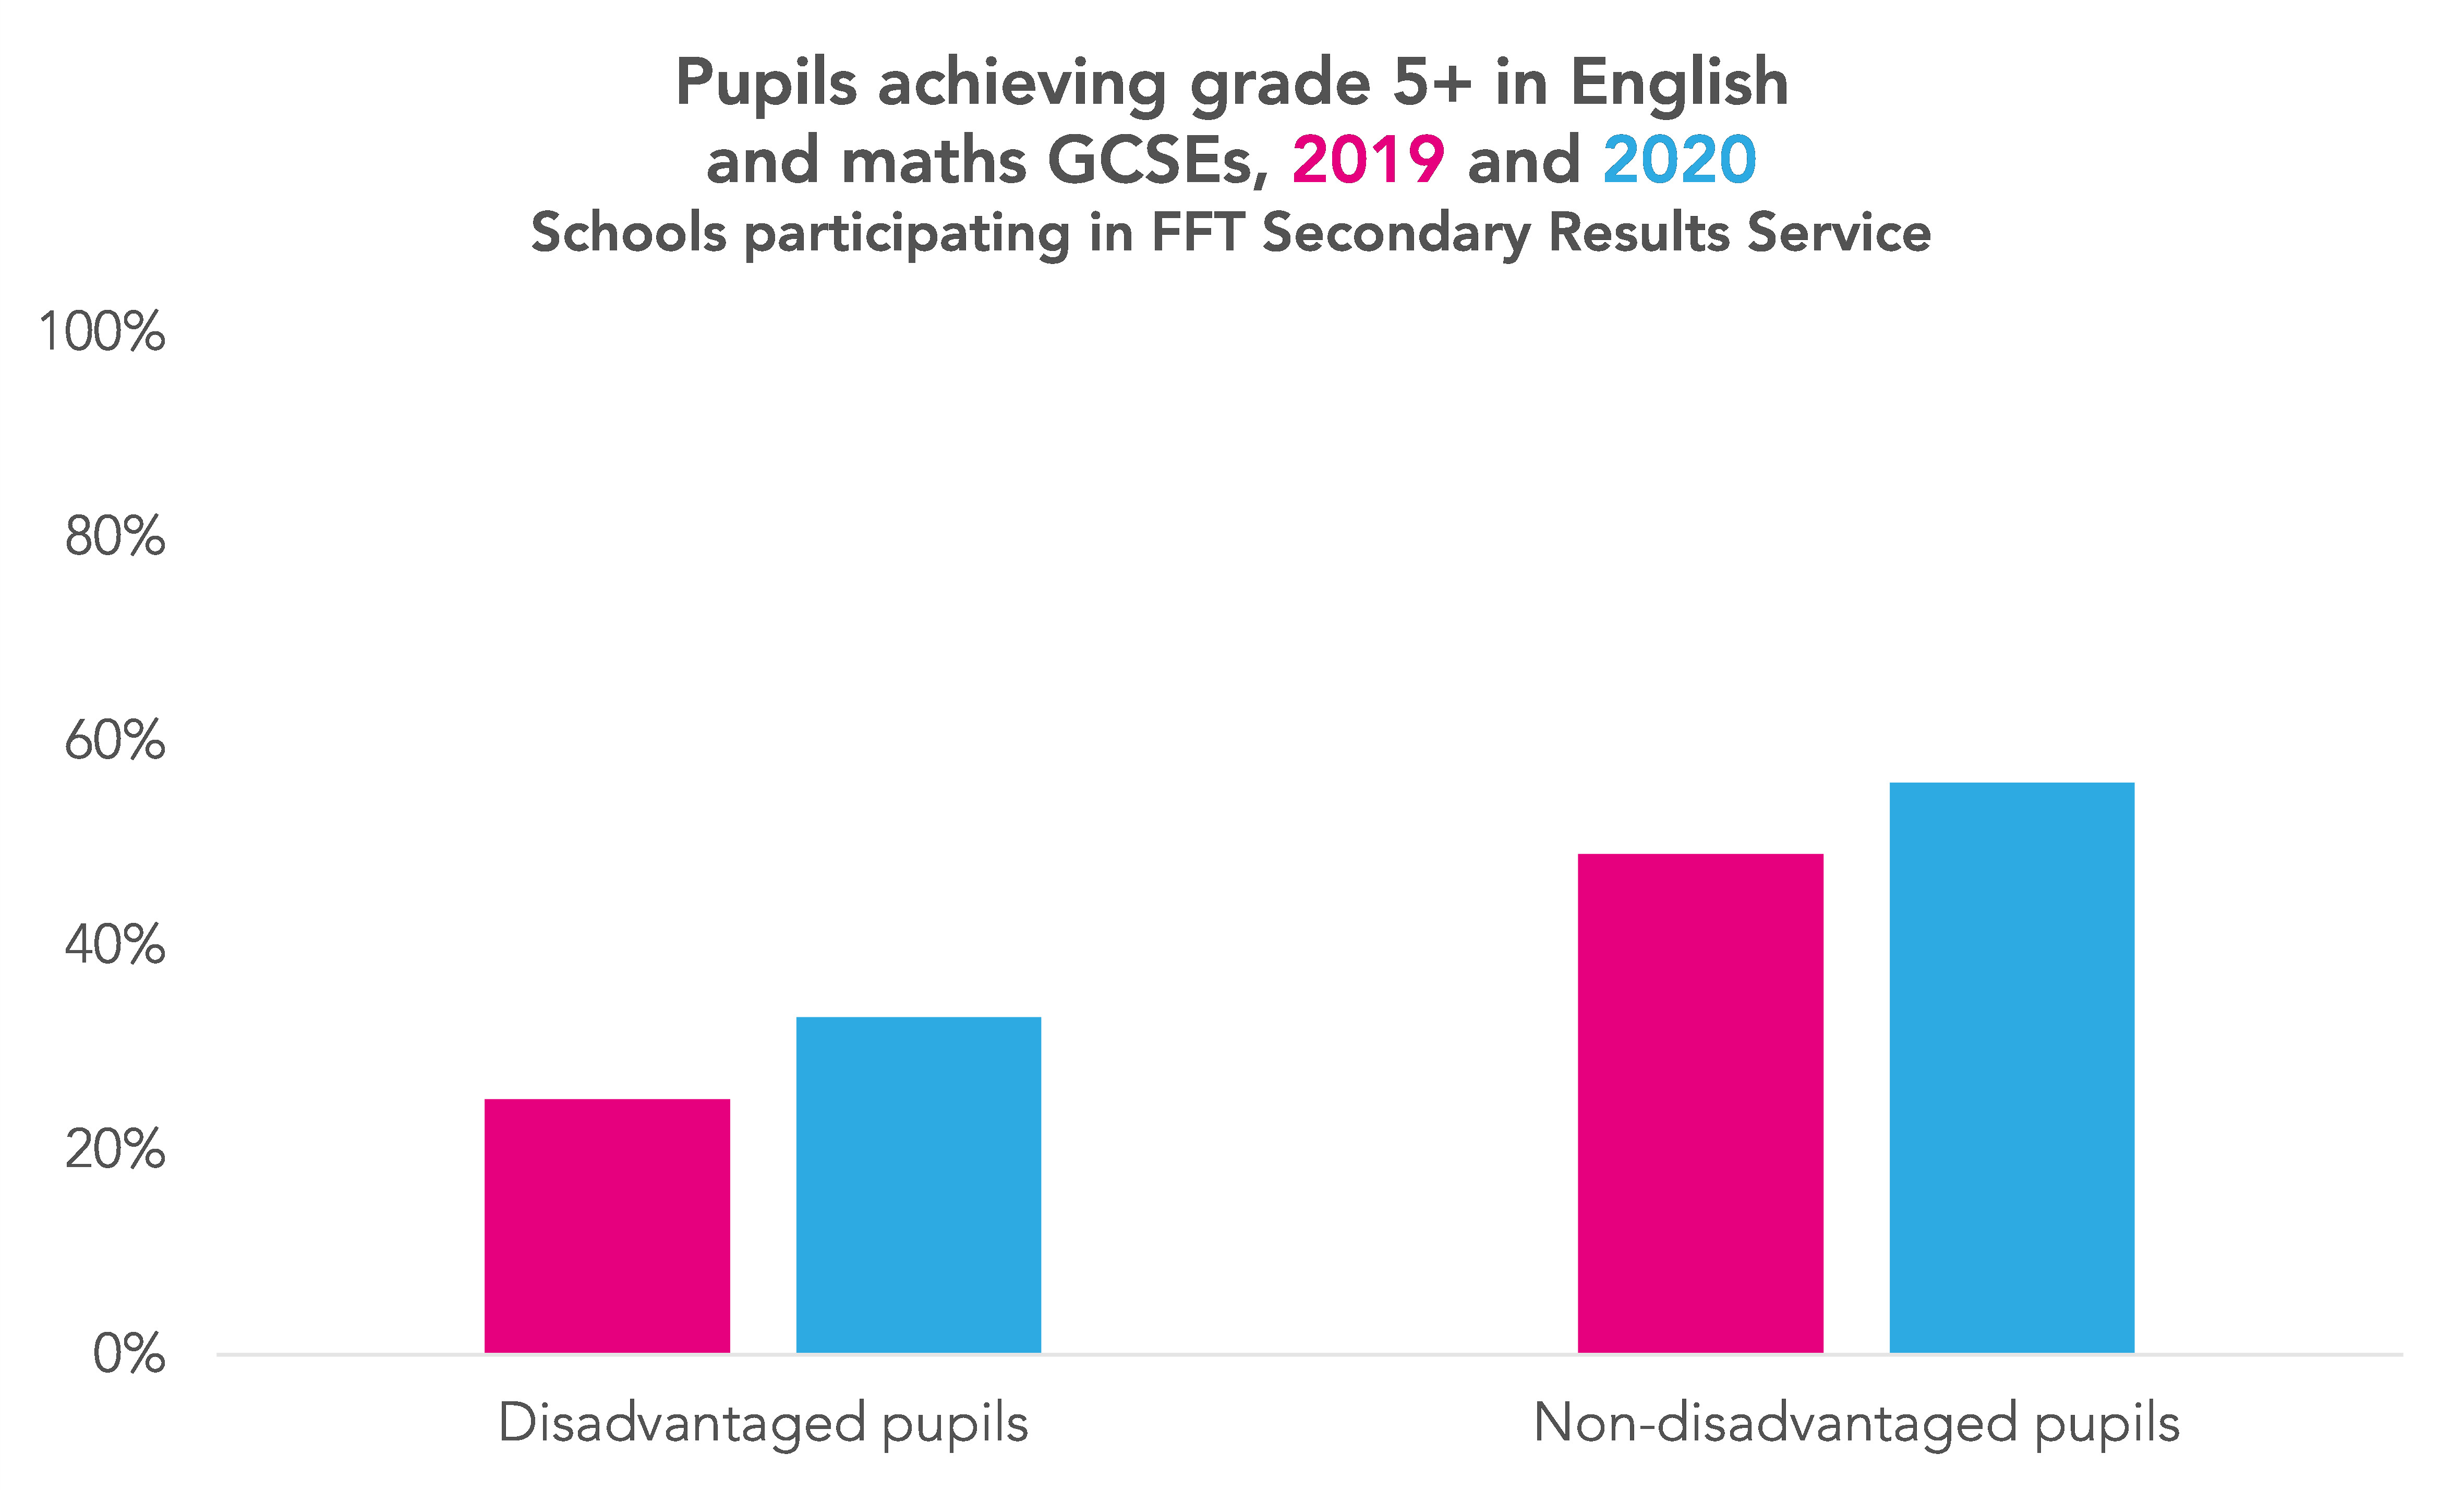
There is less evidence that this year’s results exhibit a smaller attainment gap when we consider a higher standard – achievement of a grade 5 or above in English and maths.
Here, for our group of 1,216 schools, an attainment gap of 23 percentage points exists in 2020 – compared to a gap of 24 percentage points last year. (For all state schools, the attainment gap last year was 25 percentage points.)
The percentage of non-disadvantaged pupils at this group of schools who achieved this standard increased from 49% to 56%, while the percentage of disadvantage pupils achieving this standard increased from 25% to 33%.
Now there are a couple of caveats worth stating. The proportion of disadvantaged pupils in the schools we’re looking at is higher in 2020 than 2019 – 27% this year versus 25% last year. This might be explained by recent changes to eligibility for benefits, with the full introduction of Universal Credit, which might affect comparability between years.[1]
Also, as you’ll have noticed, we’re working with rounded percentages – which lack the precision we might really want. That’s because the 2019 school performance tables data which we’re using as the comparator deals in rounded percentages, so we’ve applied the same approach to the 2020 data. That does reduce the confidence that we can have in the absolute magnitude of changes between 2019 and 2020, but we think the broad conclusions remain valid.
Gender
Another characteristic which we might be interested in is gender.
When A-Levels ceased to be modular in recent years there were frequent predictions that boys’ results would improve, as – the theory went – they tended to do less work along the way, but pulled it out of the bag when it came to exams.
Would something similar mean that a switch away from public exams for GCSEs this summer mean that boys received a worse set of results than girls?
In truth, the picture isn’t clear – but it doesn’t look as if wide gender gaps have opened in attainment.
Looking at English and maths at grade 4 or above, 70% of boys in the schools we’re looking at achieved this standard this year, compared to 76% of girls – a gap of six percentage points.[2] Comparable figures for the same schools last year were 63% for boys and 70% for girls – a gap of seven percentage points. (This exactly mirrored the gap seen among all state schools last year.)

But if we consider achievement of a grade 5 or above in English and maths, the picture is reversed.
A total of 47% of boys in our body of 1,216 schools met this standard this year, and 55% of girls – a gap of eight percentage points. Last year’s figures were 41% and 47% respectively – meaning there was a slightly smaller gap of six percentage points. (The gap among all state schools nationally was seven percentage points last year.)

As with our conclusions about disadvantage, the point about rounded number and precision applies here. Ideally we’d be working with more accurate figures, but we think these figures are good enough to form some preliminary conclusions about the results of state secondary schools overall.
Conclusions
Overall, then, we think the results are broadly reassuring. Setting aside discussion of whether the awarding approach followed this summer was the correct one, it looks as if the disadvantage gap has not increased as some feared, and may in fact have reduced a little (while still being large). And we think things have remained broadly stable when it comes to gender, at least in regards to English and maths attainment.
We’ll return to all of this in much more detail as the year goes on, but we wanted to share our initial assessment. Plans must be worked out as soon as possible to avoid another shambles like this summer’s, and the more evidence available on which to base those plans the better.
Now read the second post based on this data, which looks at how results changed at school level
Want to stay up-to-date with the latest research from FFT Education Datalab? Sign up to Datalab’s mailing list to get notifications about new blogposts, or to receive the team’s half-termly newsletter.
1. Another point that we’ve covered previously is that attainment for disadvantaged pupils varies with the length of time spent disadvantaged. That’s not something we’re able to look at with the data we have available here, however.
2. This gap stems chiefly from attainment in English rather than maths. Looking at the English component of Attainment 8, in our set of schools girls had an average score of 11.3 this year (remember that the English score is doubled where a pupil takes both English language and English literature). That compared to 9.7 for boys. The comparable figures for 2019 were 11.0 and 9.3, respectively.
For maths, there was much less of a gap. In our set of schools, girls had an average Attainment 8 score of 10.0 this year (again, remember that the maths element is also double-weighted), compared to 9.9 for boys. The figures for 2019 were 9.2 and 9.3, respectively.


I’m a bit confused…. the graphs appear to show a decline in grades between 2019 and 2020?
Hi Jon. You were quite right- we’ve now fixed the charts. Thanks for flagging it up!
It is interesting that Roger Taylor said to the Education Select Committee (in replying to Q945) that the standardisation had a better impact on students from lower socioeconomic backgrounds compared with no standardisation.
So, if, as you said, the CAGs narrowed the attainment gap, and, as Roger Taylor implied (although he didn’t present any evidence), the standardisation narrowed this gap even more than the CAGs did. However, that is not consistent with reports in the press that disadvantage students were hit harder by the standardisation.
Thanks for your comment – I know this is an area where you’ve made a number of useful contributions over the summer.
I think it’s hard to know exactly how to reconcile those things, as many of them aren’t on a consistent basis. From my recollection, the news reporting about disadvantaged students losing out because of moderation principally related to A-Levels, and was based on Annex Q of the technical report that Ofqual put out. The measure of disadvantage used there was one of area deprivation, as opposed to FSM status, as used in this post.
But, I wonder if some of it is also down to exactly which statistics are used. Annex Q did indeed show that, for grades below A, for A-Levels, students in more deprived areas had their CAGs adjusted down to a greater extent than students in less deprived areas, on average. But, for grades A* and A, the opposite was true. I note that Ofqual’s statement to the Education Select Committee referred to students in more deprived areas being relatively advantaged at grades A* and A by the use of standardisation. (“Indeed, ‘A’ and ‘A*’ grade students in more disadvantaged areas did relatively better with standardised results than when results were not standardised.“) I wonder if, in his answer to the Committee (Q945), Roger Taylor perhaps spoke in more general terms than he ought to have. But we are in the realm of supposition a little – unfortunately we don’t yet have all the information we’d need to be able to try to properly reconcile the three things that you mention.
Thank you very much for your reply. While, as you said, we don’t have all the information we need, your suggestion sounds right. One of the weaknesses of our system is that MPs and ministers rarely look deeply enough to understand what statisticians are telling or not telling them. I’m sorry for the late rely – I only saw yours today.
Hi Philip,
I looked at Annex Q which you linked to (https://assets.publishing.service.gov.uk/government/uploads/system/uploads/attachment_data/file/909520/6656-3_Annex_Q_-_Awarding_GCSE__AS__A_level__advanced_extension_awards_and_extended_project_qualifications_in_summer_2020_-_interim_report.pdf).
Table Q2 seems to say that 31.35% of low SES entries were given A* /A CAG and the standardisation reduced that by 10.39%. For high SES entries, 39.72% were given A*/ CAG and the standardisation reduced that by 11.44%.
The fraction of low SES A*/A CAG that the standardisation downgraded was 10.39/31.35 = 0.33
The fraction of high SES A* CAG that the standardisation downgraded was 11.44/39.72 = 0.29
So a low SES A*/A CAG was more likely to be downgraded by the standardisation than a high SES A*/A CAG, which means when Roger Taylor claimed to the Education Select Committee that standardisation had a better impact on students from lower socioeconomic backgrounds compared with no standardisation, it is arguably not true for A*/A. Furthermore, it is consistent with what most people thought: the standardisation gave a worse outcome for bright students from disadvantaged backgrounds.
I have not looked to see if Roger Talyor’s claim is true for any other grades, but if it is not true for A*/A then it is not a claim that is generally true, and yet he made that claim generally.
Although the standardisation has been discarded, the reason I brought this up is to question what Roger Taylor said when giving evidence to the Education Select Committee.