Yesterday, the Education Policy Institute published an interesting report (pdf) into lost learning due to the pandemic.
This hit the headlines for the striking finding of a £78 billion wage hit due to lost learning due to the pandemic.
But what caught my eye – and what I wanted to find out more about – was the fact that differences in lost learning are vanishingly small (at least those due to the first pandemic wave).
This – I think – goes against the conventional wisdom. So let me explain.
The evidence
Back in June, the Department for Education published a report on learning loss due to the pandemic. This included differences by pupil characteristics – including for free school meals (FSM) and non-FSM pupils. In primary school, for reading, FSM pupils saw a decline of about 18 scale score points, compared to around 16 scale score points for non-FSM pupils.
But how big is an 18 point drop – and how does it compare to a 16 point drop?
To try and look at this another way, I present estimates in terms of average “percentile ranks”. Put simply, imagine that we rank all children who took the reading test in Autumn 2019 and Autumn 2020 from 0 (lowest performance) to 100 (highest performance). Where would FSM and non-FSM children sit, both pre and during the pandemic?
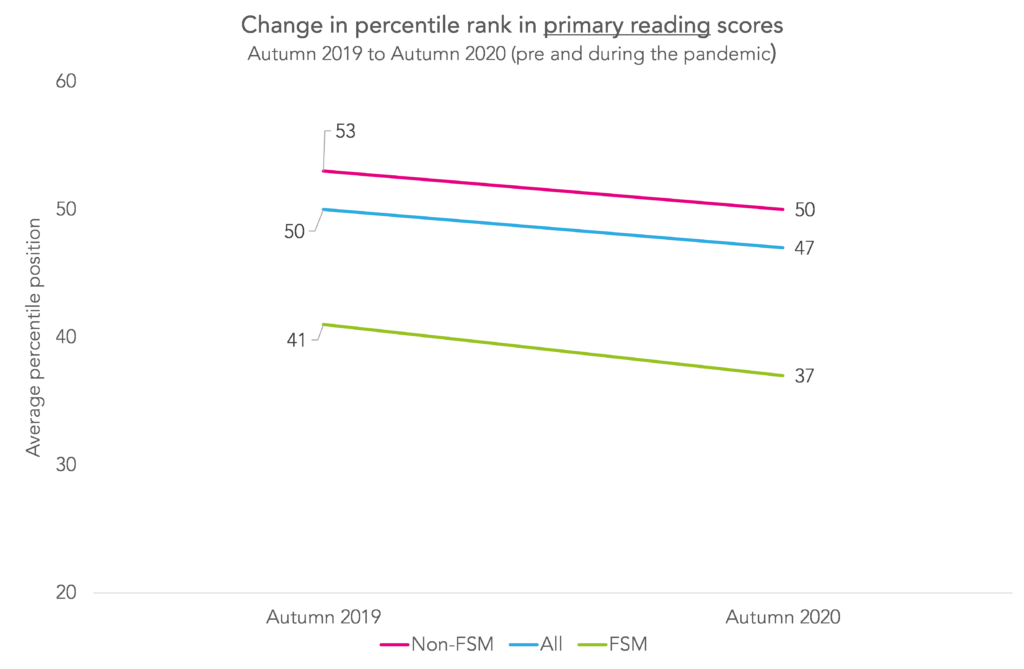
As we all know, even pre-pandemic, there were substantial gaps in achievement between FSM and non-FSM pupils.
But, to me, the more interesting thing is that this gap did not seem to appreciably widen; at least after the first wave. In other words, the lines in the chart are pretty much parallel to one another (and, in fact, I think may even be slightly exaggerated due to rounding issues).
For statistics nerds out there, another way to phrase this is that the difference between FSM and non-FSM pupils in autumn 2019 (pre-COVID) was equivalent to an effect size of 0.32. In Autumn 2020 (after the first wave) this was 0.33 – for all intents and purposes, unchanged. (For further details about effect sizes and conversions into percentile ranks, see here).
What about other subjects? Well, the report also looked at reading in secondary school, and primary maths as well.


Although the size of the drop overall seems to differ by subject, the message with respect to the socio-economic gap is the same. That is, there is no evidence – based upon these data – that the socio-economic achievement gap notably increased.
So what does this all mean?
Now the evidence above is partial. It comes from one study, and is prior to the further lockdowns (and potential loss of schooling) that were imposed. Yet the results are also consistent with previous work FFT Education Datalab have done using a different data source where any increase in the disadvantage gap was minimal (particularly in reading).
They nevertheless perhaps present a more optimistic picture than is often portrayed. While there has been a degree of learning loss in mathematics, drops in reading scores were in general pretty small.
And, critically, the gap between socio-economic groups does not seem to have appreciably increased.
This should be kept in mind by the government when allocating catch-up funds, and upon whom these might be spent.
[1] Estimates for primary reading and maths are based upon Appendix Table A1 (pdf) for Year 5 pupils (all pupils, FSM Ever 6 and non-FSM Ever 6). For secondary reading, estimates are based upon Year 8 pupils from the same table.
Want to stay up-to-date with the latest research from FFT Education Datalab? Sign up to Datalab’s mailing list to get notifications about new blogposts, or to receive the team’s half-termly newsletter.


Leave A Comment