Today the Education Endowment Foundation has published a report we’ve been working on, looking at how the attainment gap between disadvantaged pupils and their classmates changed in primary schools during the course of the pandemic.
The work was done with colleagues from Teacher Tapp and the Education Endowment Foundation, who also funded the project.
In this blogpost we present some of our headline findings.
Research aims and the data
Before we started, we pre-registered our study. This means we set out in advance what data we would collect, the analysis we would perform and the results we would publish. You can see our study plan here.
This approach guards against us cherry picking results that look interesting. We’ve published all the results we said we’d publish whether they show anything or not. In fact, some of the results that don’t show anything we find pretty interesting. More of that in a bit.
We aimed to answer three key questions:
- How have attainment gaps changed since the onset of the pandemic?
- How did schools and teachers respond to the challenges of COVID?
- Were there any associations between school responses and changes in attainment gaps?
With Teacher Tapp onboard, there was little difficultly in answering the second question: schools were surveyed in July 2020 and again in December 2020. The first survey looked at how schools facilitated remote learning during the first period of partial closures, and the second on how schools set about in-person teaching when pupils returned to classrooms.
To answer the first and third questions, we collected attainment data from standardized reading and maths assessments developed by RS Assessment (PIRA and PUMA tests and NTS tests) from 132 primary schools. Data from Autumn Term 2019, prior to the pandemic, was used as a baseline. For comparison, we also collected data from Summer Term 2020 and Autumn Term 2020. [1]
Armed with this data, we were able to answer the three key questions.
1. How have attainment gaps changed since the onset of the pandemic?
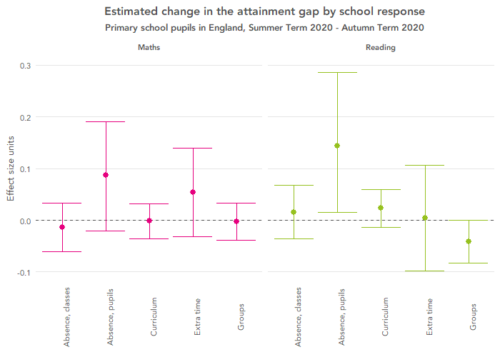
To understand how attainment gaps have changed, we compared attainment gaps across three time periods: Autumn Term 2019 – Summer Term 2020; Summer Term 2020 – Autumn Term 2020; and the whole period from Autumn Term 2019 – Autumn Term 2020.
The chart below shows the estimated change in the attainment gap during all three time periods, in effect size units. A negative estimate indicates that the attainment gap got wider and a positive estimate that it narrowed.

Maths
All the estimates for maths are negative – i.e. the attainment gap widened during each period. Overall, between Autumn 2019 and Autumn 2020, the gap widened by 0.07 effect size units. This is the equivalent of one month’s progress using the EEF’s conversion method.
Although estimates for both the period from Autumn 19 – Summer 20 and the later period from Summer 20 to Autumn 20 are negative, the estimate for the earlier period is much lower. In fact, the confidence interval for the later period contains zero, so we can’t be confident that the gap widened at all during this time.
Instead, the bulk of the increase in gap seems to have been occurred earlier, during the initial closure period.
Reading
When we look at reading, we see quite a different picture. Overall, between Autumn 19 – Autumn 20 the attainment gap widened by 0.00 effect size units, allowing for rounding – that is, it barely widened at all. And while the gap widened slightly between Autumn 19 and Summer 20, it closed slightly in the later period between Summer 20 and Autumn 20. Together, the changes during these two periods cancel each other out and give us the overall effect of 0.00.
It’s also worth noting that the confidence intervals for every period contain zero. So we can’t be confident that the attainment gap in reading changed at all.
2. How did schools and teachers respond to the challenges of COVID?
Initial closure period
Schools and teachers were forced to make huge changes to the way they interacted with their pupils during the various stages of the pandemic. The chart below shows teacher responses to our first survey, carried out in July 2020, focusing in on five key questions that give us some insight into how schools responded to the sudden switch to remote learning for the majority of pupils.
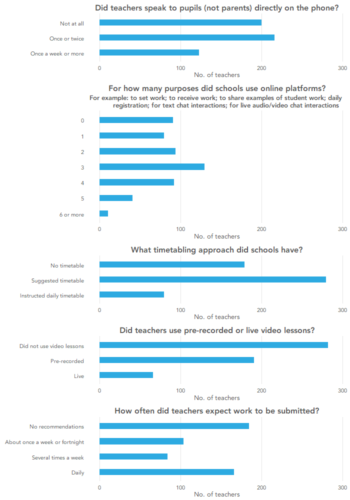
Re-opening period
The next chart shows teacher responses to the second survey, which was completed in December 2020. Again, it focuses on five key questions that describe how schools responded to the challenges of returning to in-person teaching for the majority of pupils.

3. Did these responses help to close the attainment gap?
The previous two charts show that schools used a variety of tactics to try and minimize the disruption to learning caused by the pandemic. But did any of these tactics help to close the gap between disadvantaged pupils and other pupils?
To find out, we looked at the association between each response and the attainment gap, controlling for differences in school and pupil level characteristics. The chart below shows the estimated change in the gap associated with each response during the first period of lockdown. A positive effect indicates that the response is associated with a narrowing of the gap, and a negative effect with a widening.

Overall, the changes associated with these school responses are notable by their absence: most of the estimates are very close to zero and all but one of the confidence intervals include zero, meaning that we can’t be confident that the responses are associated with any change in the attainment gap.
The next chart shows the estimated changes in the attainment gap associated with school responses during the re-opening period from September 2020.
Once again, the changes associated with most of the responses hover around zero. But one response, what we’ve referred to on the chart as ‘absence, pupils’, an indication of whether schools provided absent pupils with access to video / live streaming of lessons, does looks as though it may have made some difference. But even that is tentative: the confidence intervals for this response are very wide for both reading and maths.
What’s in a null?
The findings in the section above might seem a bit disappointing: we didn’t really find any clear associations between any of the school responses and changes to the attainment gap. But null results can be interesting too – we were surprised at the lack of any associations.
And those aren’t the only nulls we found.
For the full report, we also looked at whether there is any association between the school responses and overall attainment, and we didn’t find anything there either. We found this very surprising; we were certainly expecting that some of the school responses – for example, phoning students during the lockdown – would make a difference to attainment.
It’s worth saying that the null results may be partly to do with our data – we collated the teacher responses to get an overall response from each school, but there was some variety in the responses from different teachers in the same school. If different teachers in the same school were responding in different ways, that could have thrown off our estimates.
But equally, it could be the case that these responses didn’t make much of a difference to overall attainment during the pandemic, or to the attainment gap – suggesting, perhaps, that schools managed equally well.
Conclusions
The attainment gap at the end of Key Stage 2 already stood at around 0.50 effect size units before the pandemic – the equivalent of six month’s progress – so disadvantaged pupils can ill afford to fall any further behind.
We found that the attainment gap between disadvantaged pupils and other pupils widened by the equivalent of one month in maths (0.07 effect size units) between Autumn 2019 and Autumn 2020. We didn’t find any change in the gap in reading.
Schools employed a variety of tactics to deal with the challenges of the initial closure period and the re-opening period in the Autumn Term. But, perhaps surprisingly, most of these tactics didn’t seem to be associated with a change in the attainment gap or with an increase in overall attainment.
We’ll be continuing with this project in the coming months, taking a look at how the attainment gap has changed over the course of the Spring and Summer Terms 2021.
[1] PIRA and PUMA tests and NTS tests are designed to be taken towards the end of the relevant term; Autumn Term tests in November / December and Summer tests in June / July. Because of COVID, the Summer Term tests were administered later than usual during 2020, in September / October when the majority of pupils returned to in-person schooling.


Have you tracked the difference in attainment between children in deprived groups who were attending school during lockdown (eg FSM) and those who were out of school during lockdown?
Hi Sandra. No, unfortunately we didn’t collect any data on this during the study.
So are you saying teachers have done a great job?