Aspire Attendance Tracker
Schools can track, analyse and compare their attendance data against 1,000s of other FFT schools using Aspire Attendance Tracker.
Log in to Aspire to access Attendance Tracker – log in here.
Not an FFT Aspire user? Learn more here.
With just one more full week of another disrupted term to go, we’re going to update the provisional analysis of persistent absence in state schools this term that we published three weeks ago.
By way of a recap, we’ve been collecting attendance data from schools since September 2020. So far this academic year, we’ve collected data from 5,200 primary schools and 2,500 secondary schools. They are mostly mainstream schools but include a handful of special and alternative provision schools.
Prior to the pandemic, the Department for Education (DfE) defined persistent absence as “when a pupil enrolment’s overall absence equates to 10 per cent or more of their possible sessions” (taken from this guide).
In our last post, which covered absences up to 12th November, over 20% of pupils in Years 1 to 6 and over 30% of pupils in Years 7 to 11 were persistent absentees according to the DfE definition. More than double the rate in 2019. Unsurprisingly in the midst of a global pandemic, this was related to an increase in authorised absence, i.e. illness.
So in this blogpost, we update these figures and also examine different thresholds and reasons for persistent absence.
This time our data covers the period up to 3rd December.
Primary Schools
Let’s start with primary schools.
In the chart below there are four bars.
These show the effect of applying different thresholds for absence when defining persistent absence. The first bar is based on an absence rate of 10% or more (the DfE definition). The other bars show the effect of raising the bar (to 20%, 30% and 50%).
Each bar is then divided into three parts.
First, the green part shows the percentage of pupils who would be classified as persistently absent purely as a result of unauthorised absence.
(We make the caveat here that reasons for some recent absences may not yet have been established).
The blue part then shows the additional pupils who would be classified as persistently absent based on unauthorised absence and authorised absence excluding illness.
Finally, the puce part shows the additional pupils who would be classified as persistently absent when we include illness and covid-related absences (i.e. isolation).
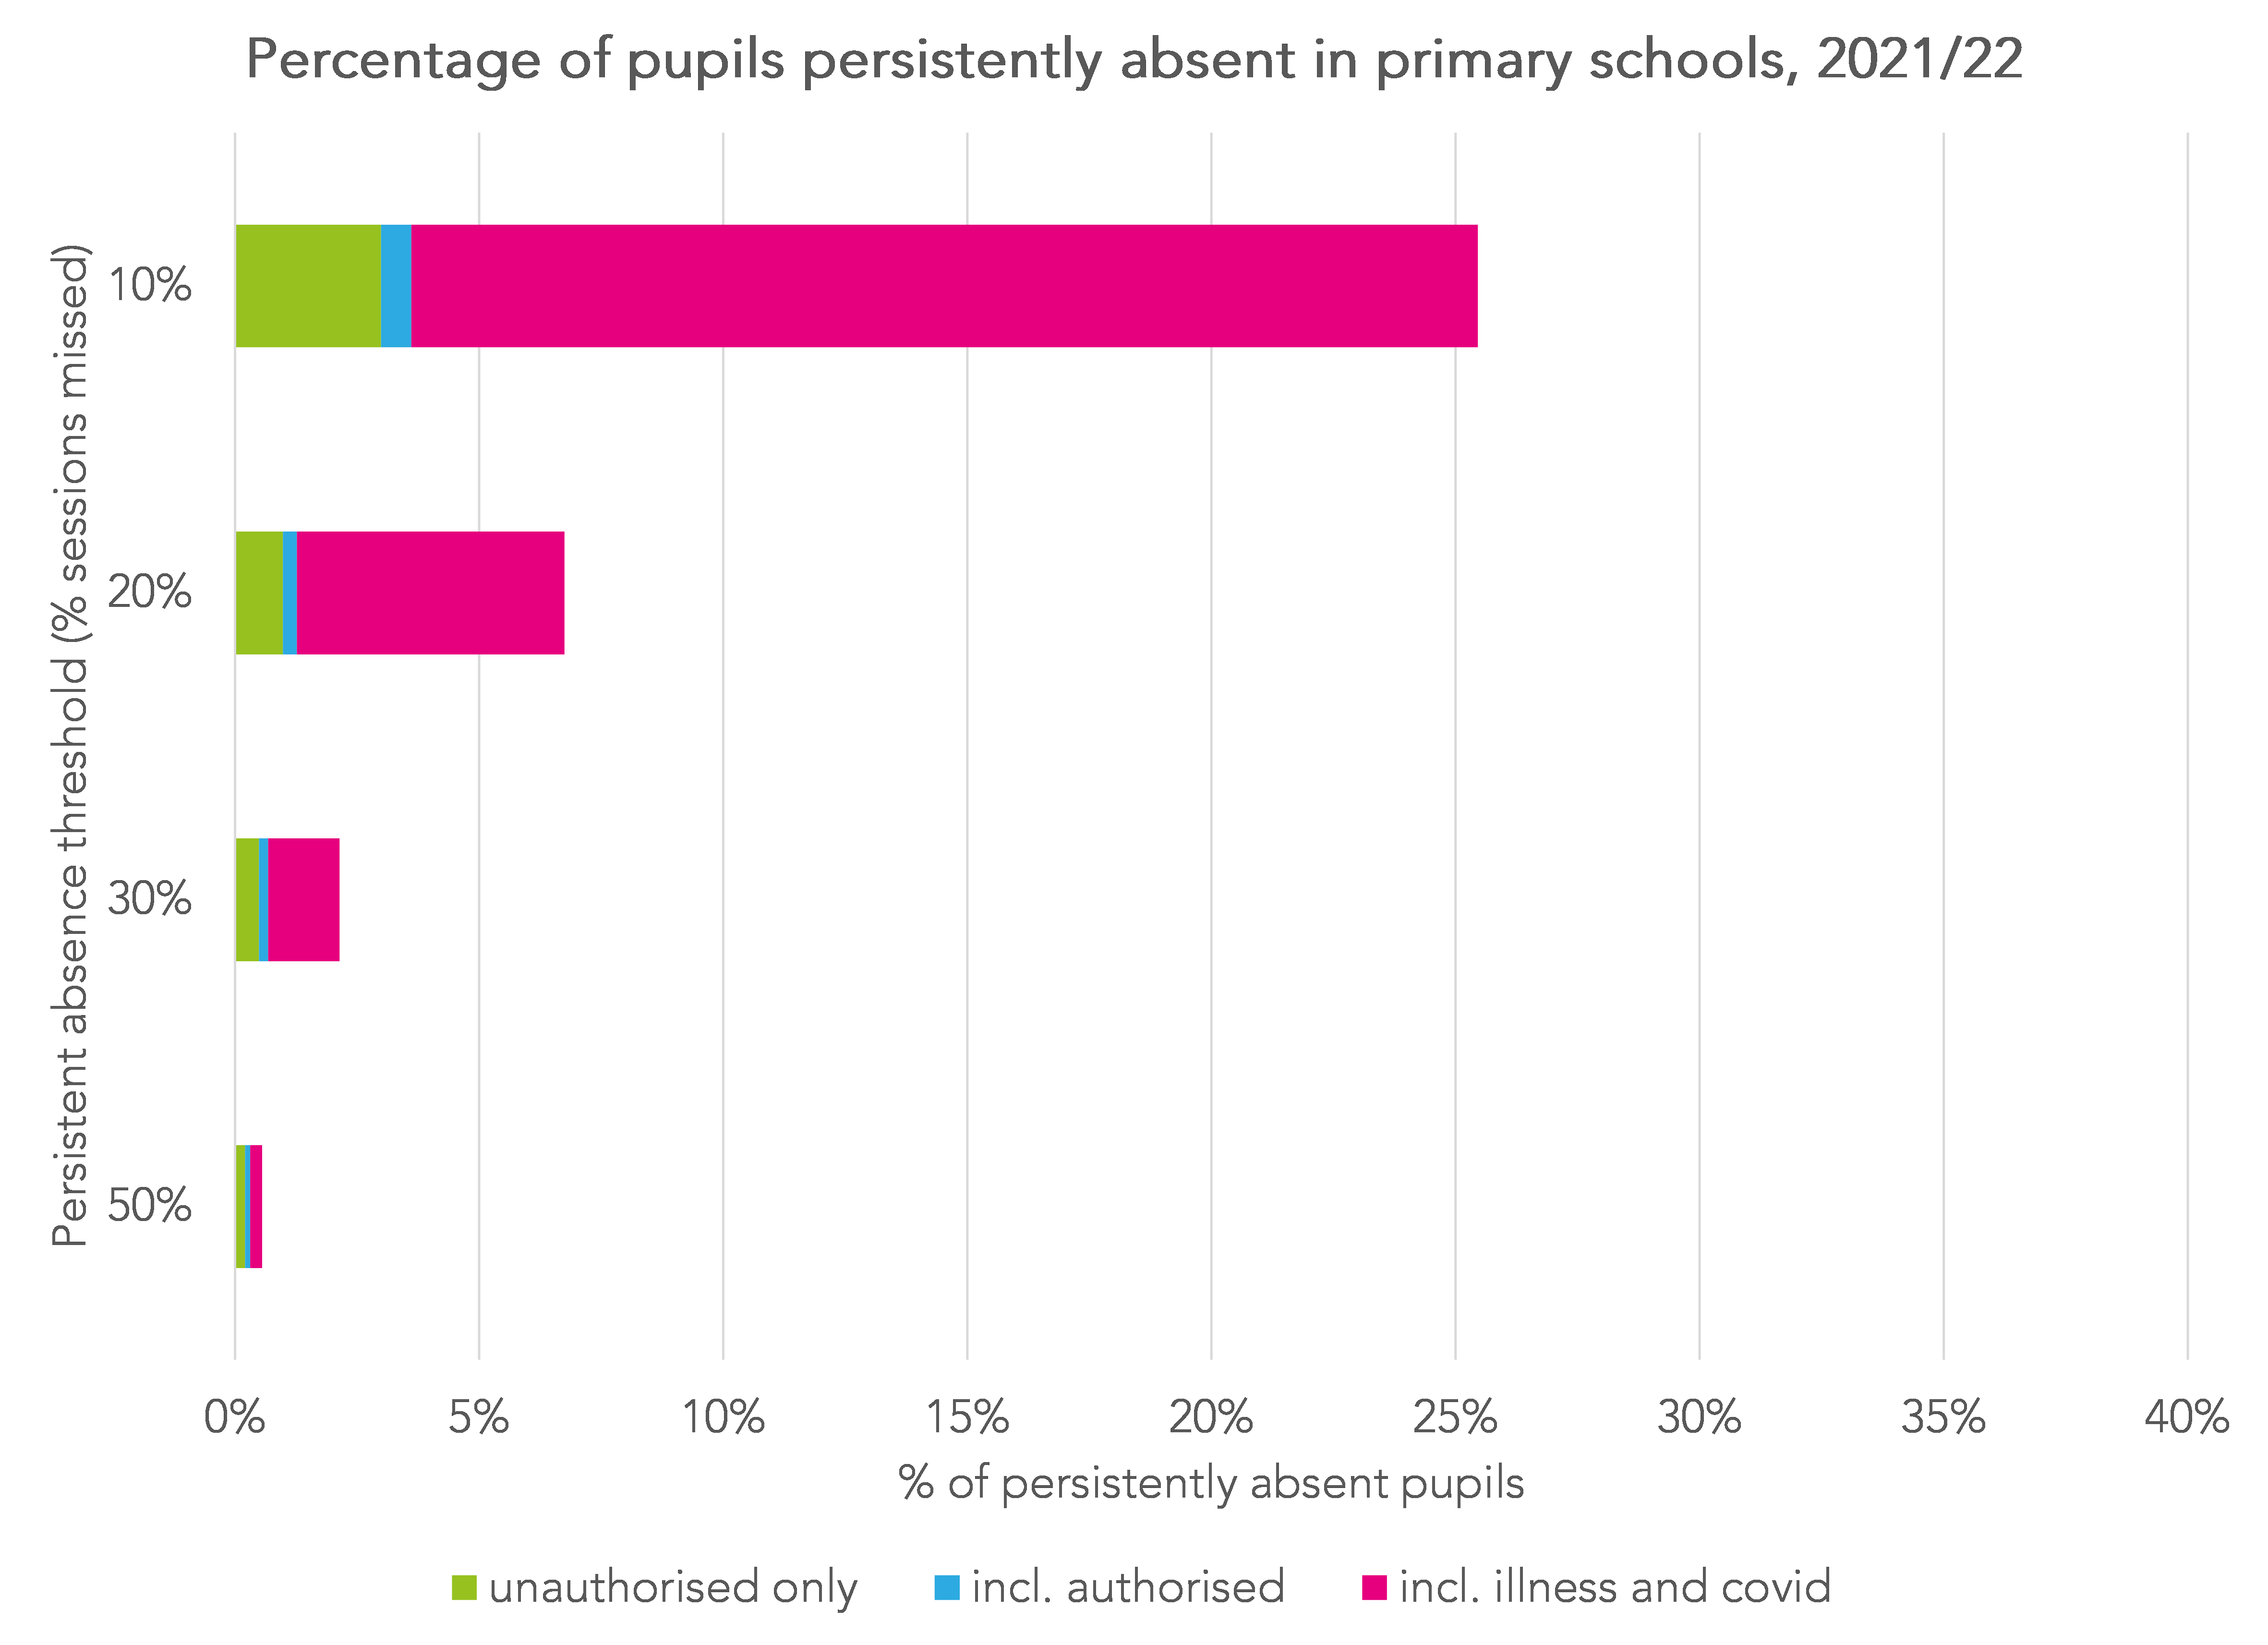
25% of primary pupils have missed 10% of sessions (or more), the equivalent of half a day week, so far this term. But based on unauthorised and authorised (excluding illness) absences this figure stood at less than 4%.
7% of pupils have missed 20% of sessions (or more) and 2% have missed 30% of sessions (or more). Among these groups, those classified as persistently absent due to unauthorised and authorised (excluding illness) form a larger proportion of the total compared to the 10% group.
Secondary schools
We repeat the analysis for secondary schools (see the section above for an explanation of the charts).
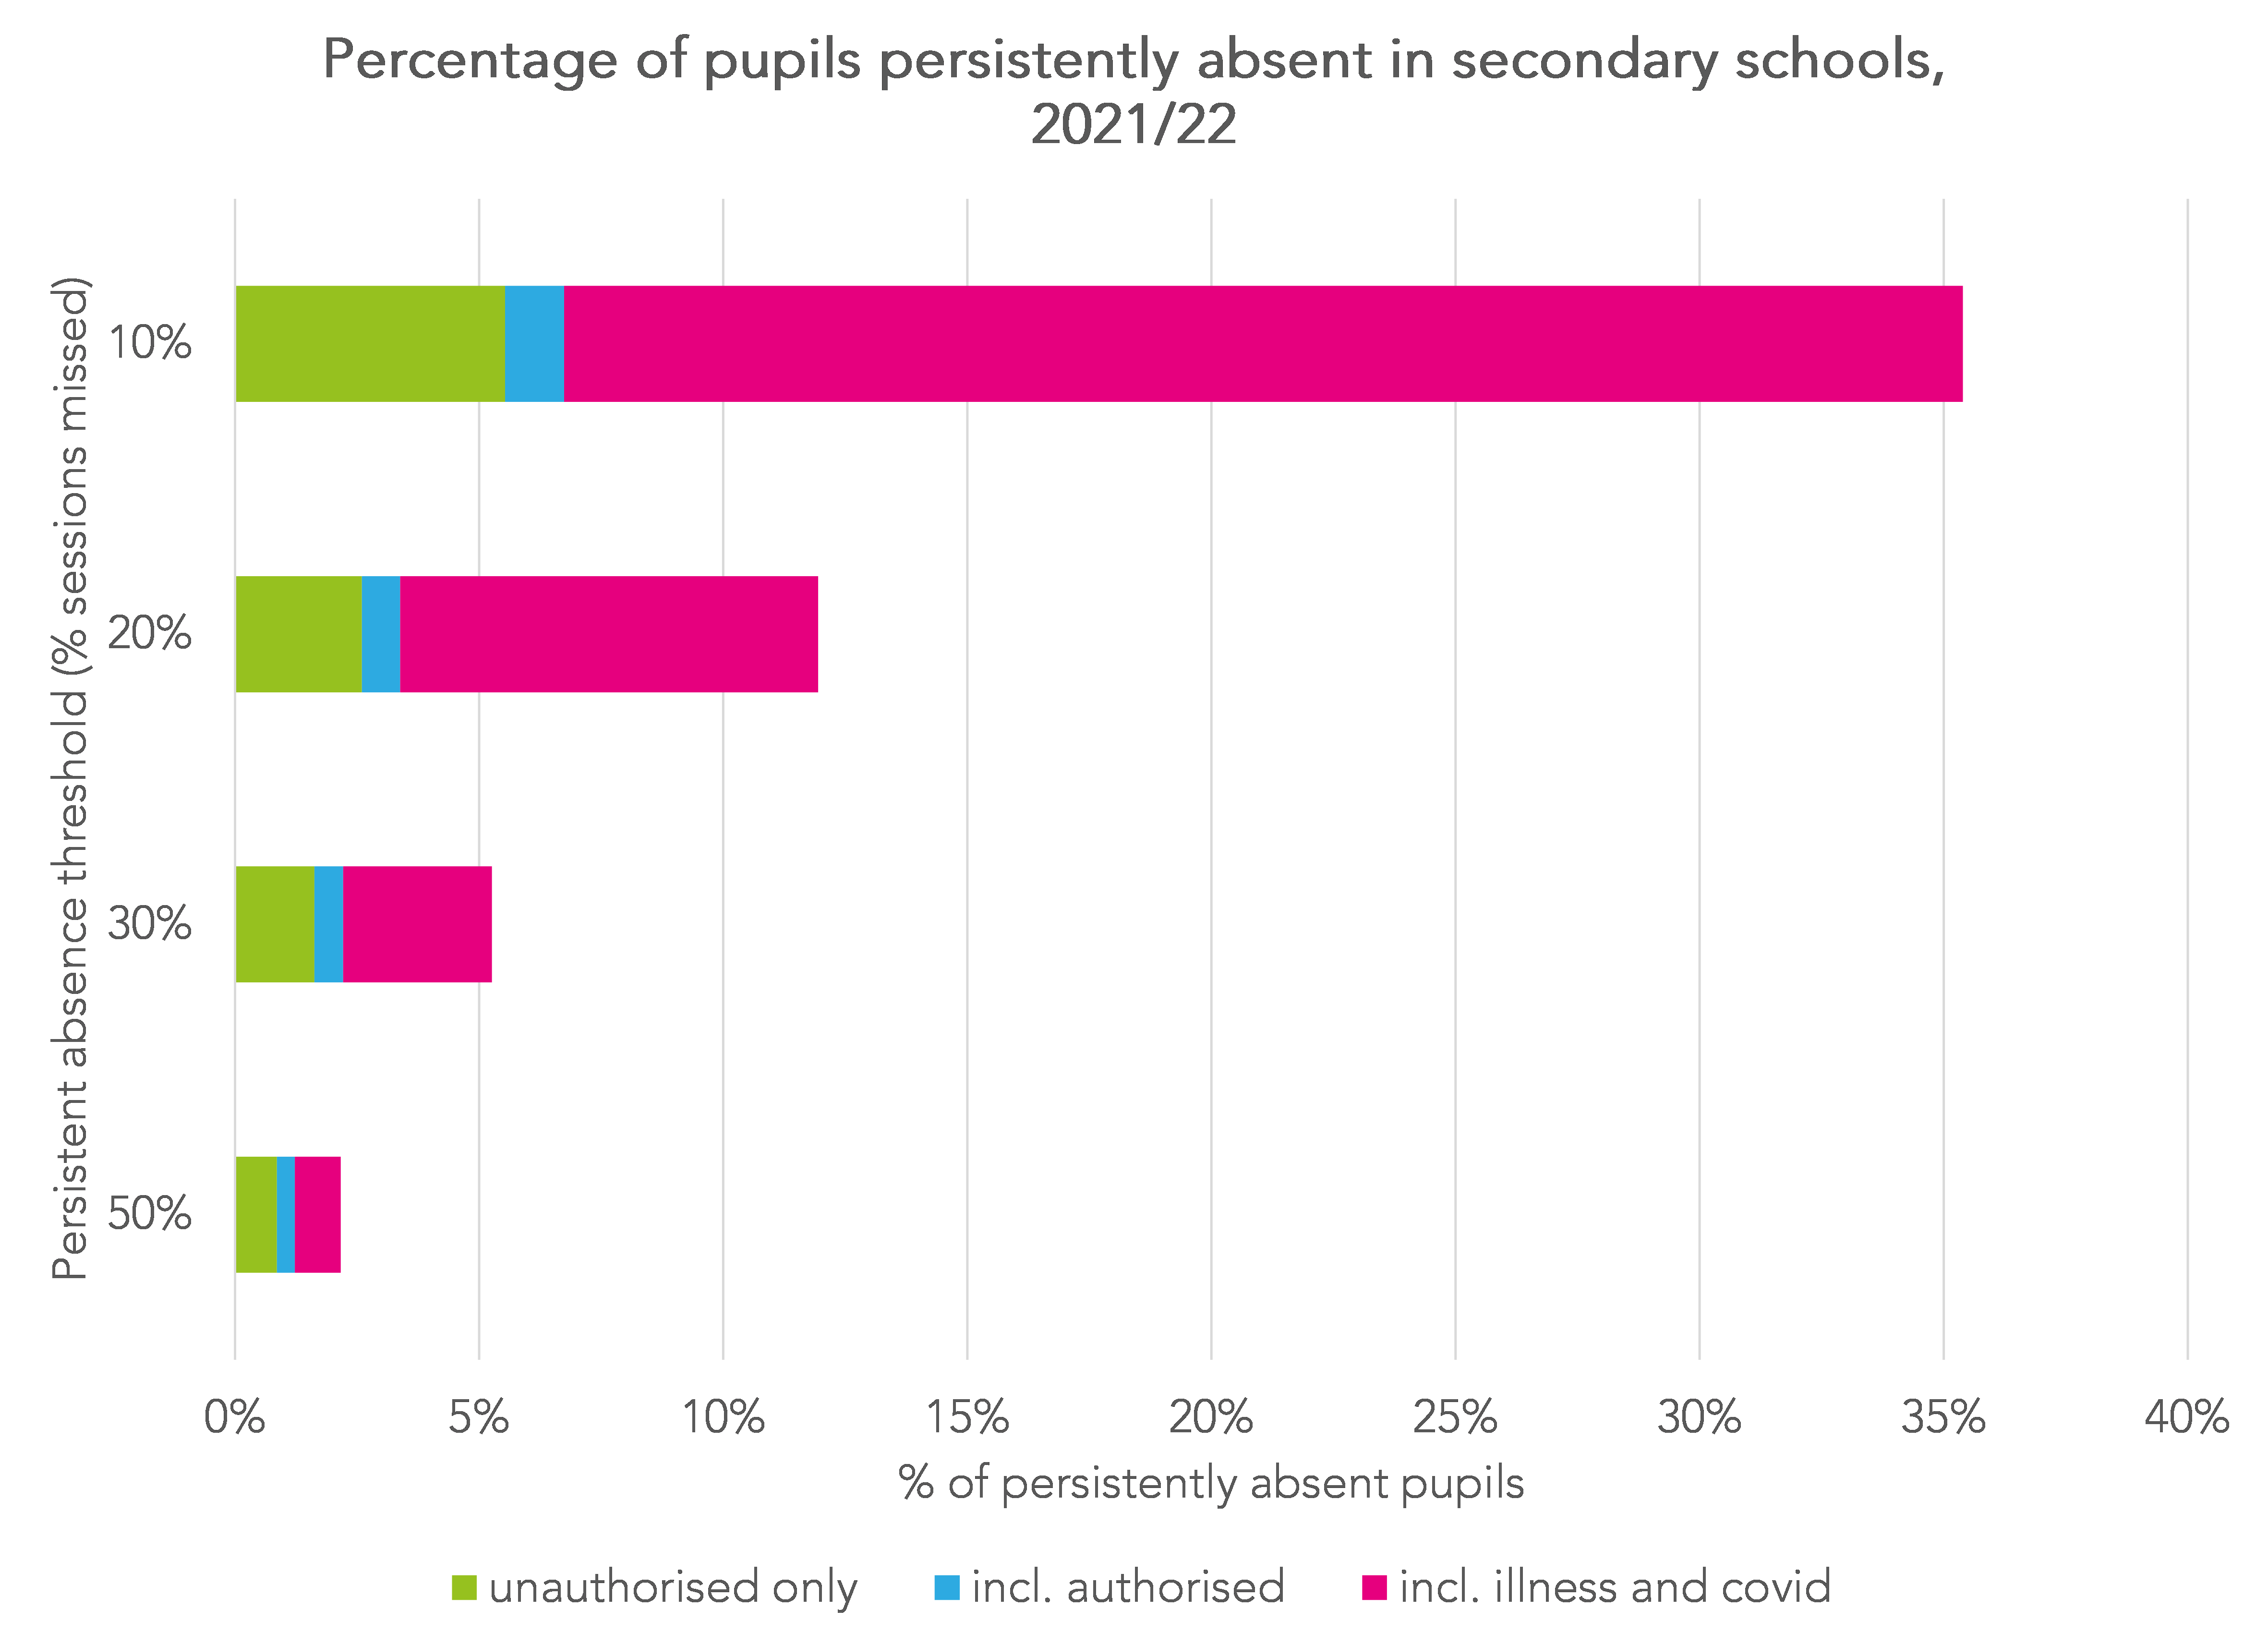
35% of pupils in Years 7 to 11 have missed at least 10% of sessions so far this year. If the definition is restricted to unauthorised and authorised (excluding illness) absences, this figure falls to 7%.
If the persistent absence definition were based on pupils who have missed at least 20% of sessions then 12% of secondary pupils would be classified as such. The figure would fall to 5% if based on a threshold of 30%.
Persistent absence by pupil characteristics
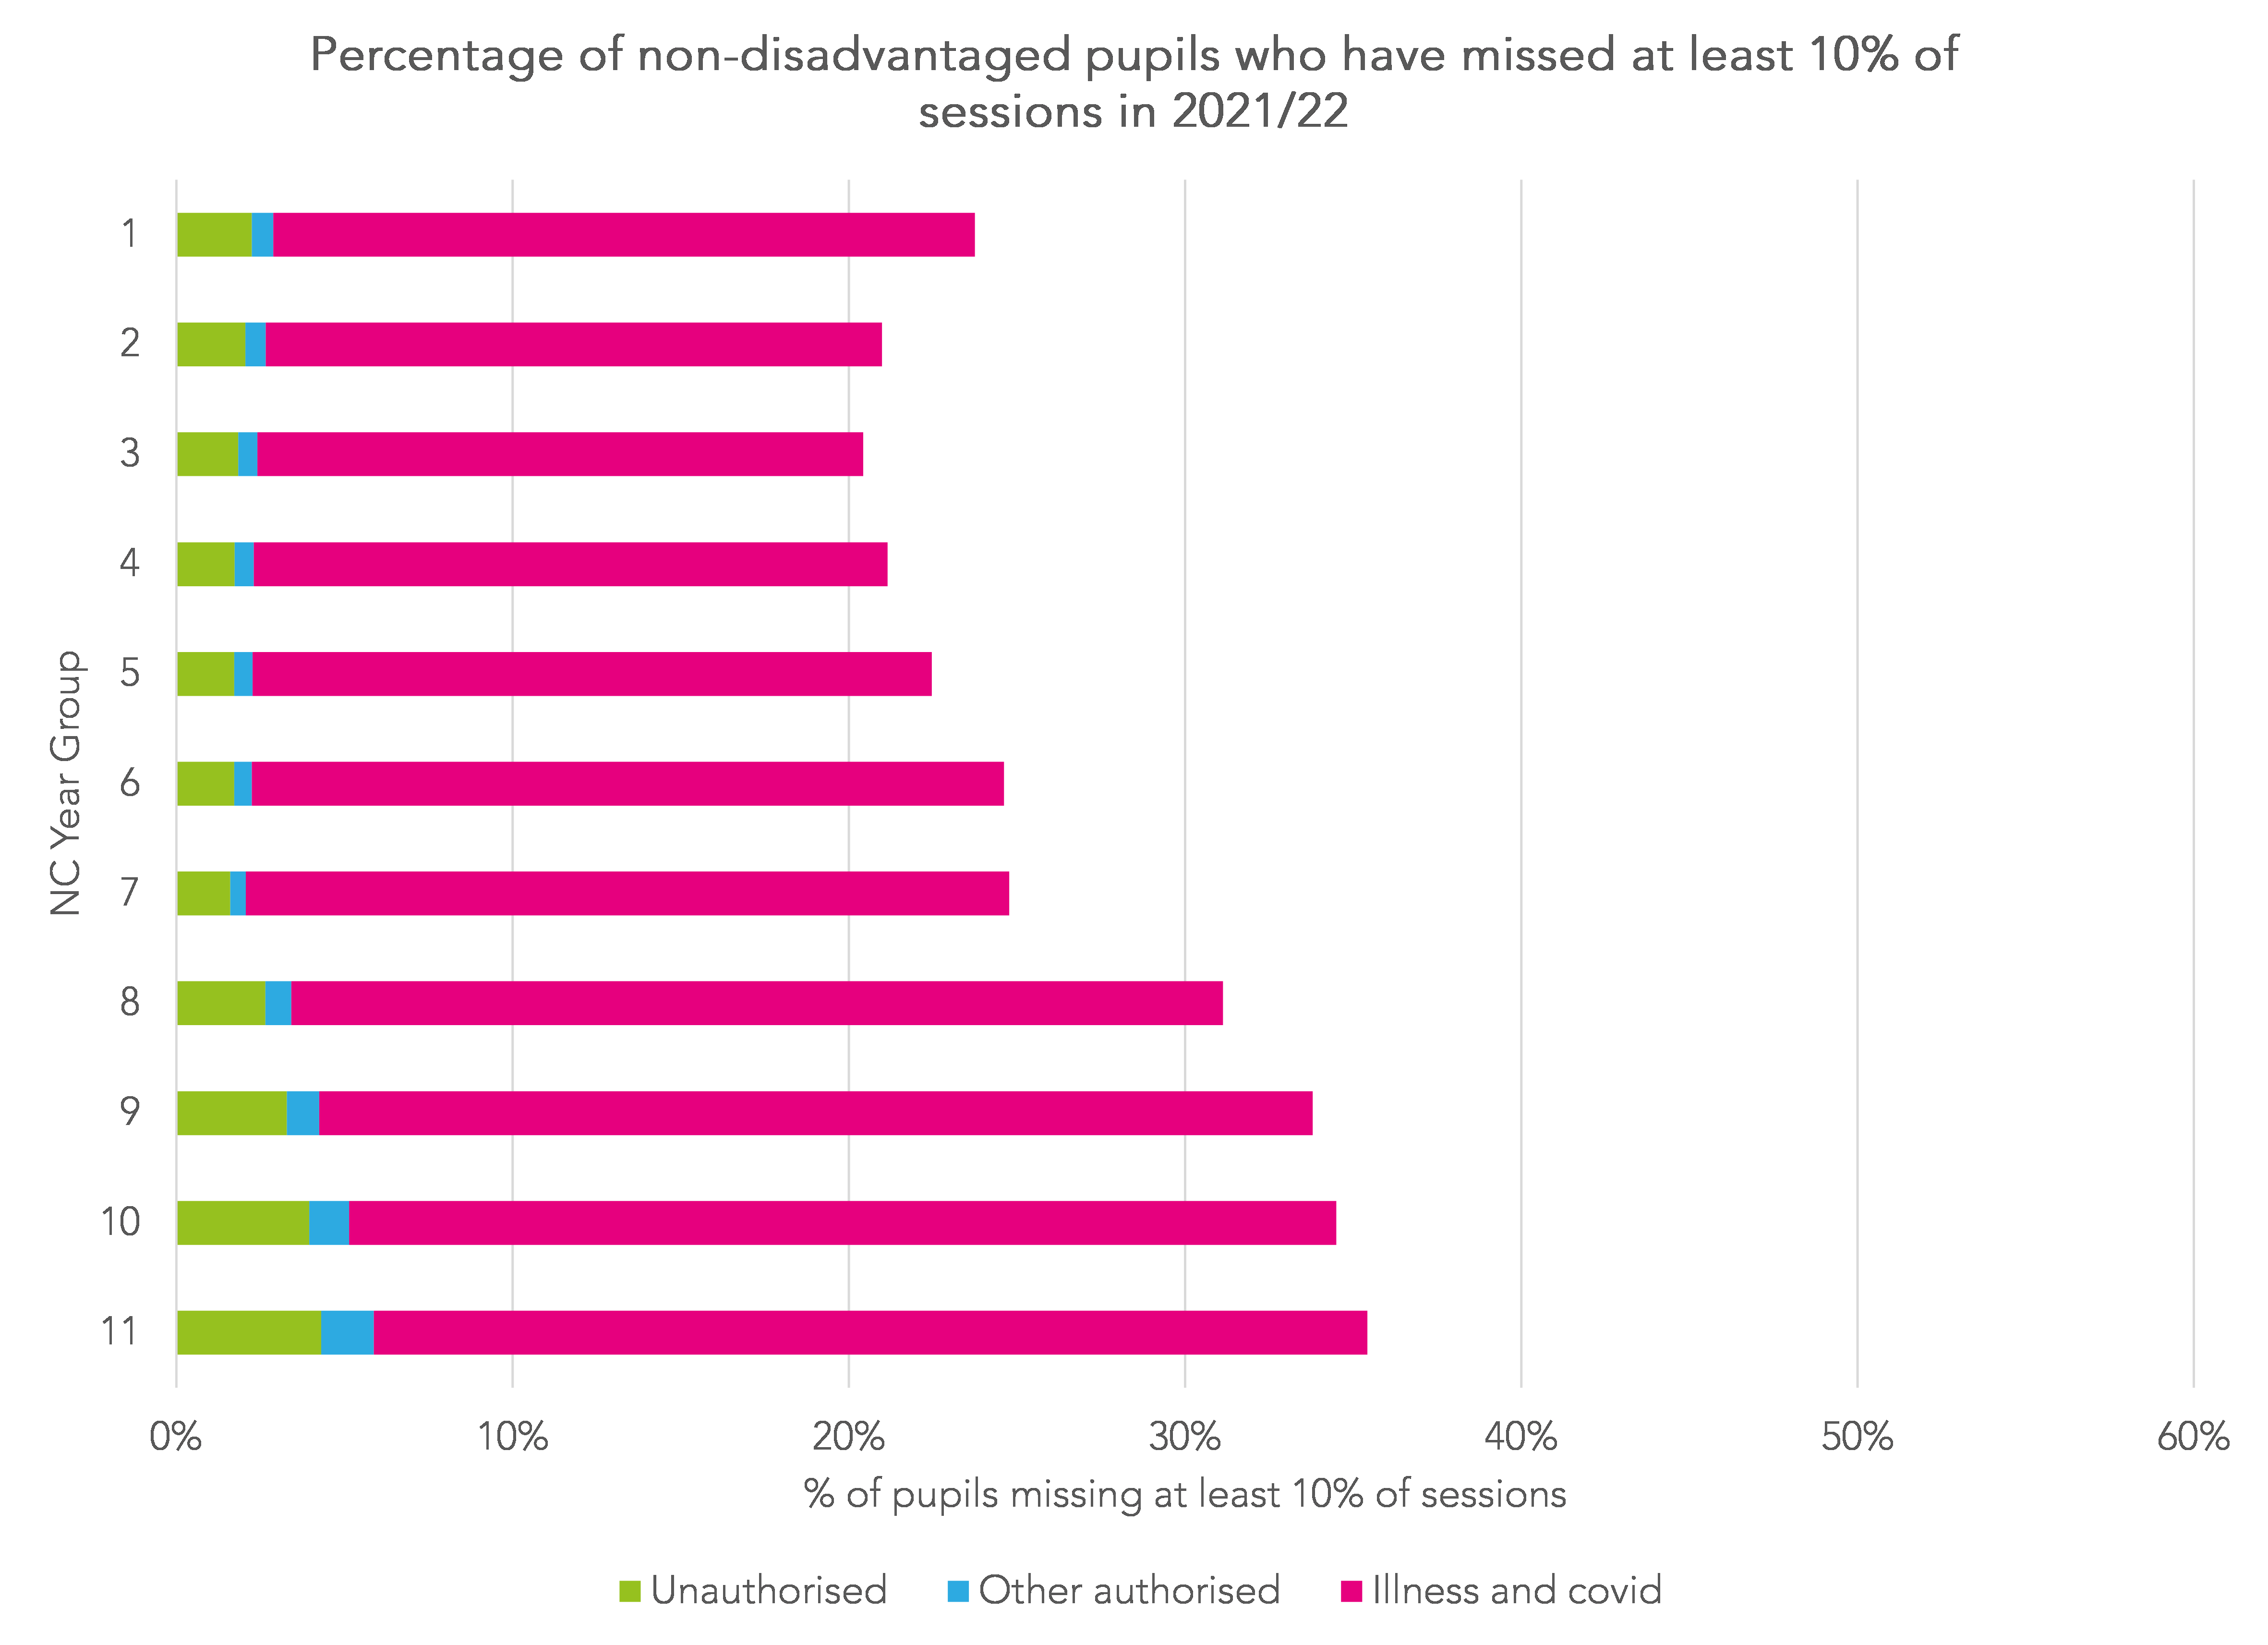
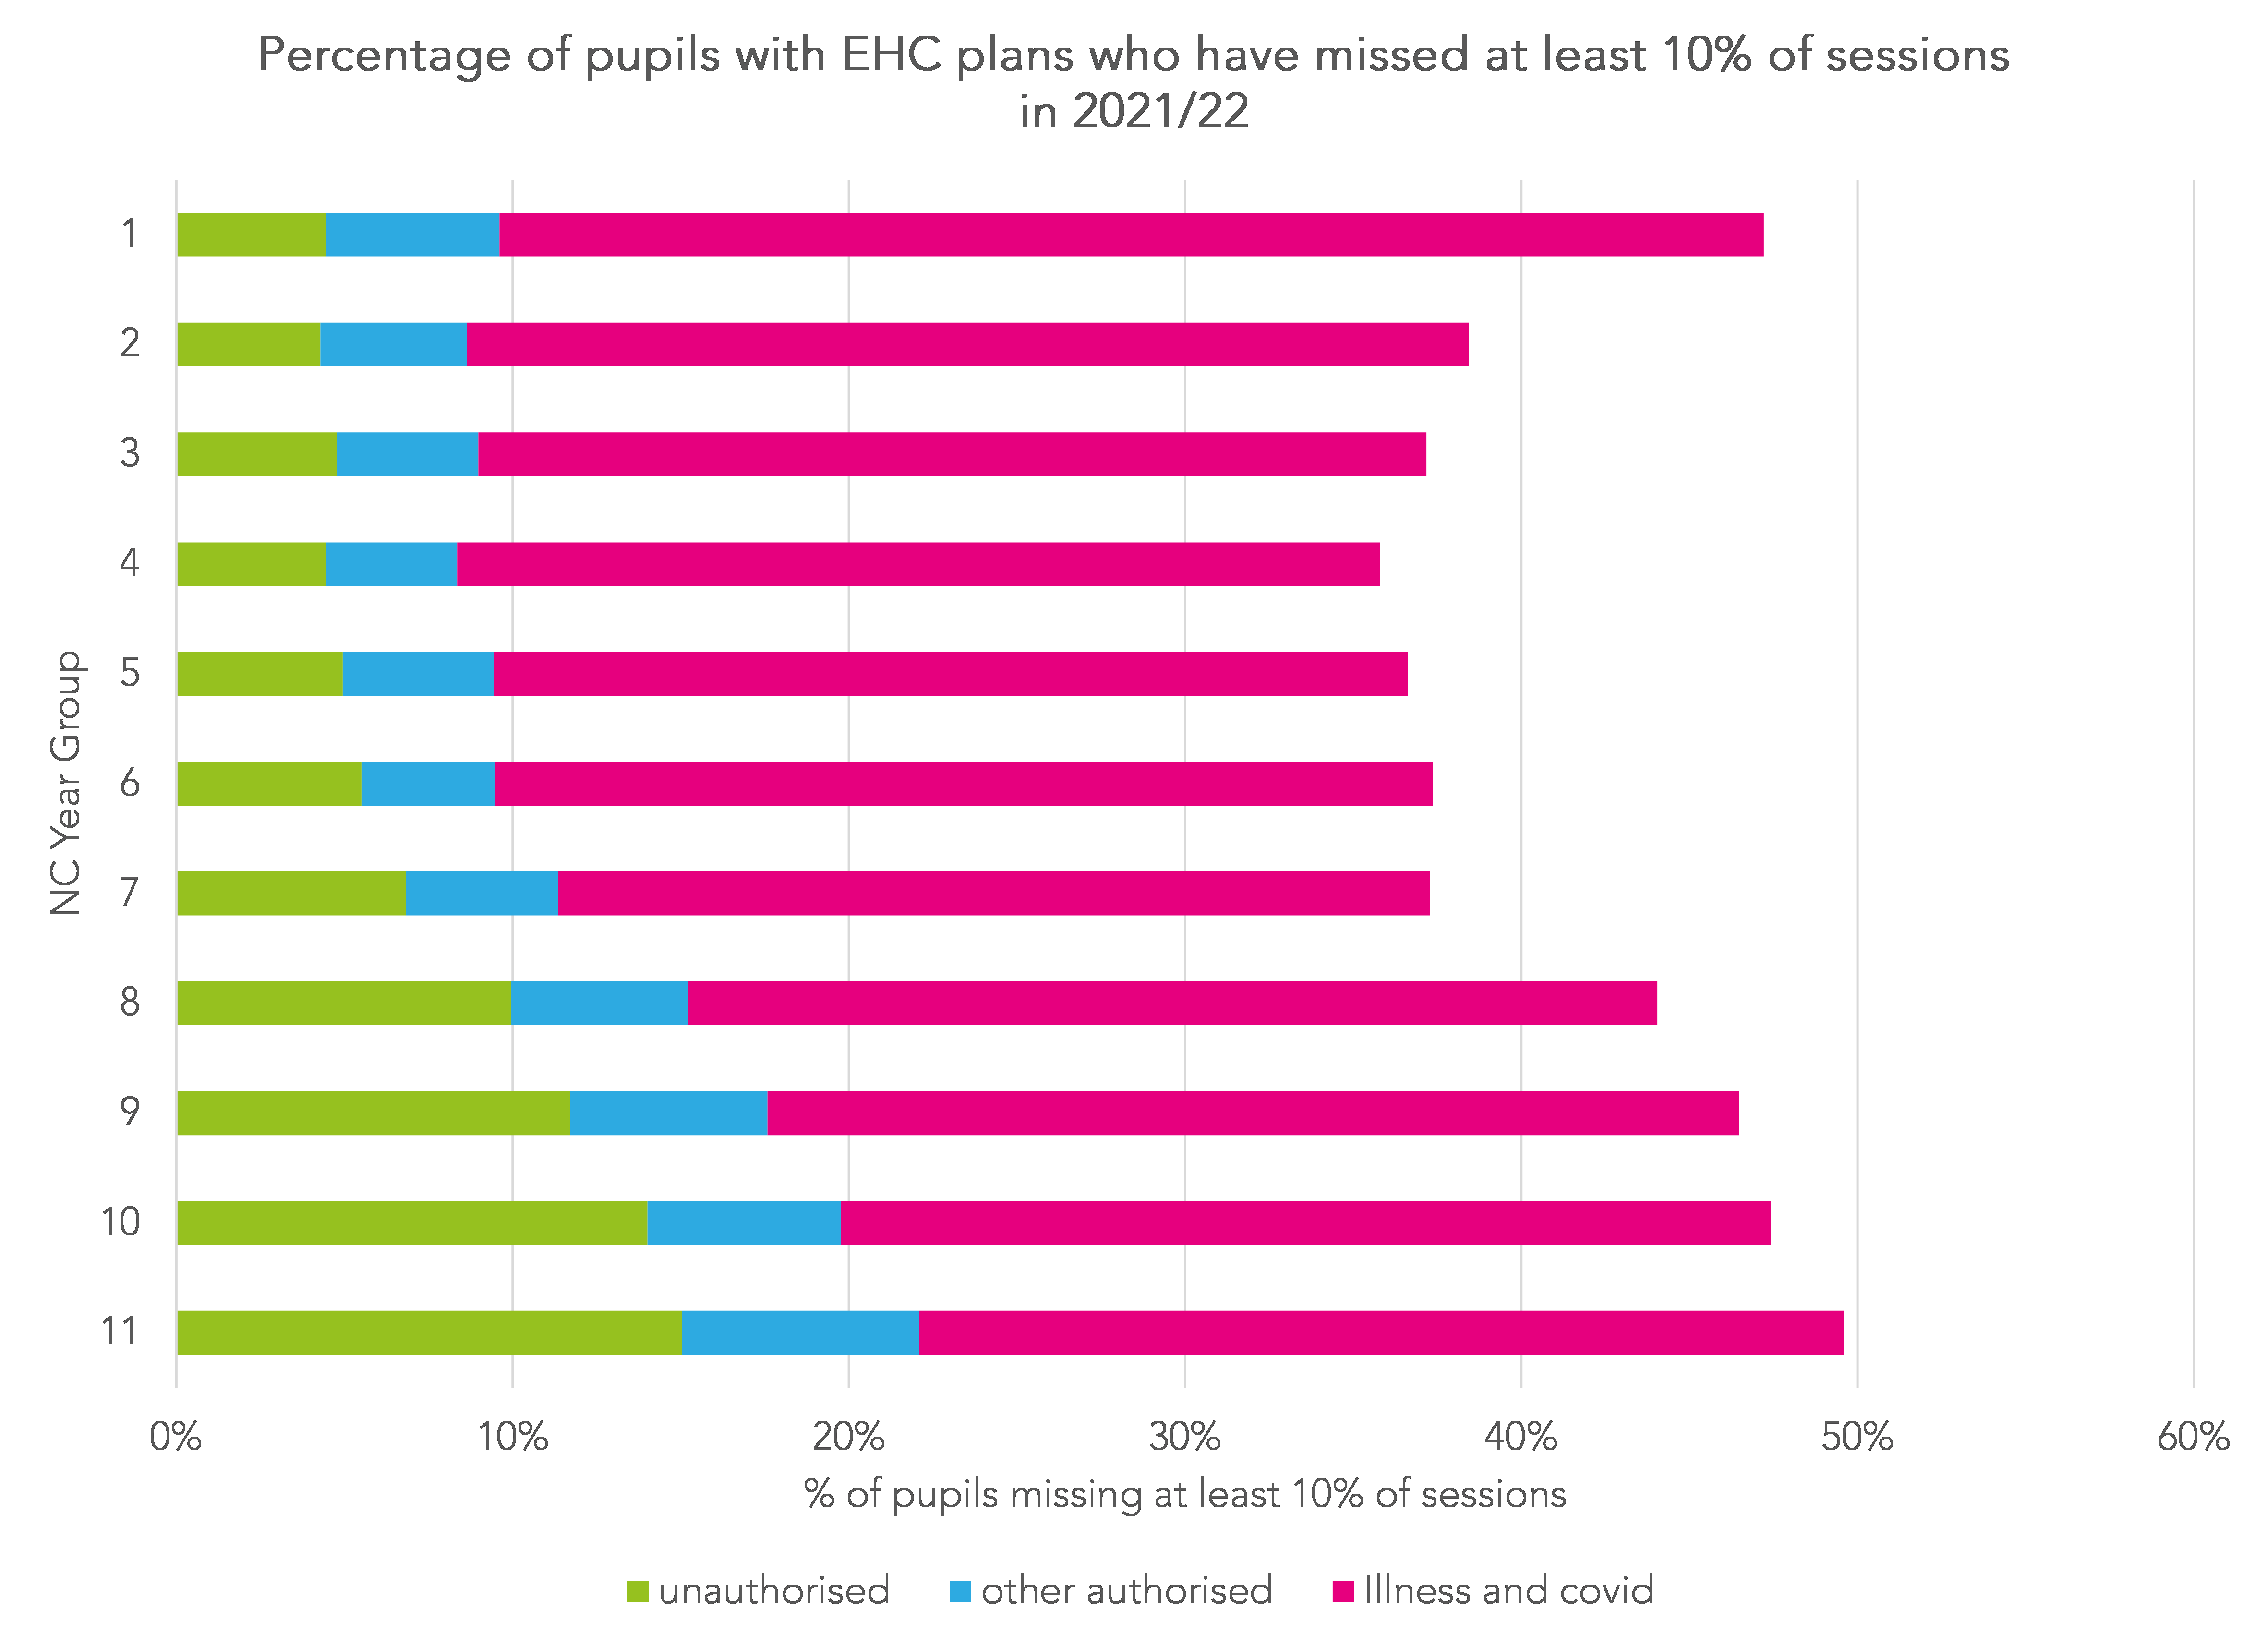
In the charts below, we show persistent absence using the 10% threshold by year group for disadvantaged pupils, non-disadvantaged pupils and pupils with EHC plans.
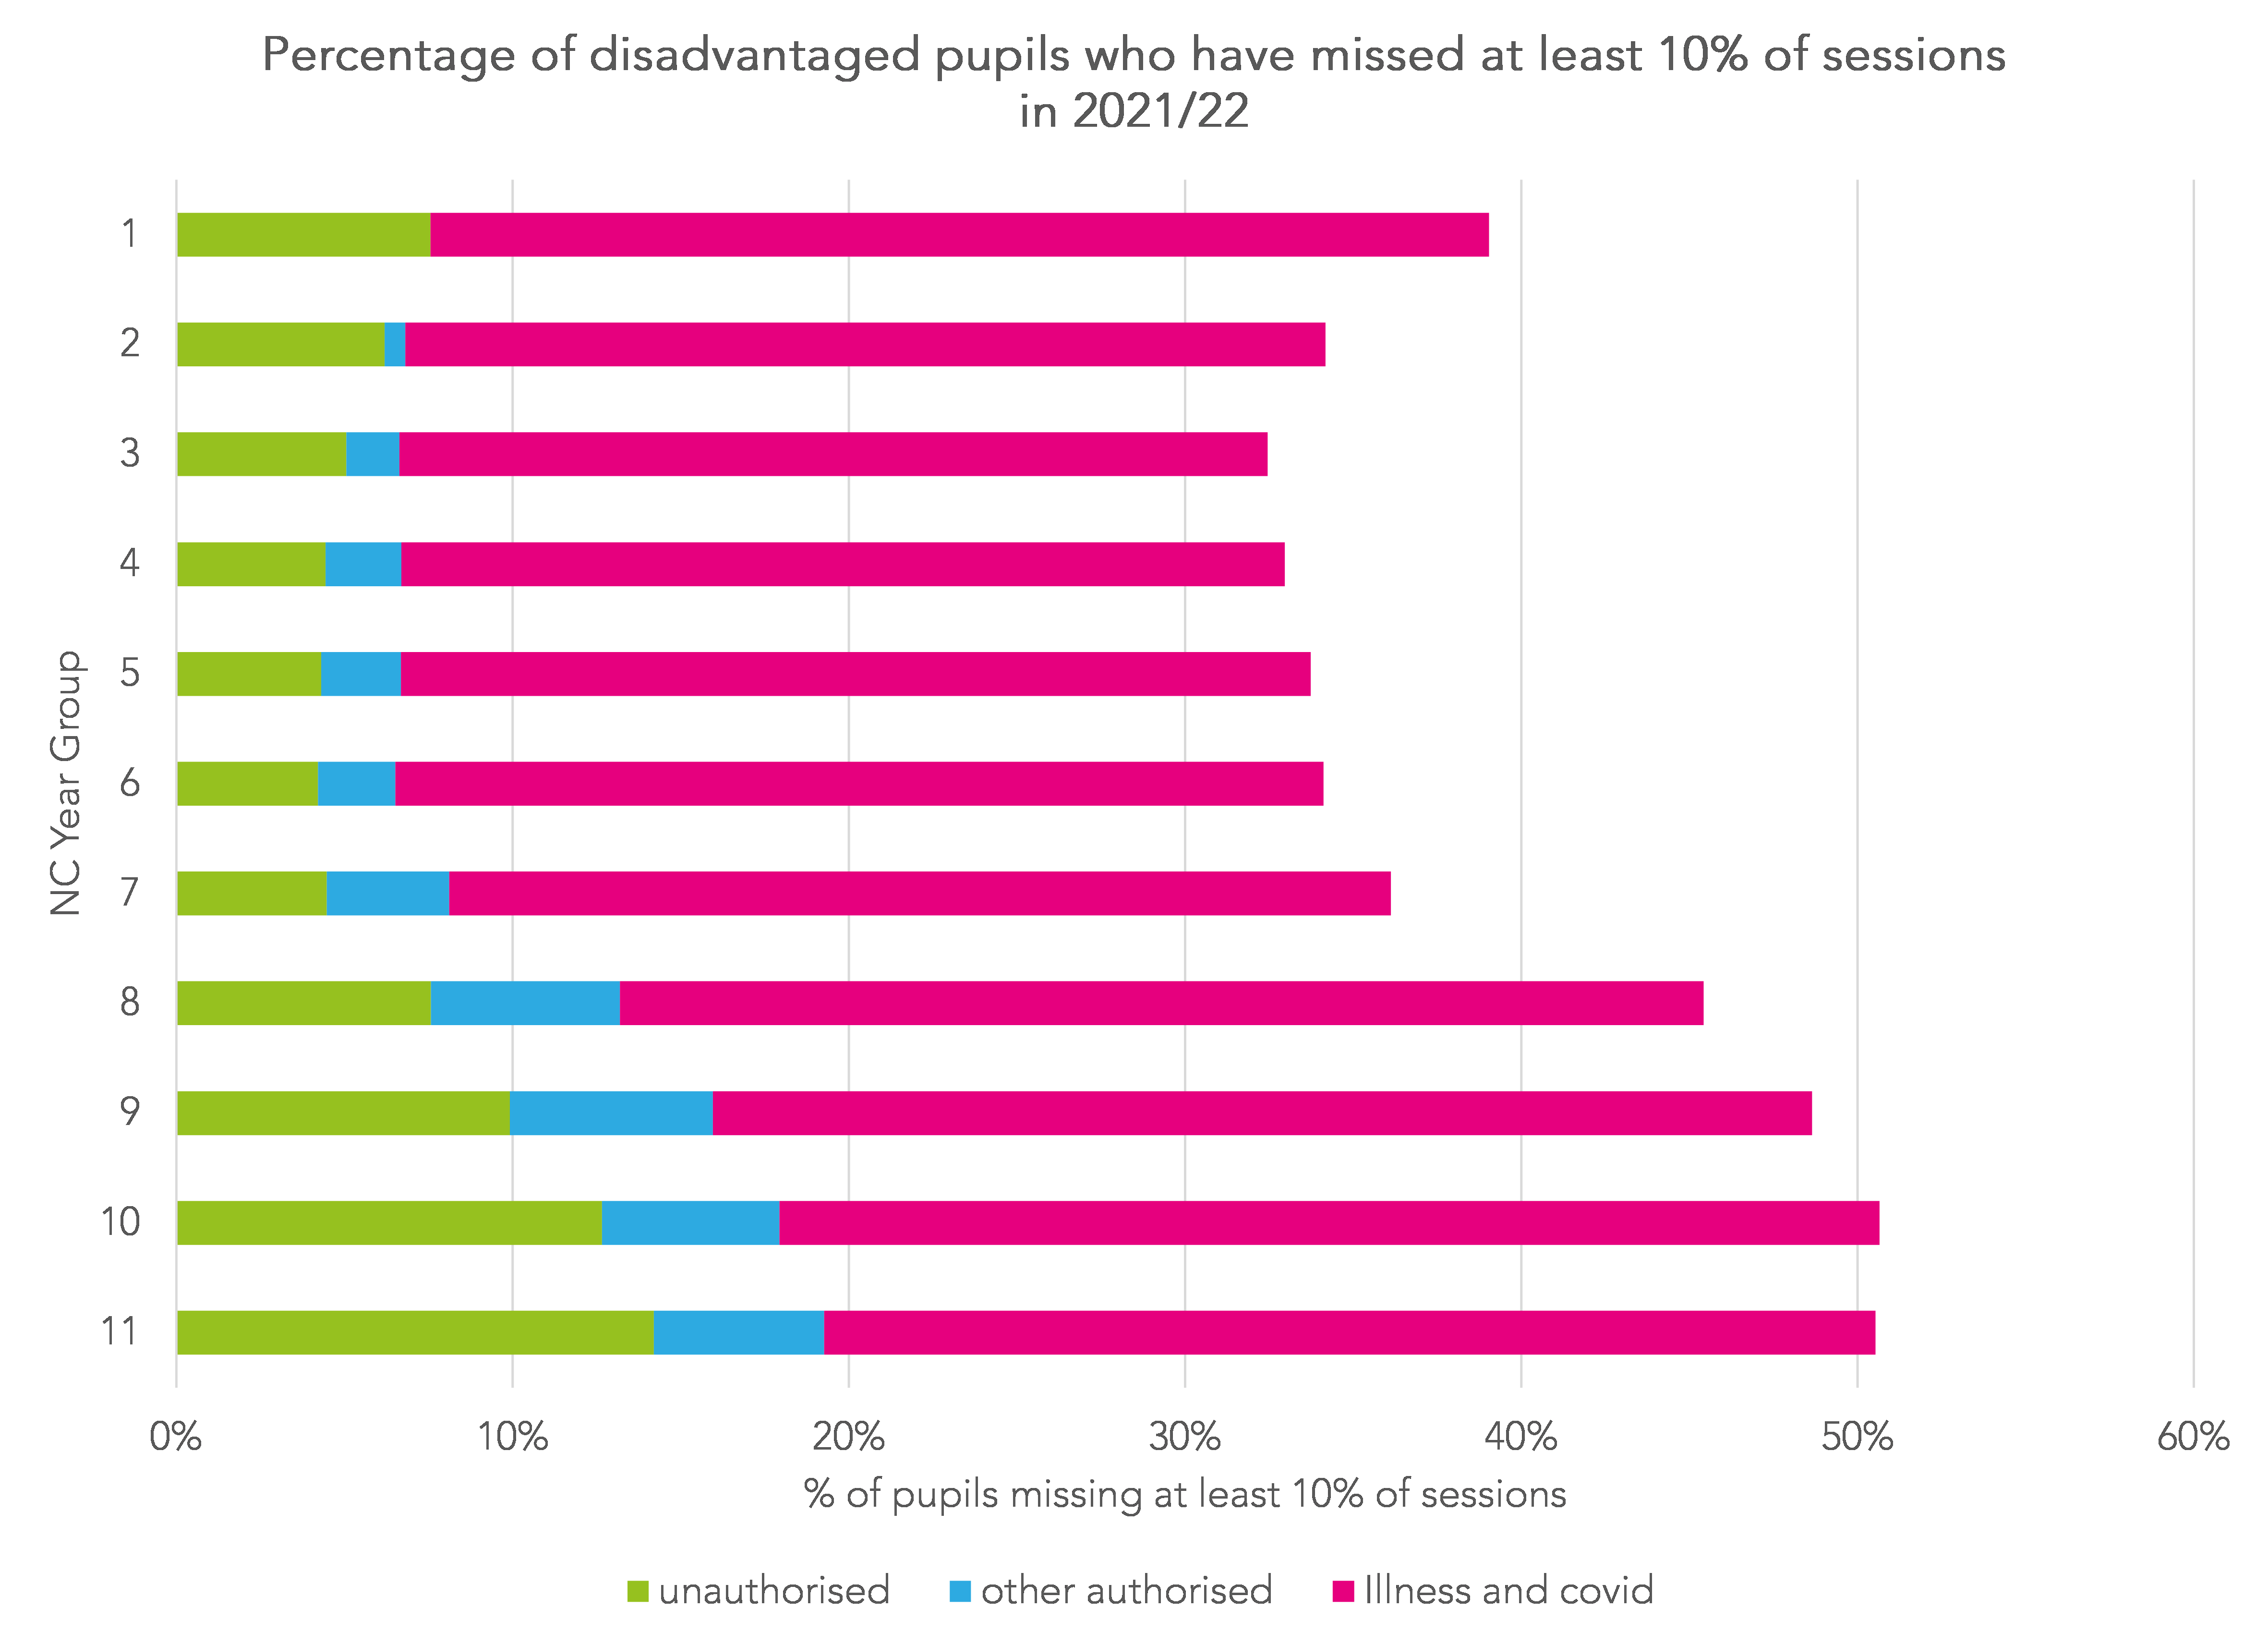
Persistent absence is higher among pupils in Years 8 to 11. Almost 50% of disadvantaged pupils in Years 10 and 11 have missed at least 10% of sessions. In fact, almost 20% have missed 10% of sessions based on unauthorised and authorised (excluding illness) absence. Among non-disadvantaged pupils these figures were 35% and 6% respectively.
As the chart below for non-disadvantaged pupils makes clear, disadvantaged pupils classified as persistent absentees are far more likely to be classified as such due to unauthorised absence.
Finally, we present a similar chart for pupils with EHC plans. The bars closely correspond to those for disadvantaged pupils in Years 7 to 11. Rates of persistent absence are higher in the primary year groups among pupils with EHC plans.
Persistent absence by region
To round things off, we show how persistent absence varies around the country.
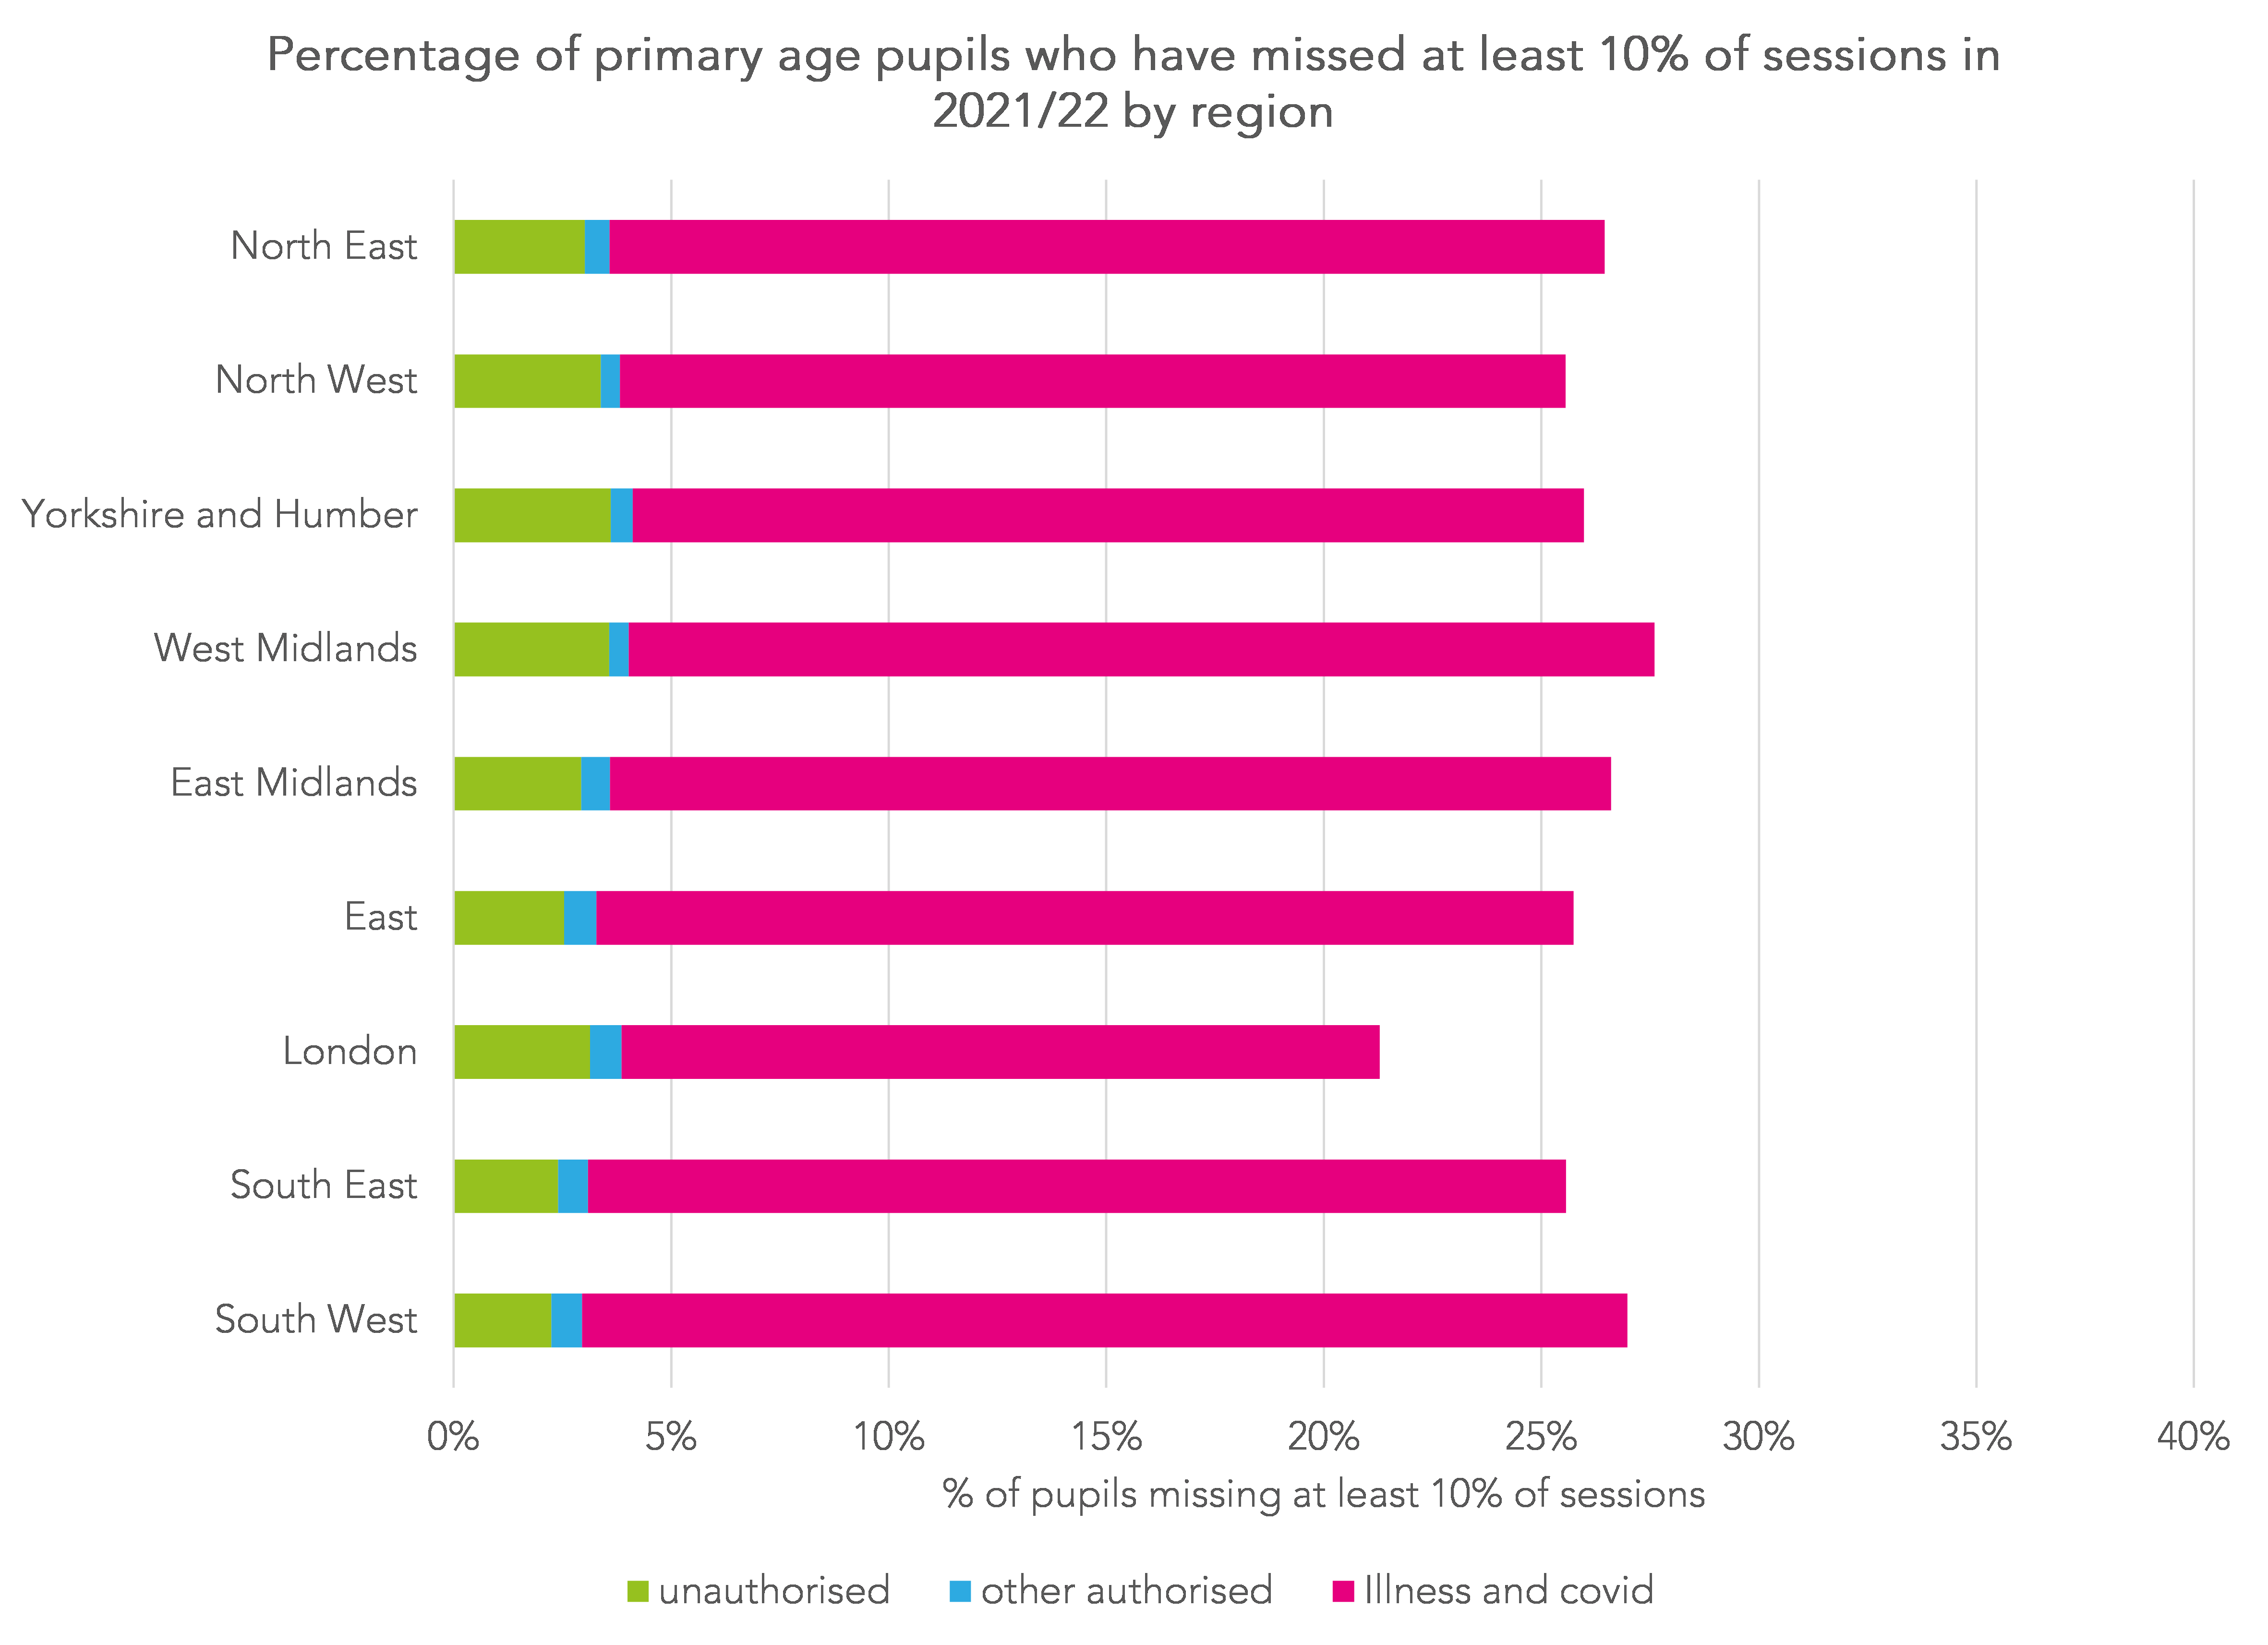
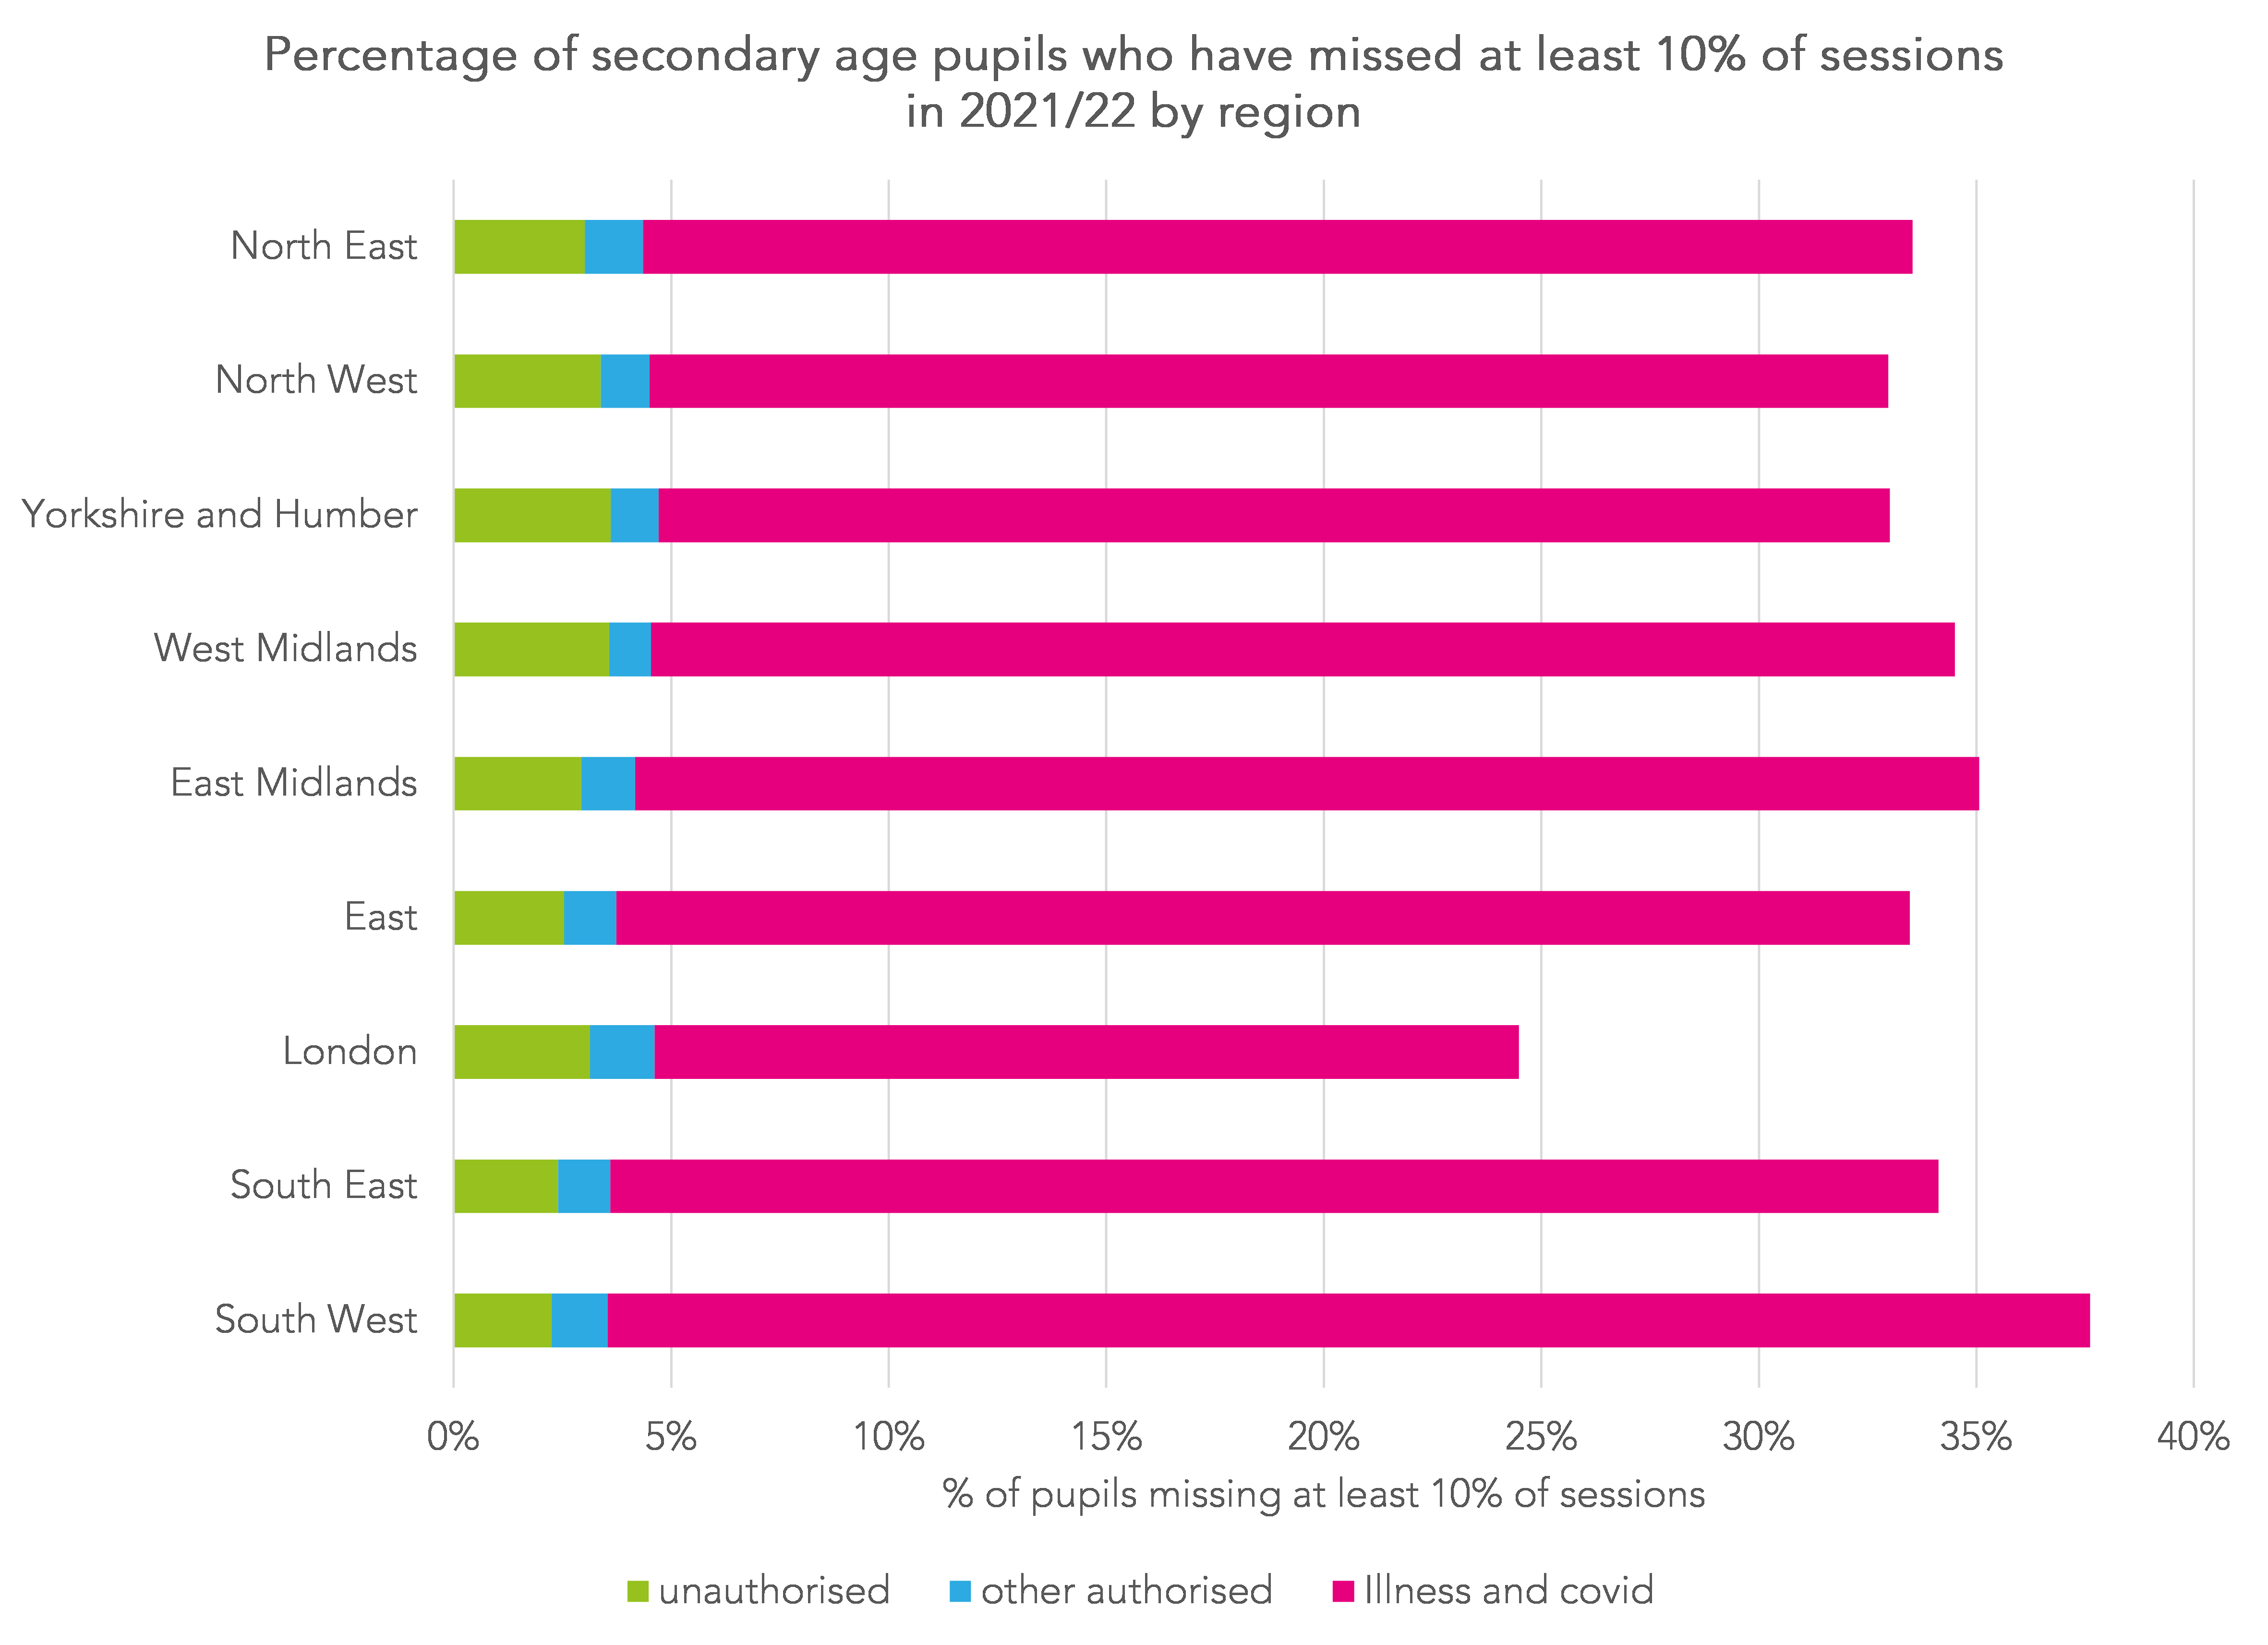
At both primary and secondary, London schools seem to have experienced the lowest rates of persistent absence overall. Whether this is due to demographic differences or lower infection rates (until recent weeks at least) we’ll have to leave for another day.
But the rate of persistent absentees due to unauthorised and authorised (excluding illness) absence in London is roughly the same (7%) as everywhere else. This rate was slightly higher at 9% in the North east, the most disadvantaged region.
Summing up
Undoubtedly there are large numbers of children who have missed a lot of school.
25% of primary age pupils and 35% of secondary age pupils have missed at least 10% of sessions so far this term.
It is unquestionably the case that most absence is due to illness. If we exclude illness and absences due to isolation then the persistent absence rates would fall to 4% and 7% respectively.
Scaling these numbers up to the full population would suggest there would be 140,000 persistent absentees in primary schools and 210,000 in secondary schools if we adopted this definition.
Moreover, these rates may fall further if reasons for absences currently flagged as unauthorised are established.
What isn’t known is how much illness is due to Covid and how much isn’t. It would seem to me that efforts to improve attendance won’t get very far until we know more about the nature of this illness.
Want to stay up-to-date with the latest research from FFT Education Datalab? Sign up to Datalab’s mailing list to get notifications about new blogposts, or to receive the team’s half-termly newsletter.


I find myself always concerned by stats like this. People have fought – and in some countries are still fighting – for the right to universal education.
But I have yet to find that much research about ‘why’ some demogs are more likely to be absent at all, and unauth absent specifically. Does anyone have knowledge (and details) of such research? If we know WHAT we need to know WHY so we can work out HOW to change…