In this blogpost we’re going to look at the relationship between secondary school inspection outcomes and Progress 8 scores.
Both are imperfect proxy measures of school quality and so we might expect them to be related.
But how closely are they related? And has that changed since the return of performance data?
Interruptions due to COVID-19
The COVID-19 pandemic interrupted both inspection and national tests and examinations.
Progress 8 was published in 2022 for the first time since the end of the 2018/19 academic year.
Ofsted returned to routine full inspection of schools in September 2021 following a hiatus caused by the pandemic.
However, due to the cancellation of tests and exams, inspectors would not have had recent national end of Key Stage data at their disposal in the Inspection Data Summary Report (IDSR) during the 2021/22 academic year. This is used by inspection teams preparing for inspection.
National tests at Key Stage 2 and public examinations at Key Stage 4 returned in summer 2022. Consequently, recent data would have been available to teams carrying out inspections in Autumn 2022. Or at least inspections carried out on or after 19th October for primary schools or 16th November for secondary schools after IDSR updates. In the case of secondary schools, DfE had made available some limited data available on the 20th October on its School Performance Tables website.
IDSR presents a number of health warnings about the interpretation of data for the 2022 year, including not comparing schools and not comparing 2022 to 2019, both as a result of the uneven effect of the pandemic.
Data
We use management information published by Ofsted as the source of inspection outcome data. Specifically, we use the most recent inspection for each school. We only consider Section 5 outcomes, i.e. those that result in the award of a judgment for overall effectiveness.
We link each school’s most recent inspection outcome to their Progress 8 score using data from the School Performance Tables website.
We limit our analysis to those schools:
- whose most recent inspection took place in September 2021 or later;
- whose most recent inspection was a Section 5 inspection; and
- who we have linked to published 2022 Progress 8 data.
The latest inspection start date for any school in our sample was 9th November 2022.
Some schools may have been inspected more than once during that time but we only use information on the most recent inspection.
Types of inspection
First, let’s see the types of inspection that have taken place over the four terms since September 2021.

We see that there were over 700 schools inspected during this period. Almost half were Section 5 full inspections although there were a large number of re-inspection visits of schools graded requires improvement (RI). There were proportionately fewer of these in the Autumn 2023 term compared to the previous academic year.
Comparison with Progress 8 scores
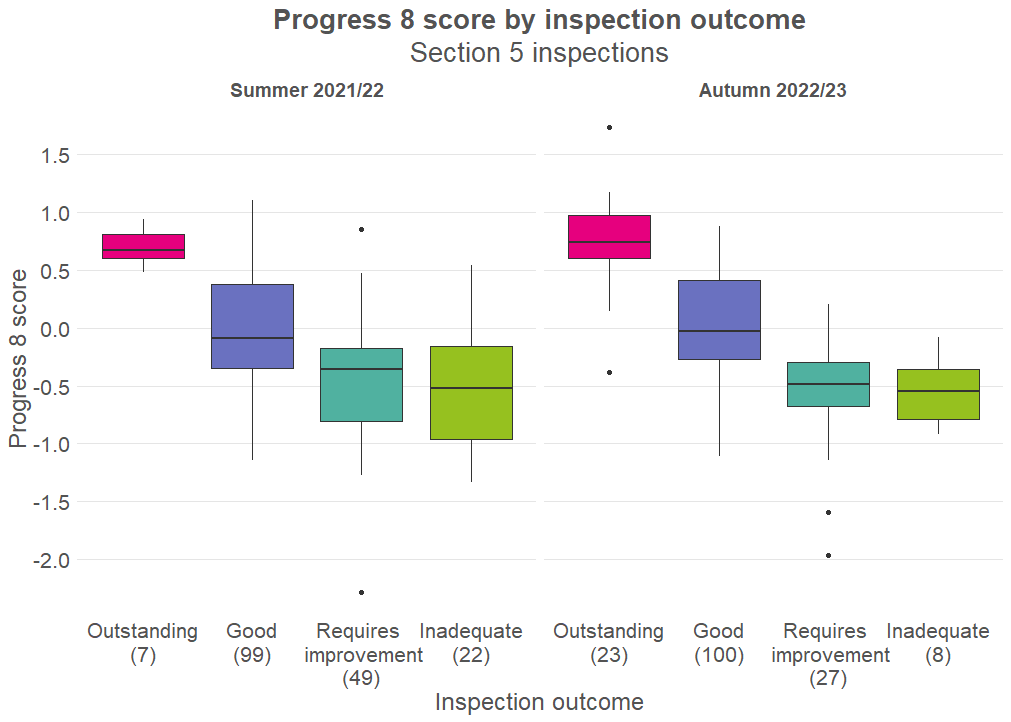
The boxplots below show the spread of Progress 8 scores for schools based on their overall inspection outcome.
How to interpret a box plot
The charts used here are box plots, a type of chart which most people are likely to recognise – but the details of which we may not all remember.
The line across the middle of the box is the median – the value which exactly half of results fall below, and the other half fall above. The box itself shows the range between the lower quartile – the value below which exactly a quarter of results fall – and the upper quartile – the value above which exactly a quarter of results fall. This definition means that exactly 50% of results are within the range of values covered by the box.
The difference between the lower quartile and the upper quartile is the inter-quartile range. The whiskers stretching out from the box reach to the maximum and minimum values, excluding outliers, which are shown as dots. Outliers are defined as results more than 1.5 times the inter-quartile range away from either the lower or upper quartile.
The plot on the left shows schools inspected on the Summer term of 2021/22 while that on the right shows those inspected in the Autumn term of 2022/23.
We see, as we might expect, a relationship between inspection outcome and Progress 8. Outstanding schools tend to achieve higher Progress 8 scores than good schools which in turn tend to achieve higher scores than RI and inadequate schools.
Although the distributions of P8 scores overlap considerably between RI and inadequate schools, there are fairly clear divisions (at least in terms of the boxes representing the interquartile ranges) of the other outcomes.
Looking at the chart for Autumn 2022/23, we can make out that schools with Progress 8 scores of 0.62 or higher tend to be judged outstanding while those with a score of -0.32 or lower tend to be judged RI or inadequate.
We can calculate the Spearman rank correlation between inspection outcome and Progress 8 to give us a measure of association between the two.
In Summer 2021/22, this stood at 0.43.
But in Autumn 2022/23 it increased to 0.66, indicating a stronger association.
For completeness, the correlation coefficients for Autumn 2021/22 and Spring 2021/22 were 0.50 and 0.40 respectively.
And for inspections which took place in 2019/2020 prior to the pandemic, the correlation with Progress 8 from 2019 was 0.54.
Ideally we would have restricted the Autumn 2022/23 analysis to just those schools which were inspected on or after 20th October 2022 (after the publication of Progress 8 data) to see whether these findings hold. There were only 26 of these in the most recent data so we will return to this another day.
Summing up
We’ve analysed the relationship between inspection outcomes and 2022 Progress 8 scores for schools which were inspected either side of the summer holiday last year.
The relationship between the two was stronger in Autumn 2022/23 than Summer 2021/22.
As a rule of thumb, schools with Progress 8 scores of 0.62 or higher tend to be judged outstanding while those with a score of -0.32 or lower tend to be judged RI or inadequate.
That said, these simple rules would only result in correctly classifying 72% of schools inspected in Autumn 2022/23. If we had simply guessed that a school would be judged good we would have correctly classified 63%.
But we will see whether this figure increases as more inspection data is published.
Want to stay up-to-date with the latest research from FFT Education Datalab? Sign up to Datalab’s mailing list to get notifications about new blogposts, or to receive the team’s half-termly newsletter.


Leave A Comment