The Timpson Review of 2019 identified a number of risk factors of permanent exclusion.
These included some types of special educational needs (SEN), being a boy, being disadvantaged and a history of involvement with social services.
We subsequently updated this work using more recent data, identifying additional factors including a history of SEN and low levels of early literacy (at Key Stage 1).
In this article, we expand upon this work by tracking a single cohort from the end of primary school to the end of secondary school.
We identify three key variables that are associated with secondary school exclusion: history of exclusion and suspension in primary school, history of involvement with Social Care, and economic disadvantage. We analyse how secondary school exclusion rates vary with respect to these and other pupil characteristics.
Data
Using National Pupil Database, we track a cohort from the end of primary school in 2016/17 to the end of compulsory education in 2021/22.
1.0% of boys and 0.4% of girls in the cohort were permanently excluded during secondary education. We should note here that these figures may have been higher had the COVID-19 pandemic not taken place. This cohort of pupils would have been in Years 9 and 10 in 2019/20 and 2020/21 during which there were national lockdowns and a corresponding drop in the exclusion rate. The impact would be greatest for this cohort as Years 9 and 10 are the years in which exclusions are most likely.
That caveat notwithstanding, we examine how the risk of exclusion varies with respect to a range of pupil characteristics summarizing pupils’ school and social care histories up to the end of Year 6 (academic age 10). In addition to gender these include:
- Exclusions and suspensions
- Ever permanently excluded
- Ever suspended
- Number of previous suspensions
- Social Care
- Ever looked after (CLA)
- Ever in need (CIN)
- Number of referrals to social services
- % of terms eligible for free school meals (FSM) from Reception to Year 6
- Persistently absent (missing 10% or more of sessions) in Year 5 or Year 6
- Special educational needs
- Highest level of support Reception to Year 6 (SEN Support or EHCP)
- Primary SEN type in Year 6
- Ever identified with social, emotional or mental health (SEMH) needs
- Age first identified with SEN
- Attainment
- EYFS Good Level of Development
- KS1 reading
- KS2 reading
- Ethnic background
- Government office region (GOR) of school attended in Year 6
Relative Influence of Variables
We firstly examine the relative influence of each pupil characteristic alongside all other characteristics using gradient boosted regression models[1].
The relative influence of each variable is shown in the table below and the variables we use are listed in Table 2 of the statistical annex.

By far the variable most predictive of secondary school exclusion of all those included is a history of permanent exclusion or suspension during primary school. Social care history and free school meal history are also relatively important.
The caveat we make here is that the measures shown in Table 1 are relative measures. They measure the importance of variables relative to each other. It is not necessarily the case that these variables are particularly predictive of exclusion at secondary school. We turn to this now.
The interaction of exclusion and suspension history, social care history and free school meals history
In the Venn diagrams below, we firstly divide boys and girls in our cohort into three groups:
- Excluded or suspended during primary school
- Ever in care or in need during primary school
- Ever eligible for free school meals during primary school
We then summarise the percentage of pupils in each group who experienced permanent exclusion during secondary school.
Boys- risk of secondary school exclusion

Girls- risk of secondary school exclusion
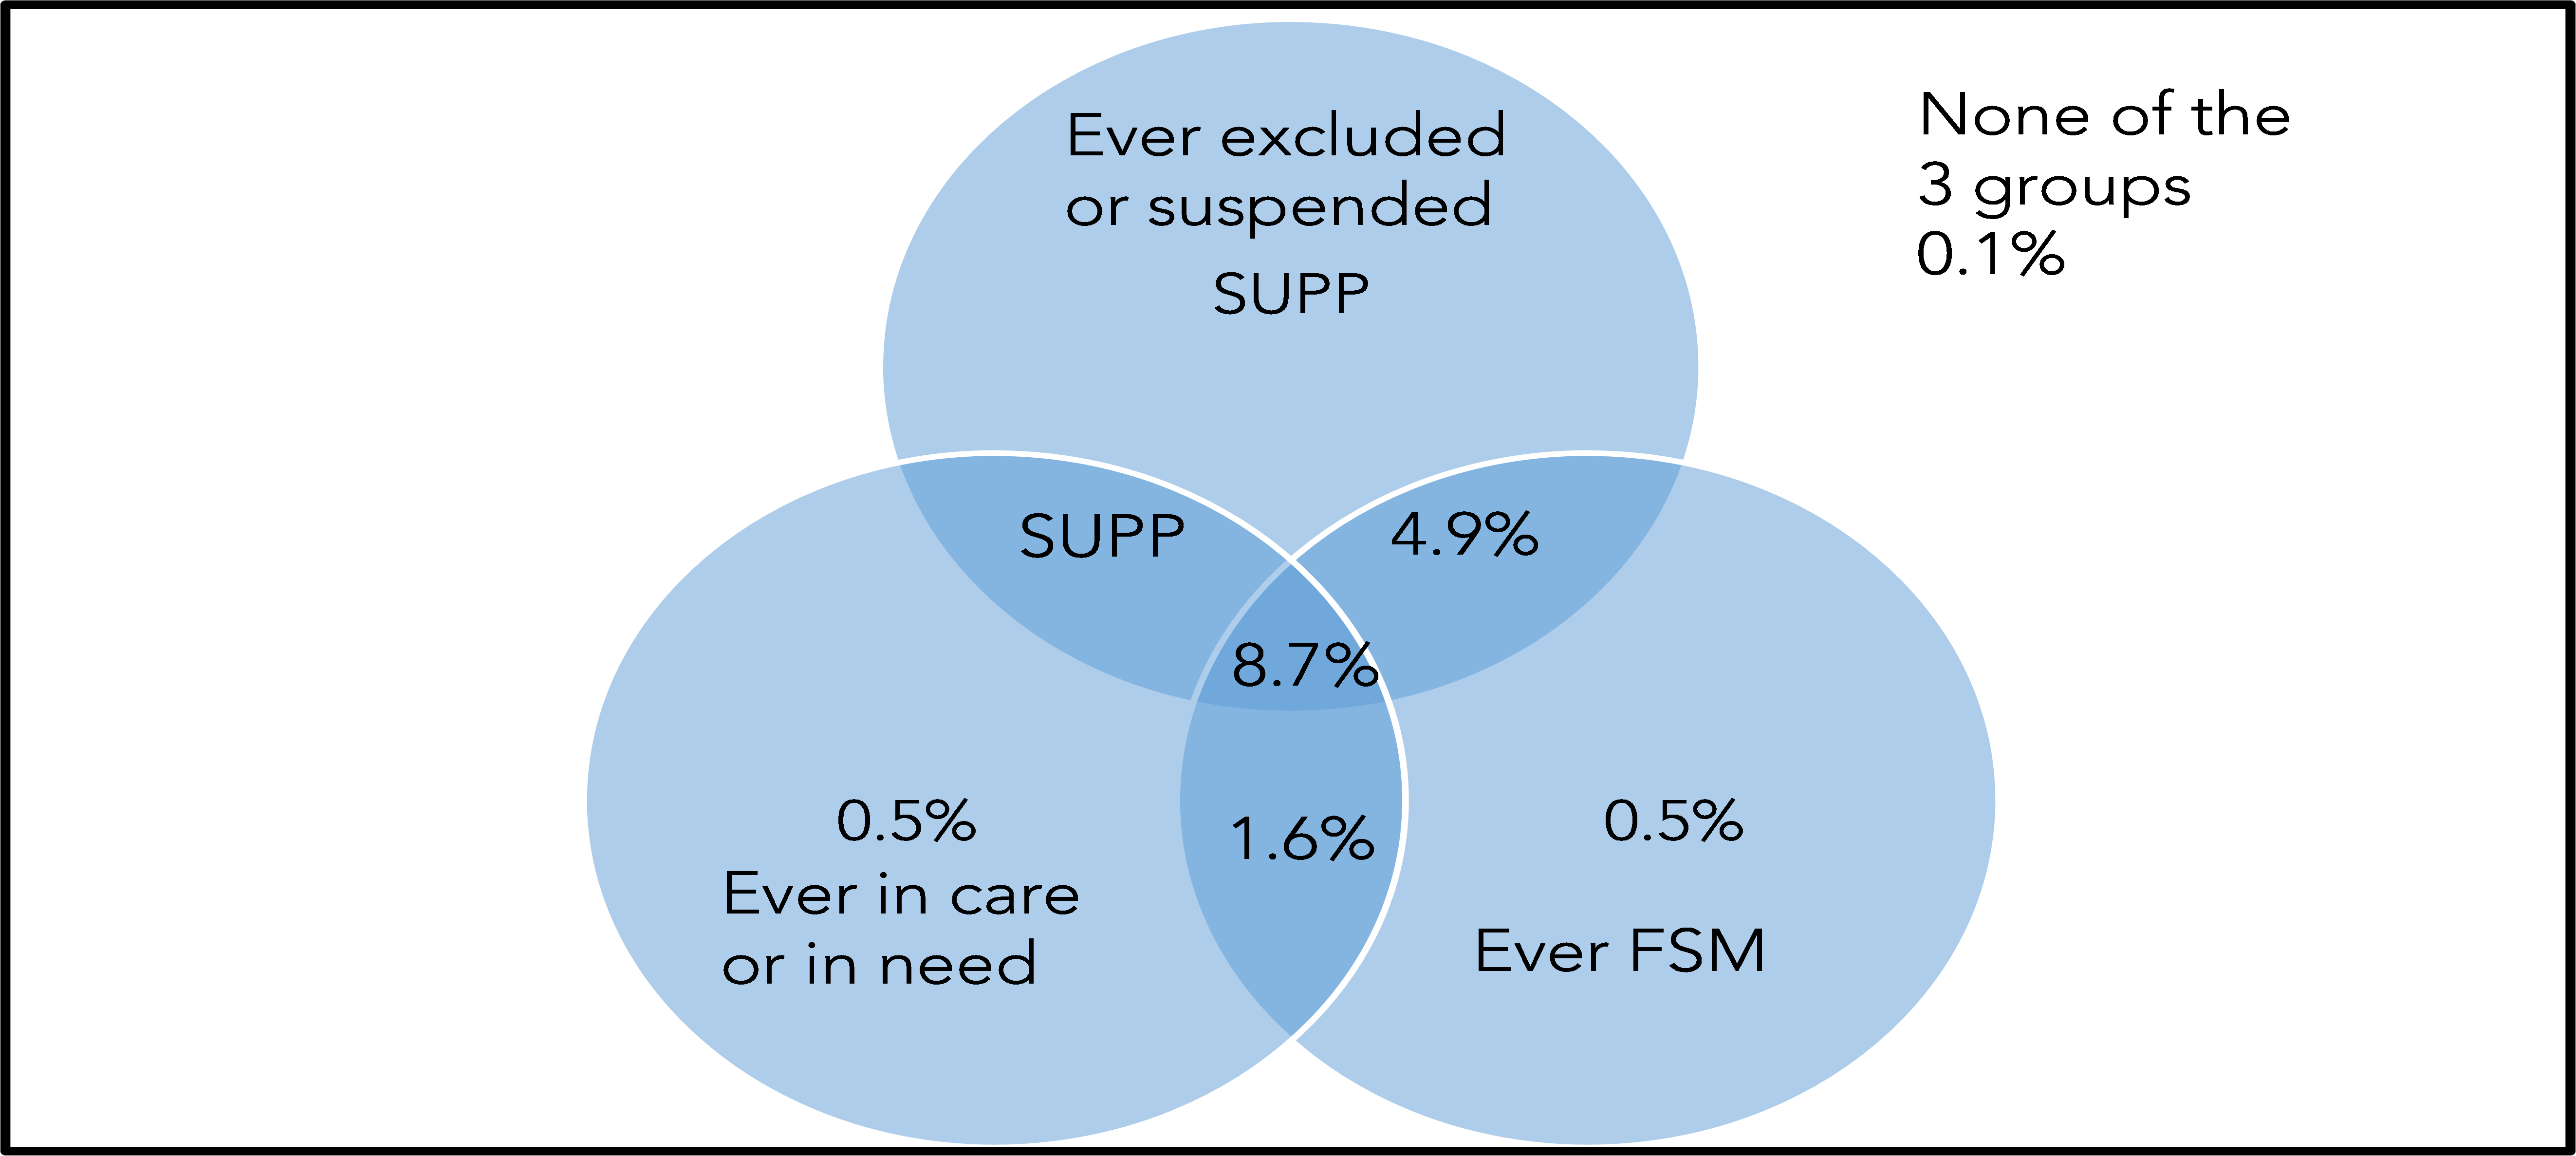
8.9% of boys and 8.7% of girls with a history of being excluded or suspended AND being in care/ in need AND eligible for free school meals during primary school were permanently excluded during secondary school.
This compares to 0.3% of boys and 0.1% of girls who were never excluded or suspended, in care or in need, or eligible for free schools during primary school.
This difference, in relative terms, is extremely high. Boys are 27 times more likely and girls 88 times more likely to be excluded if they belong to all three groups than if they belong to none.
That said, the risk of exclusion, even for those in all three groups, remains low in absolute terms. Pupils in all three groups are still far more likely NOT to be excluded than to be.
Other pupil characteristics
Next, we show how the risk of exclusion varies with respect to other pupil characteristics.
We do this in two ways. Firstly, we show the number (and rate) of permanent exclusions for each characteristic. Secondly, we compare the rate of exclusion with an expected rate. The expected rate controls for exclusion/ suspension history, free school meals history and social care history[2]. This identifies characteristics which are associated with a greater or lesser probability of exclusion over and above the three key variables.
Results are presented in Table 3 of the annex.
Characteristics associated with a greater risk of exclusion are:
- Being of a Gypsy/ Roma ethnic background
- Being of a Black Caribbean or Mixed/ White Black Caribbean ethnic background
- Being identified with social, emotional or mental health needs in Year 6
- Being a persistent absentee in Year 5 or Year 6
- First being identified with SEN between the ages of 9 and 11
- Attending a school in the North East
These characteristics are still associated with a higher rate of exclusion when compared with the expected rate that takes into account previous exclusion/ suspension, free school meal and social care history. However, the risk relative to other pupils is reduced.
Characteristics associated with a lower risk of exclusion are:
- Being of an Indian or Chinese ethnic background
- Above expected standard in reading at Key Stage 1 (and Key Stage 2)
- Being identified with Profound and Multiple Learning Difficulties or Multisensory Impairment in Year 6
Destinations of pupils not excluded during secondary education
Up to this point, we have analysed whether a permanent exclusion is recorded in NPD during secondary education.
However, we have not considered managed moves or other forms of so-called “grey” exclusion in which parents are encouraged to remove pupils from a school.
It is not possible to identify such moves in NPD with any degree of certainty. However, we can examine the end of Key Stage 4 destinations of pupils, which may reveal some clues.
To do this, we observe records in the 2022 Key Stage 4 data. In particular we pay attention to 2 fields
- Natres, which indicates that pupils are included in national Key Stage 4 results, regardless of whether they are counted in the results of any school
- Nftype, which indicates the type of setting attended.
Using nftype, we classify settings into the following groups:
- State-funded mainstream schools
- State-funded special schools
- State-funded Alternative Provision (AP) schools
- Other types of setting (including FE Colleges and independent schools)
Pupils are counted against each of the four groups above if they are included in national results (i.e. natres=1). All other pupils are considered to not have a destination. For this analysis, we only include pupils who were NOT permanently excluded during secondary school.
Results are presented in Table 4 of the annex.
Below, we show the percentage of pupils whose destination is a state-funded mainstream school, again using the Venn diagram format from the previous section.
Boys- destination is secondary mainstream
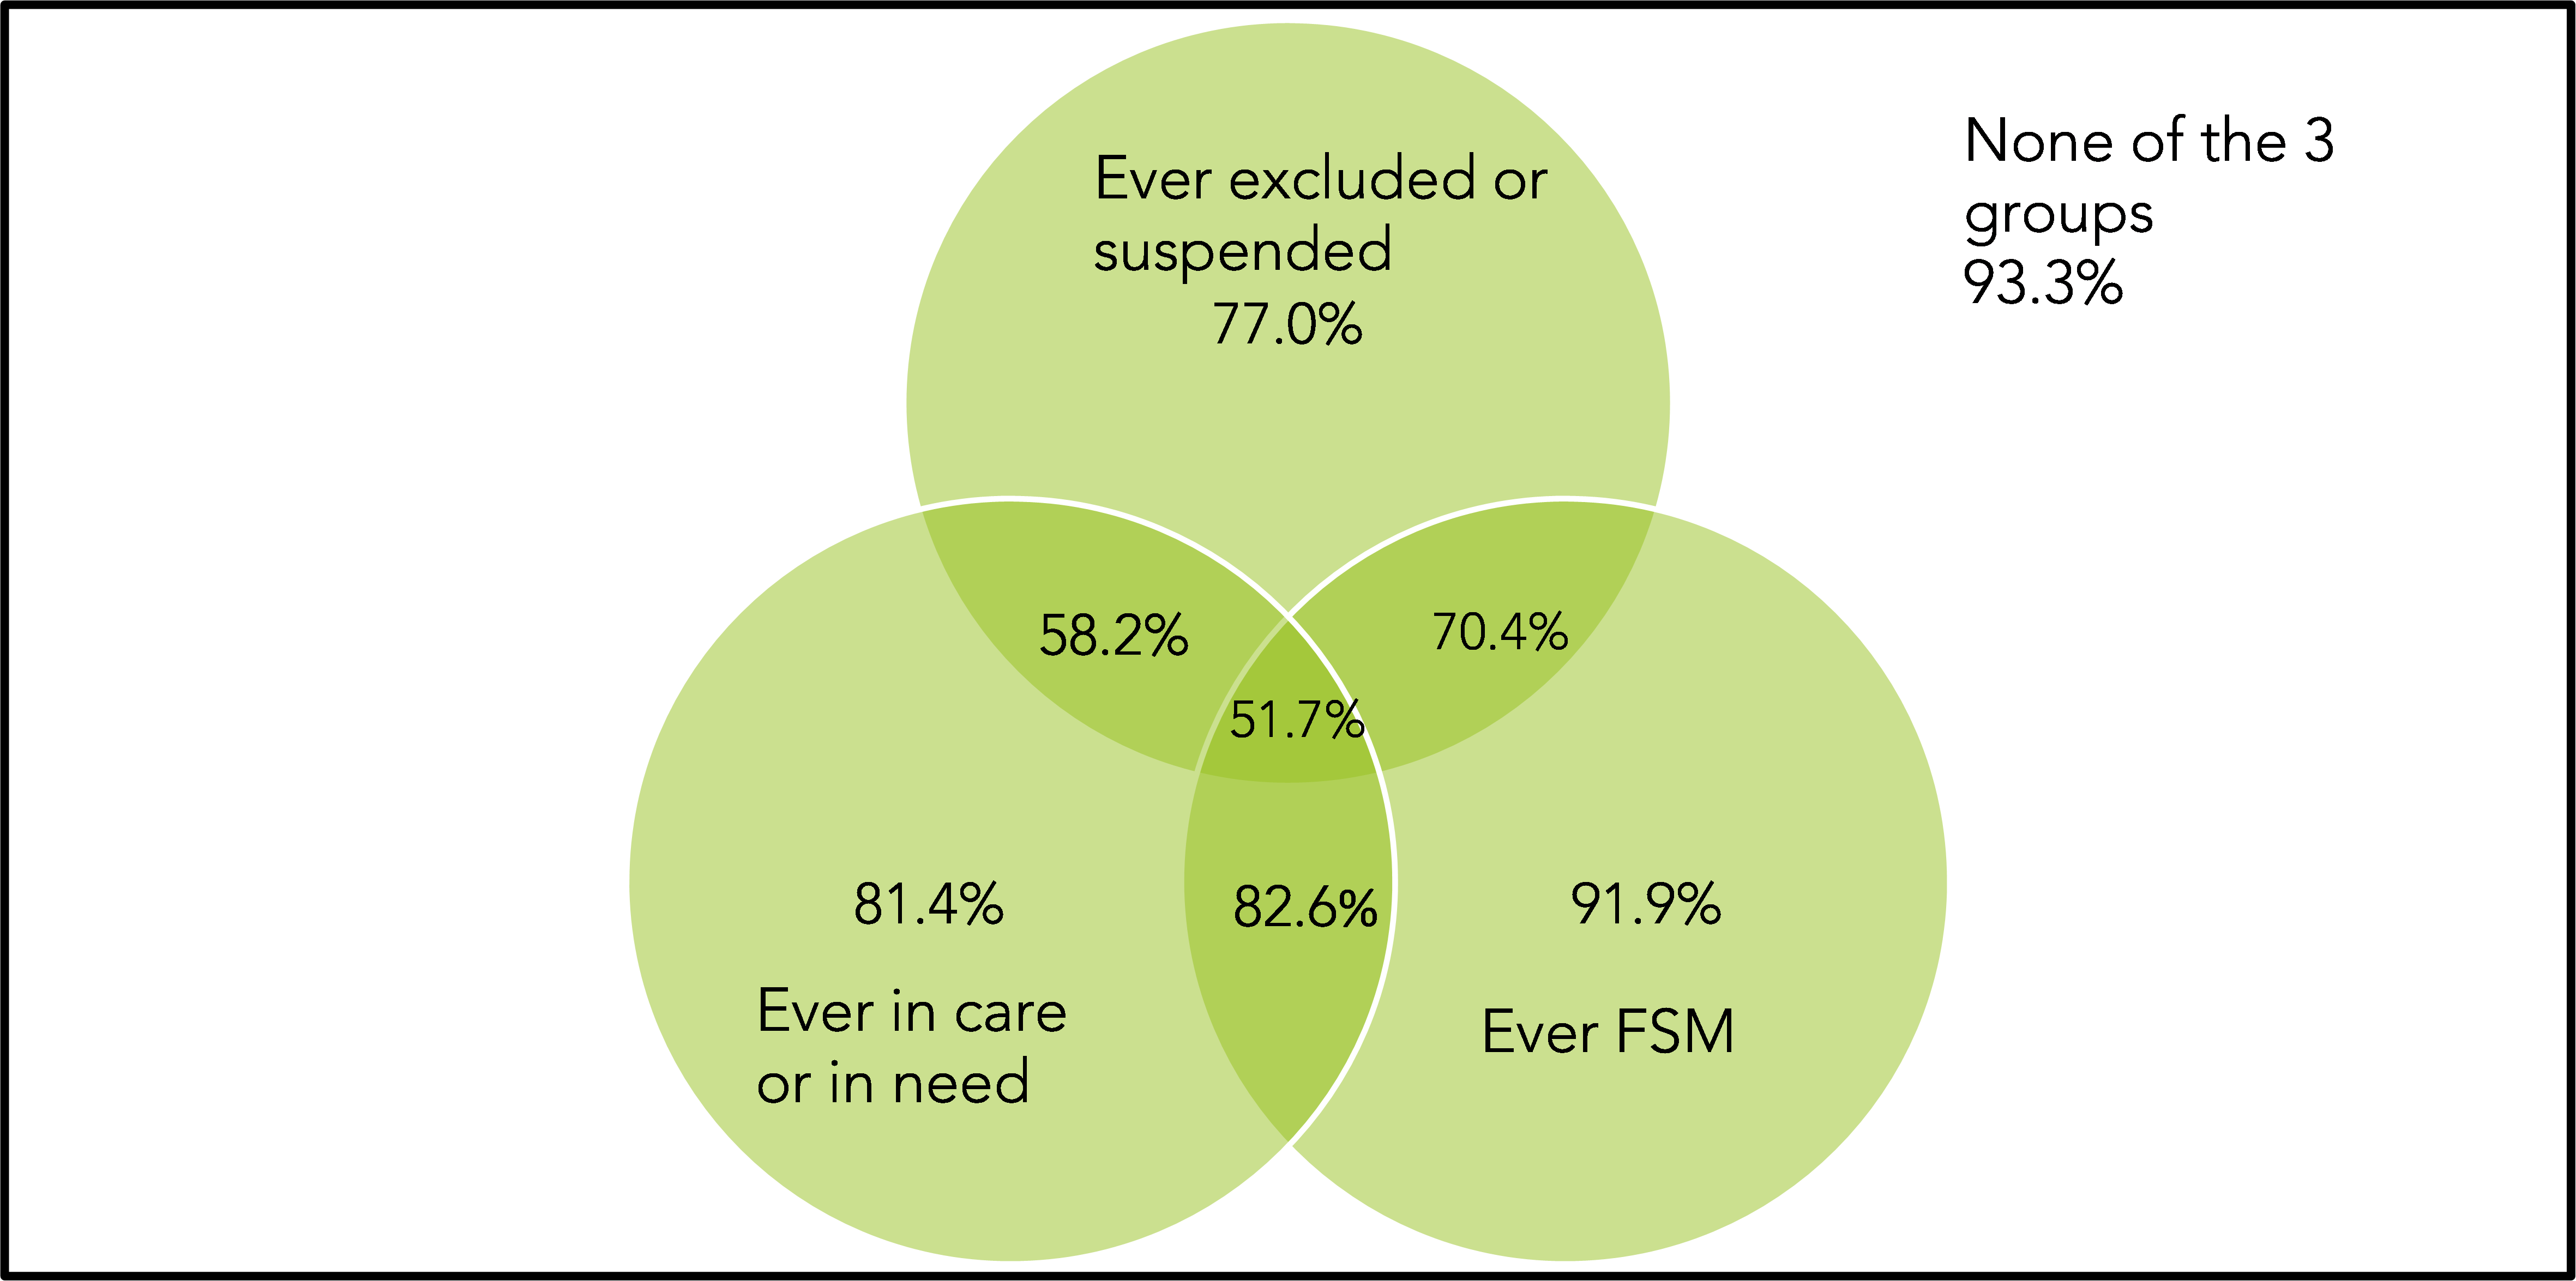
Girls- destination is secondary mainstream
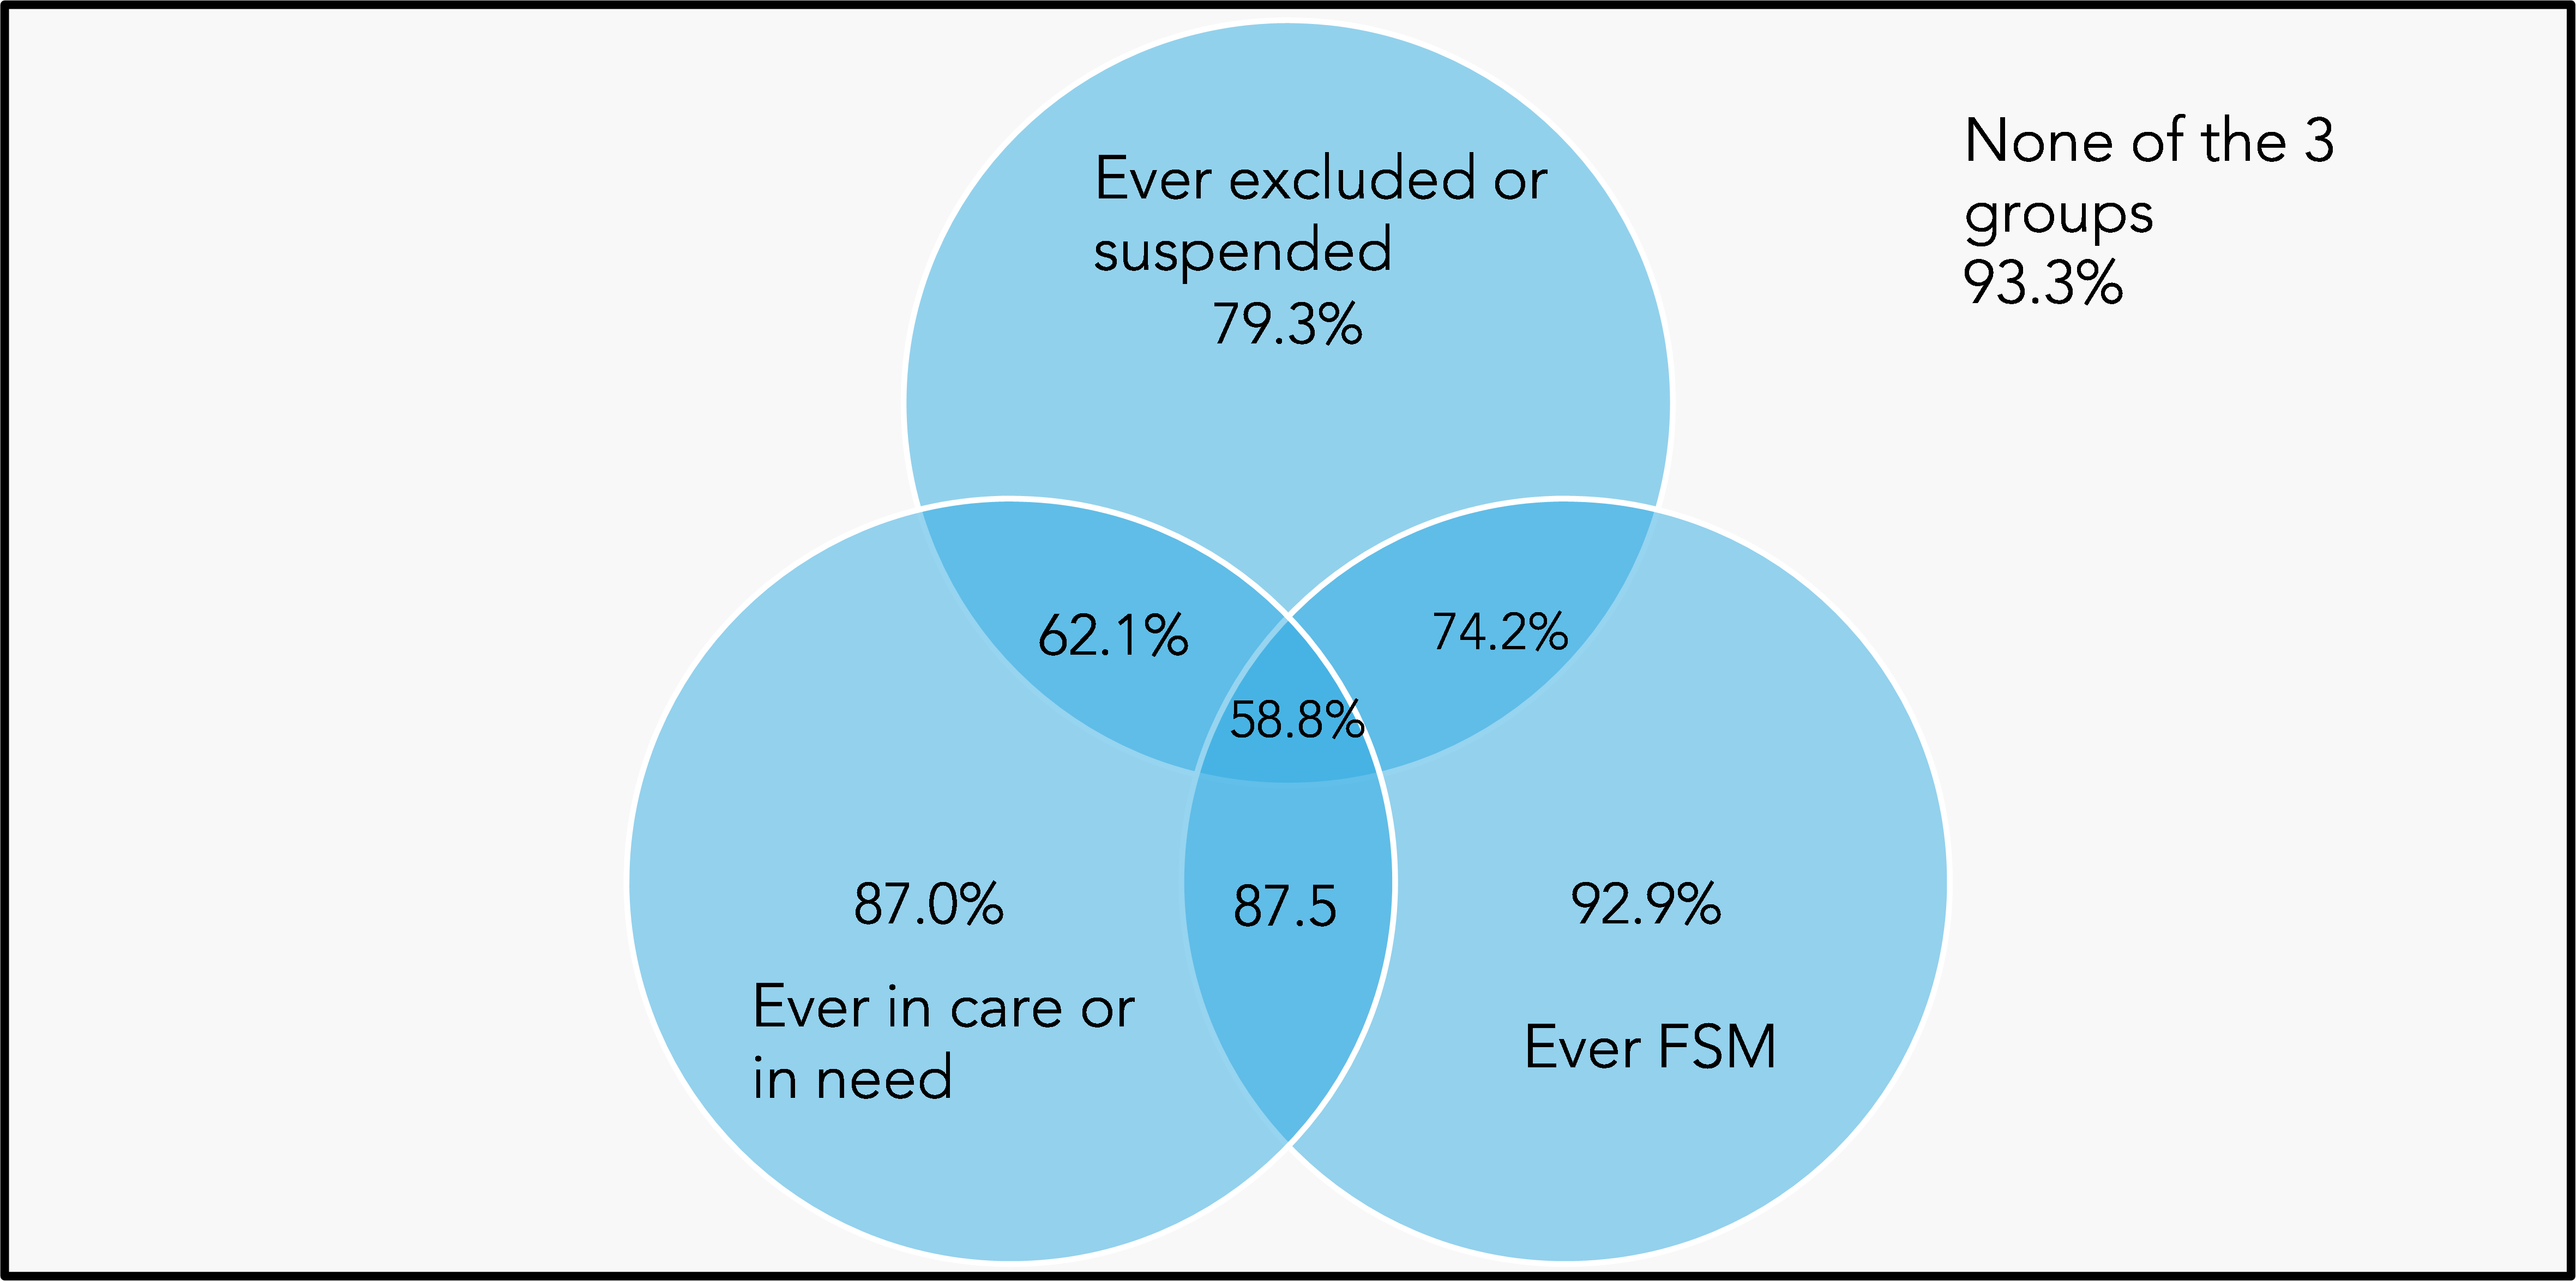
Among pupils who were not permanently excluded during secondary education, those with a history of exclusion or suspension at primary school were less likely to complete Key Stage 4 at a state-funded mainstream school. This was particularly the case among those with a history of being in care or in need during primary school.
52% of boys who had been excluded or suspended, being in care/ in need and eligible for free school meals during primary school completed Key Stage 4 at a state-funded mainstream school, not including pupils who were permanently excluded. Among similar girls this figure was 59%. This means that 48% of boys and 41% of girls with a history of exclusion / suspension, social care and free school meal eligibility either completed Key Stage 4 in a different type of setting or had no observed destination. The latter can occur as a result of emigration, moves to home education and, in rare cases, death.
More often than not, pupils from this group who do not complete Key Stage 4 in a state-funded mainstream school do so in a state-funded special school. By the end of secondary school, 48% to 49% of boys and 37% to 38% of girls with a history of primary school exclusion/ suspension and social care had an education, health and care (EHC) plan (Table 5 of the annex).
Summary
Only 2.6% of pupils experience exclusion or suspension during primary education but their outcomes are poor.
In particular, they face an increased risk of exclusion during secondary education, especially when coupled with disadvantage and involvement with social care. These three variables are the most predictive of secondary school exclusion.
However, the risk of exclusion during secondary school is still rare. Pupils who experience exclusion or suspension during primary school education are much more likely to not be excluded than to be.
That said, even among those who aren’t excluded during secondary education, a significant proportion of young people with a history of primary exclusion and suspension do not complete Key Stage 4 in the state-funded mainstream sector.
Given that the absolute risk of permanent exclusion during secondary school is low, even for pupils with a high relative risk, identifying pupils at risk based on data alone is best avoided. Nonetheless, it appears that many pupils who are permanently excluded or suspended during primary school tend to be disadvantaged in some way, be it economically, involvement of social care or special educational needs.
Consequently, improving the outcomes of this group of pupils will depend on services working together. How feasible this is given budget constraints facing schools and local authorities is beyond the scope of this article.
1. These models are fitted using the gbm package in R.
2. We fit a logistic regression model using stata of the following form:
logistic perm_ex_sec female i.soc_care i.fsm_band i.excl_grp i.soc_care#i.fsm_band i.soc_care#i.excl_grp i.excl_grp#i.soc_care i.excl_grp#c.female i.soc_care#c.female i.fsm_band#c.female
Want to stay up-to-date with the latest research from FFT Education Datalab? Sign up to Datalab’s mailing list to get notifications about new blogposts, or to receive the team’s half-termly newsletter.


Datalab and Dave at the very best here. Really insightful. Thank you.