The past few weeks have seen a renewed push on attendance from the DfE. One thing that caught our eye was this tweet from Baroness Barran, in which she talks about the importance of schools focussing on pupils who miss between 5% and 15% of sessions.
She explains in a follow-up tweet that schools might be better able to improve the attendance of these pupils, rather than focussing only on severely absent pupils (those who miss 50%+ of sessions) where a multi-agency response is often needed.
So we thought we’d look at this group of pupils with an absence rate of 5% to 15% in a bit more detail.
Data
As usual, we’ll be using data from our 10,000 Attendance Tracker schools. We’ll limit ourselves to state-funded mainstream schools in England. And we’ll be looking at the period of time between the start of Autumn Term and the end of Spring Term this year.
How many pupils are we talking about?
First things first, let’s look at how many pupils missed between 5% and 15% of sessions.
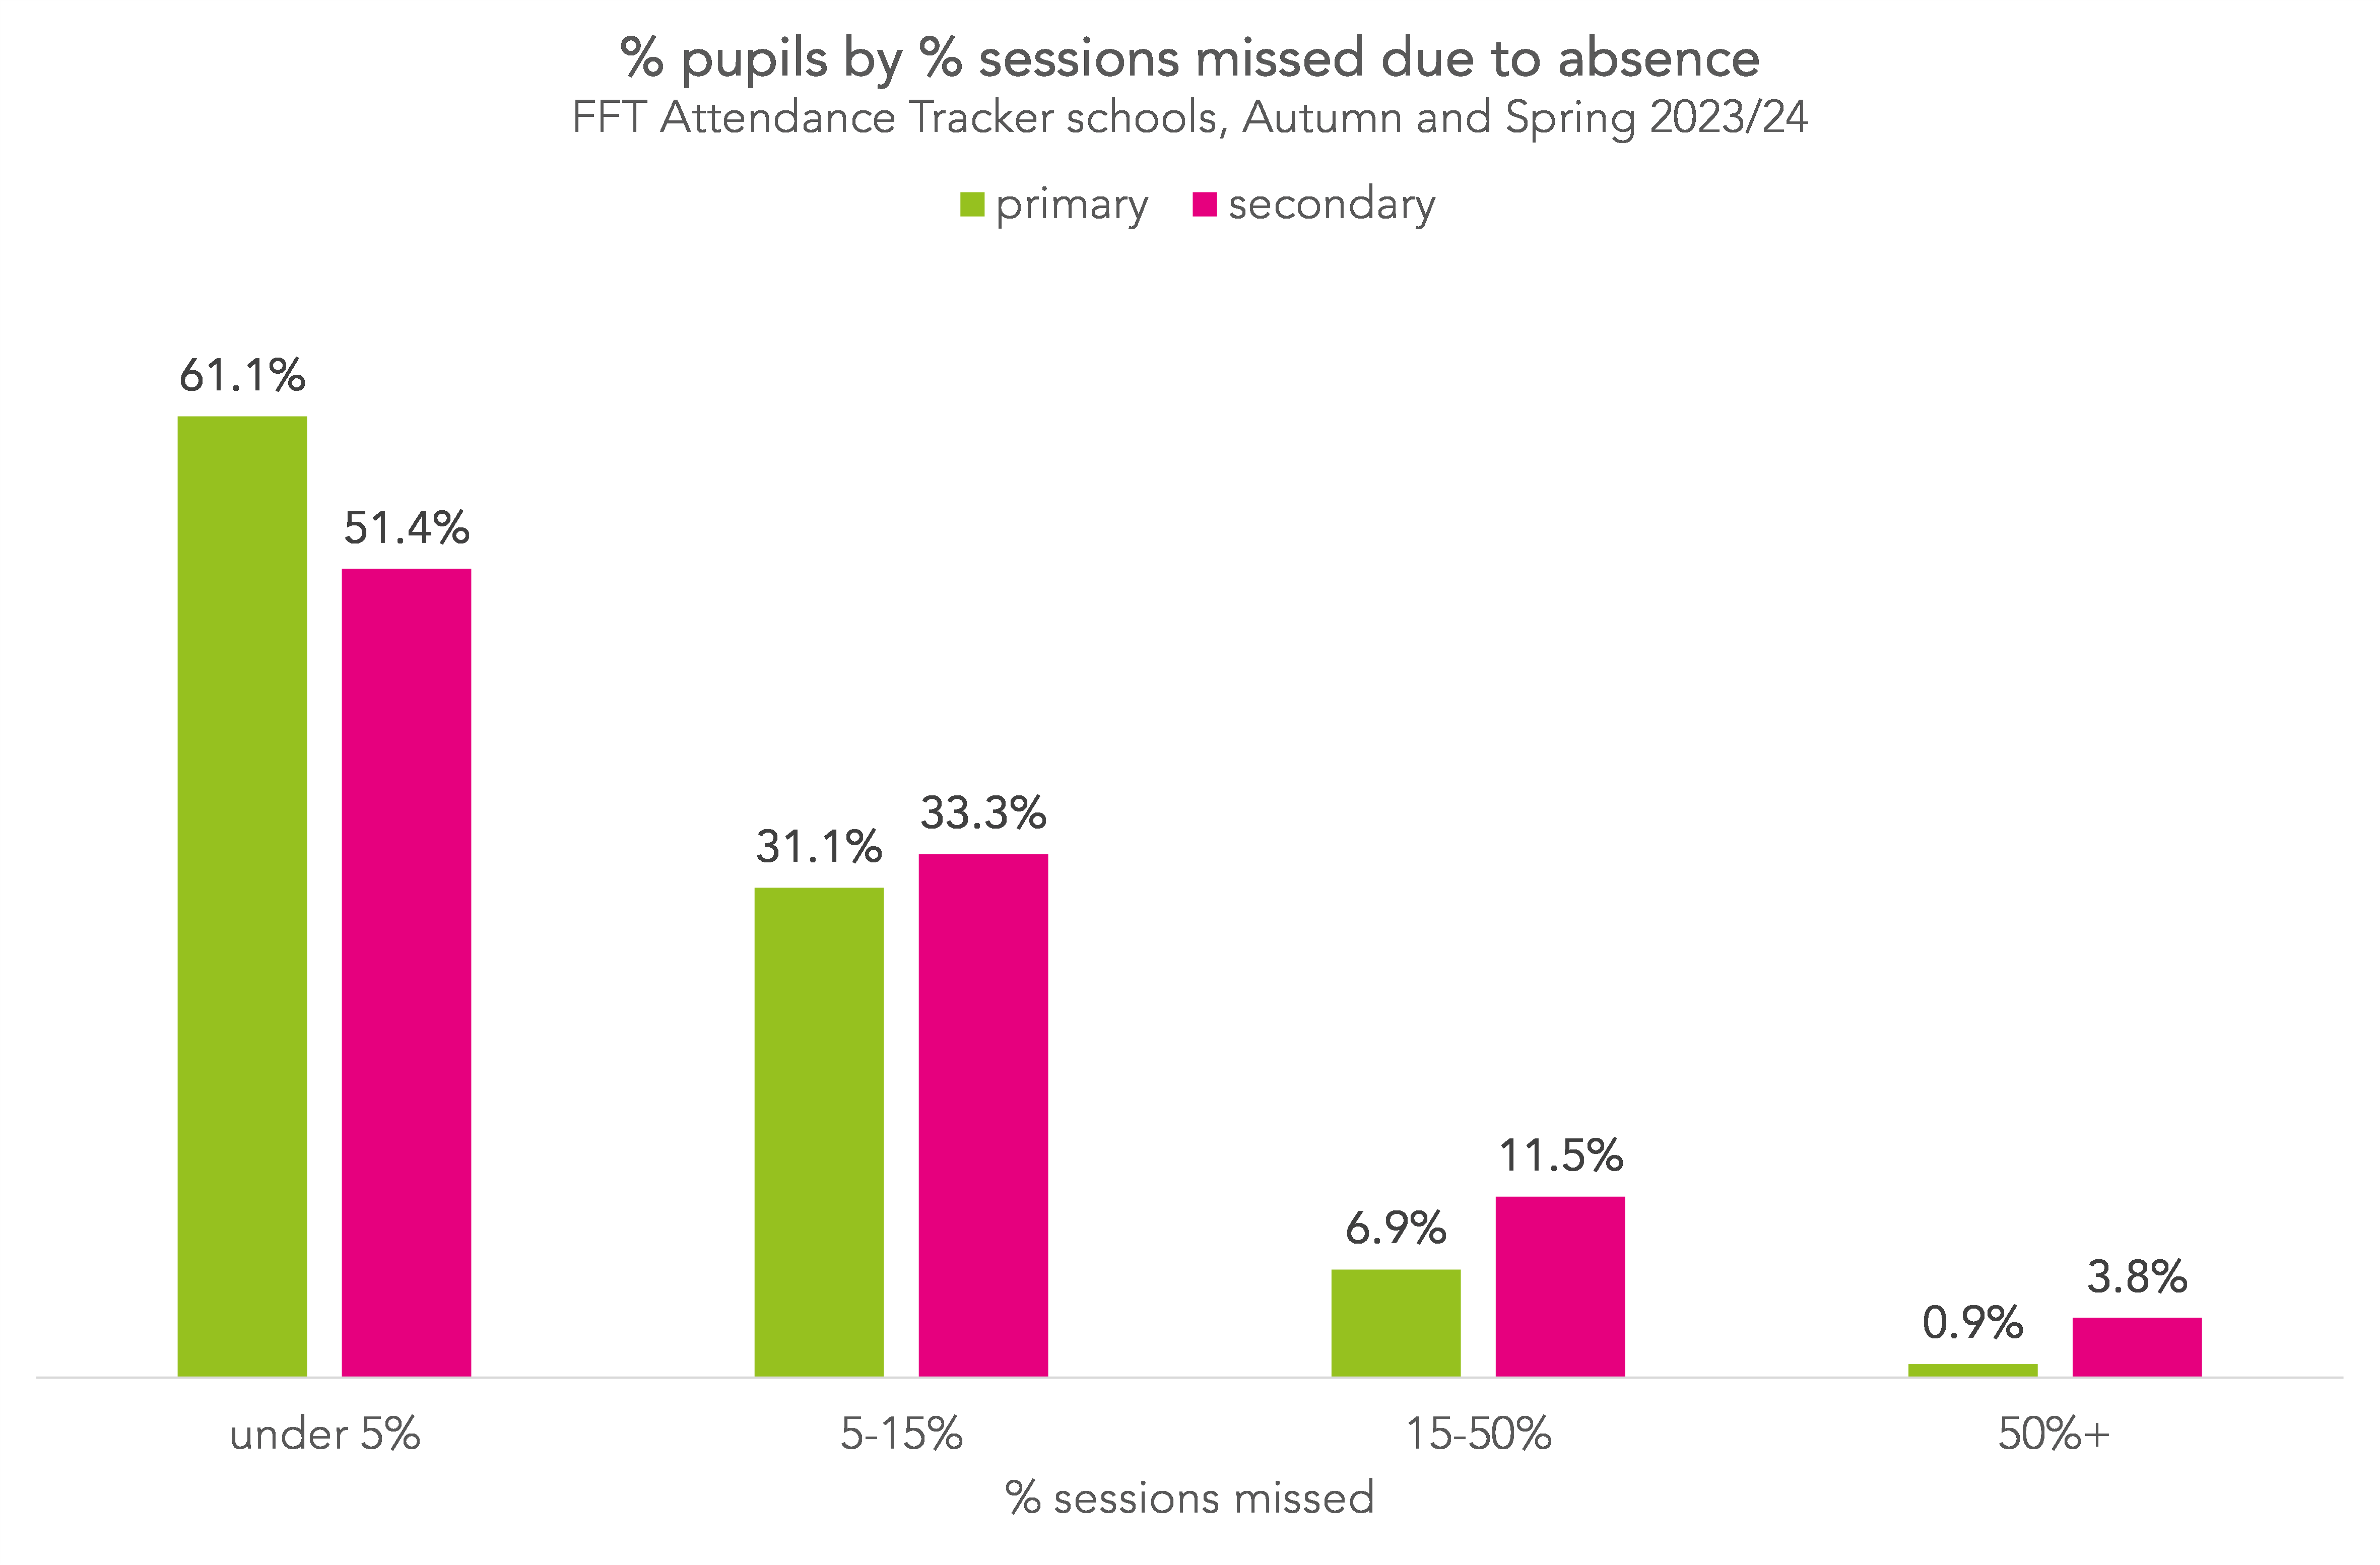
At both primary and secondary, the majority of pupils missed less than 5% of sessions – 61% of primary and 51% of secondary pupils. Around a third missed between 5% and 15% of sessions – 31% at primary and 33% at secondary. And around 8% of primary and 15% of secondary pupils missed more than 15% of sessions.
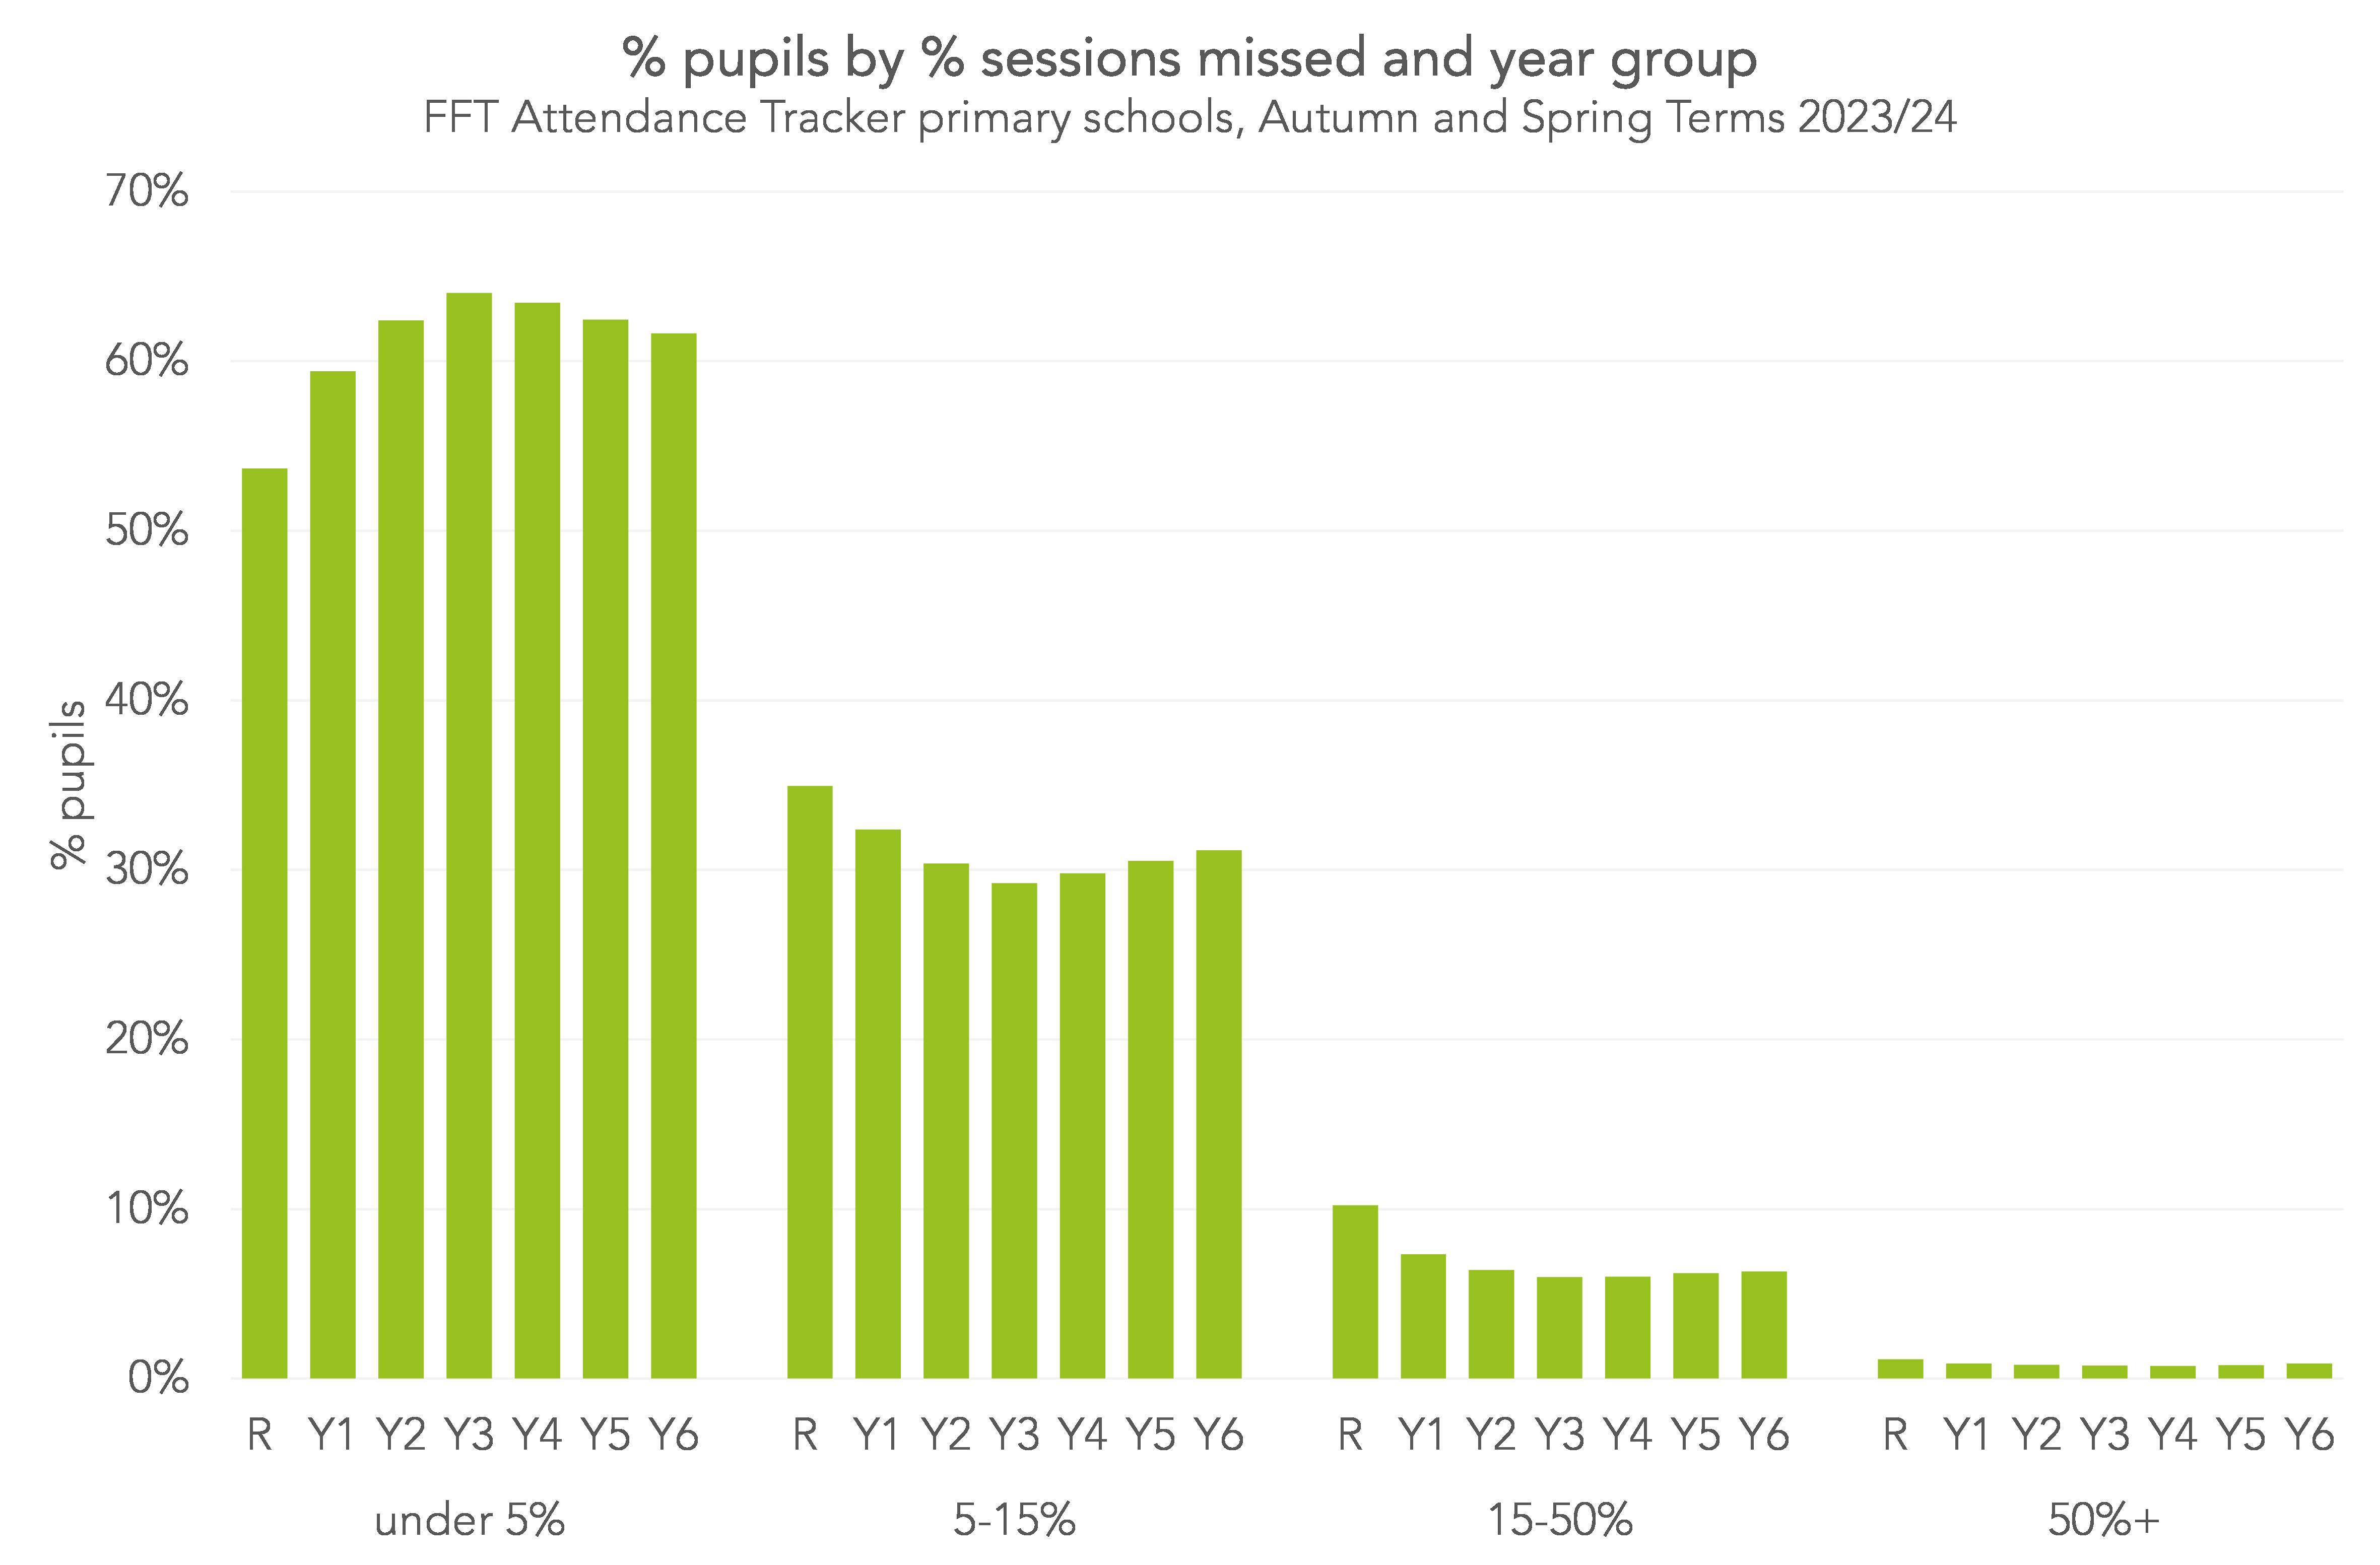
Splitting the data by year group, for primary:
and for secondary:
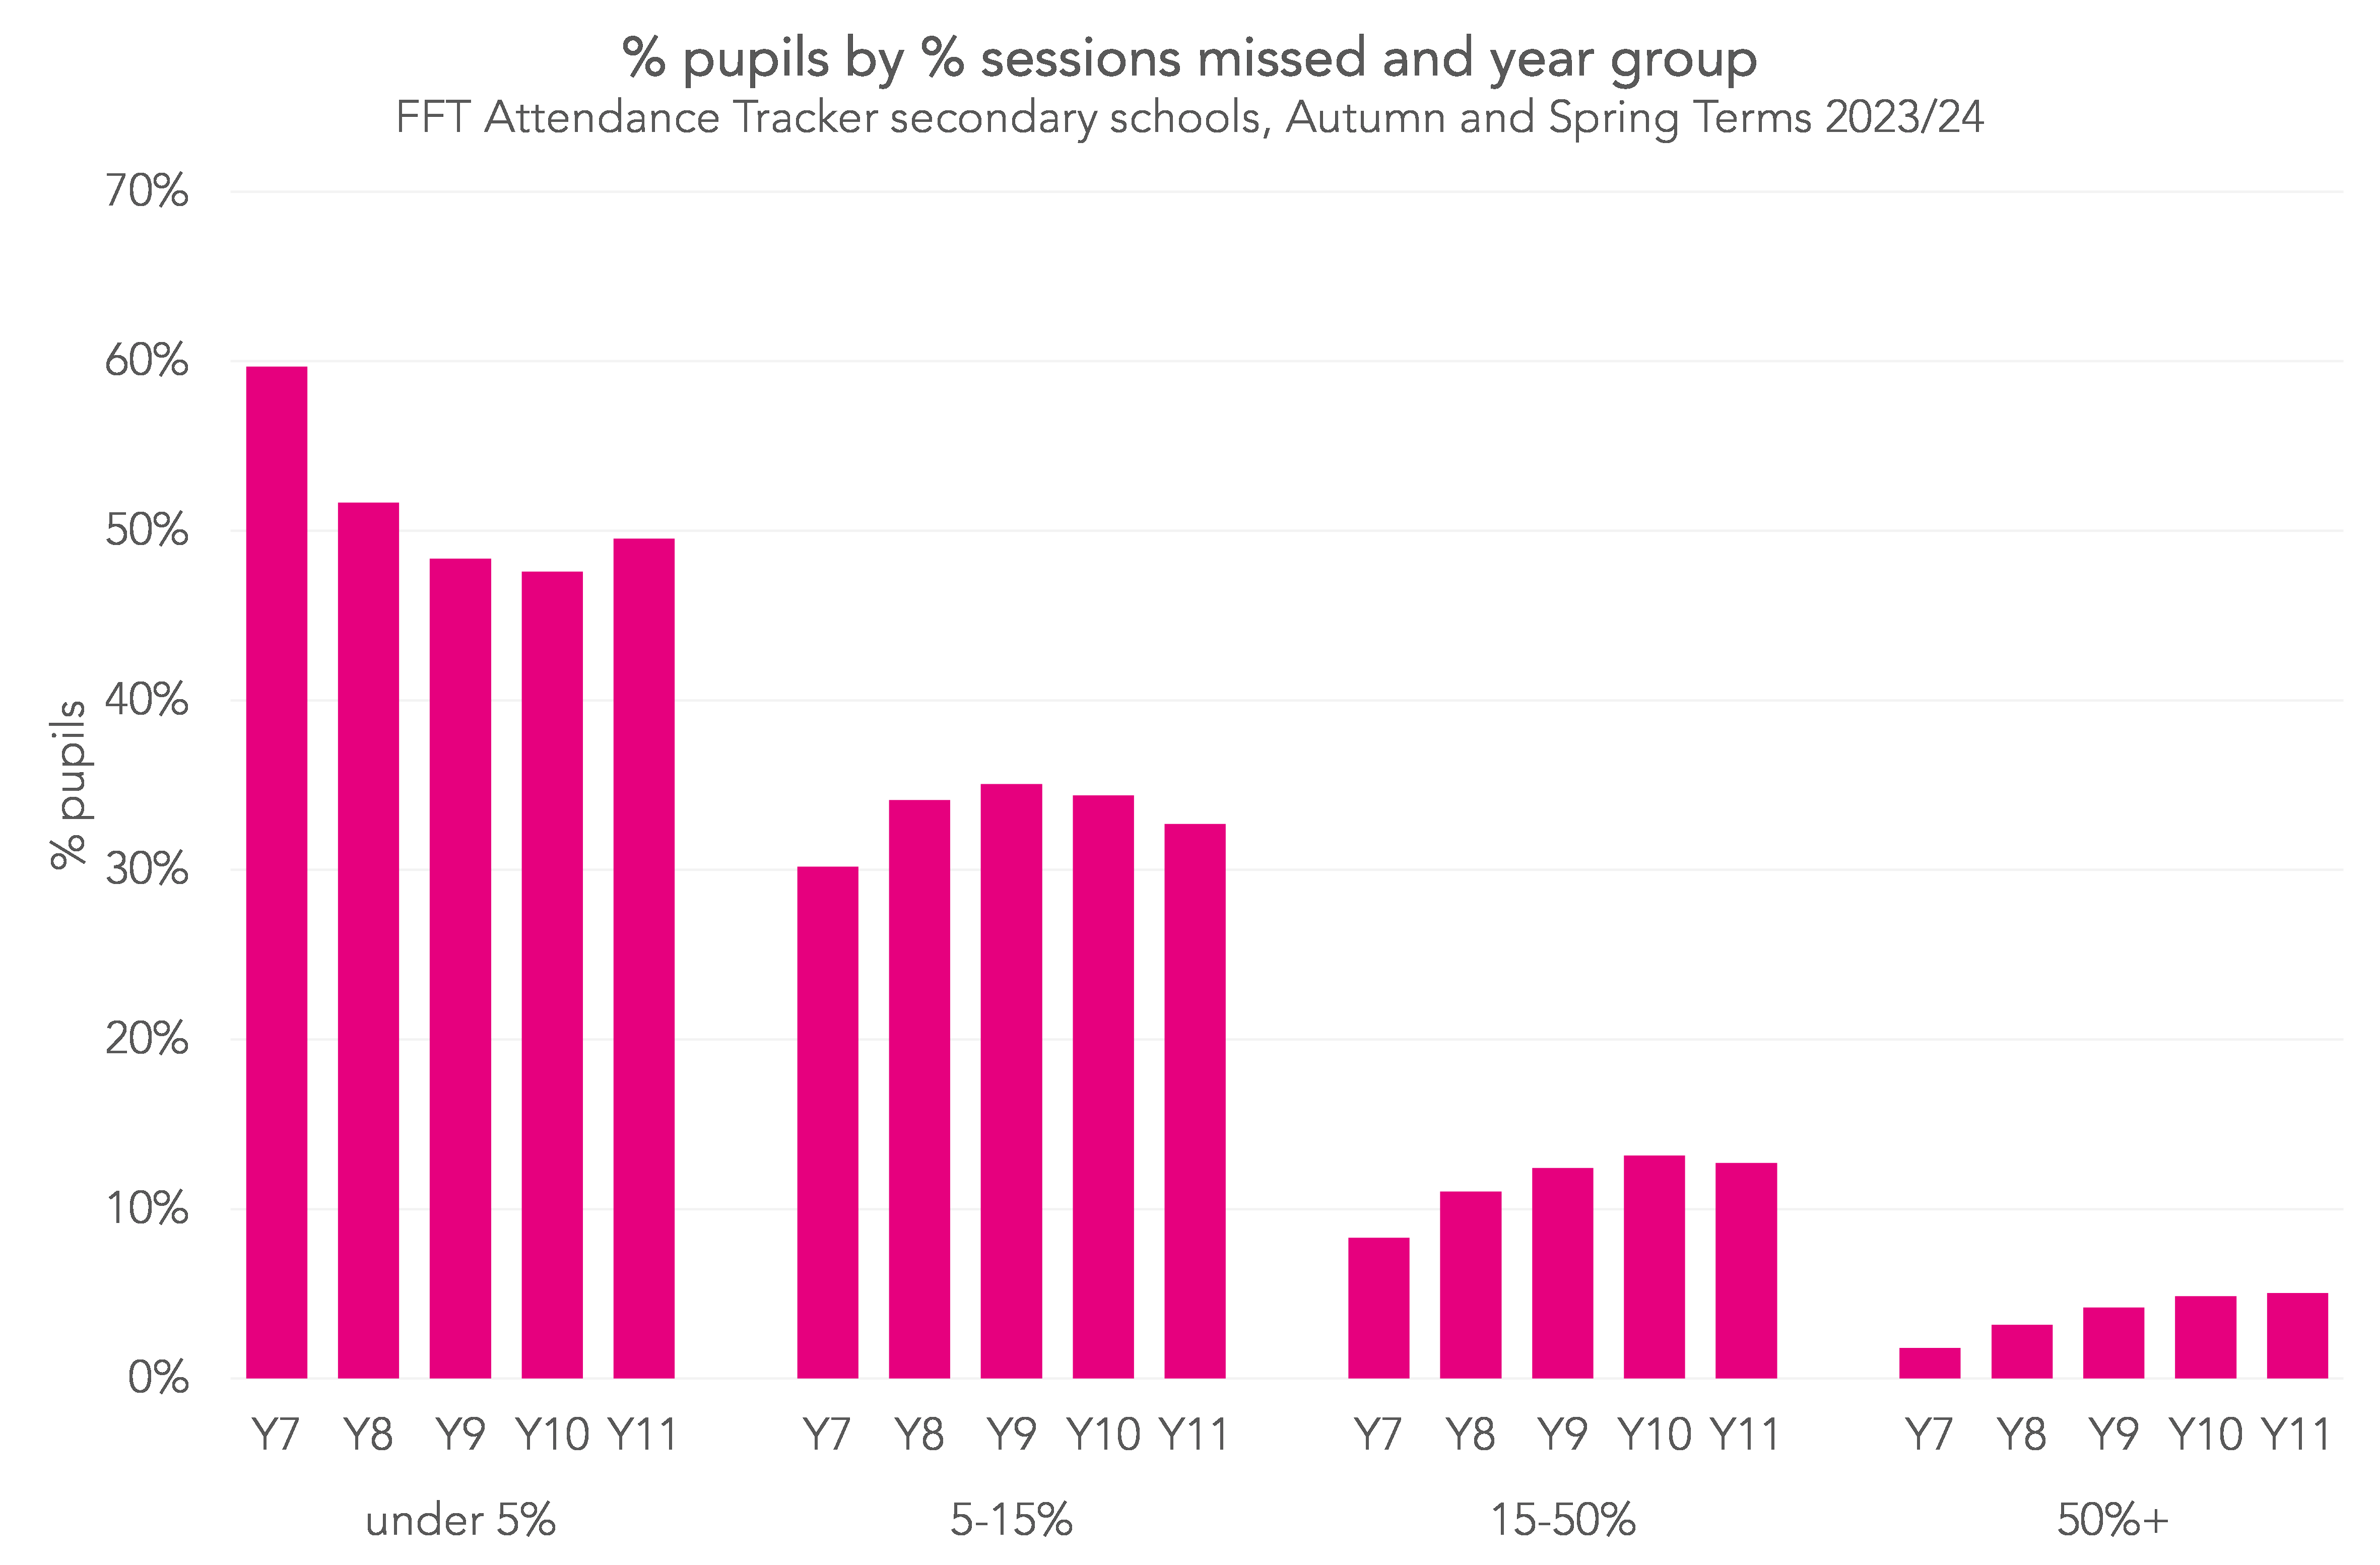
We can see that the proportion of pupils missing 5-15% of sessions didn’t vary much. At primary, it ranged from 29% of pupils in Year 3 to 35% in Reception, and at secondary from 30% of Year 7 pupils to 35% of Year 9. By contrast, there were almost three times as many pupils in Year 11 who missed at least 50% of sessions (5.0%) than there were in Year 7 (1.8%).
Reasons for absence
We’ll now look at the reasons for absence recorded in schools’ registers. We’ll use three categories: illness, authorised absence not due to illness, and all unauthorised absence. And we’ll show the percentage of sessions missed in each category by year group.
First, pupils who missed 5-15% of sessions:
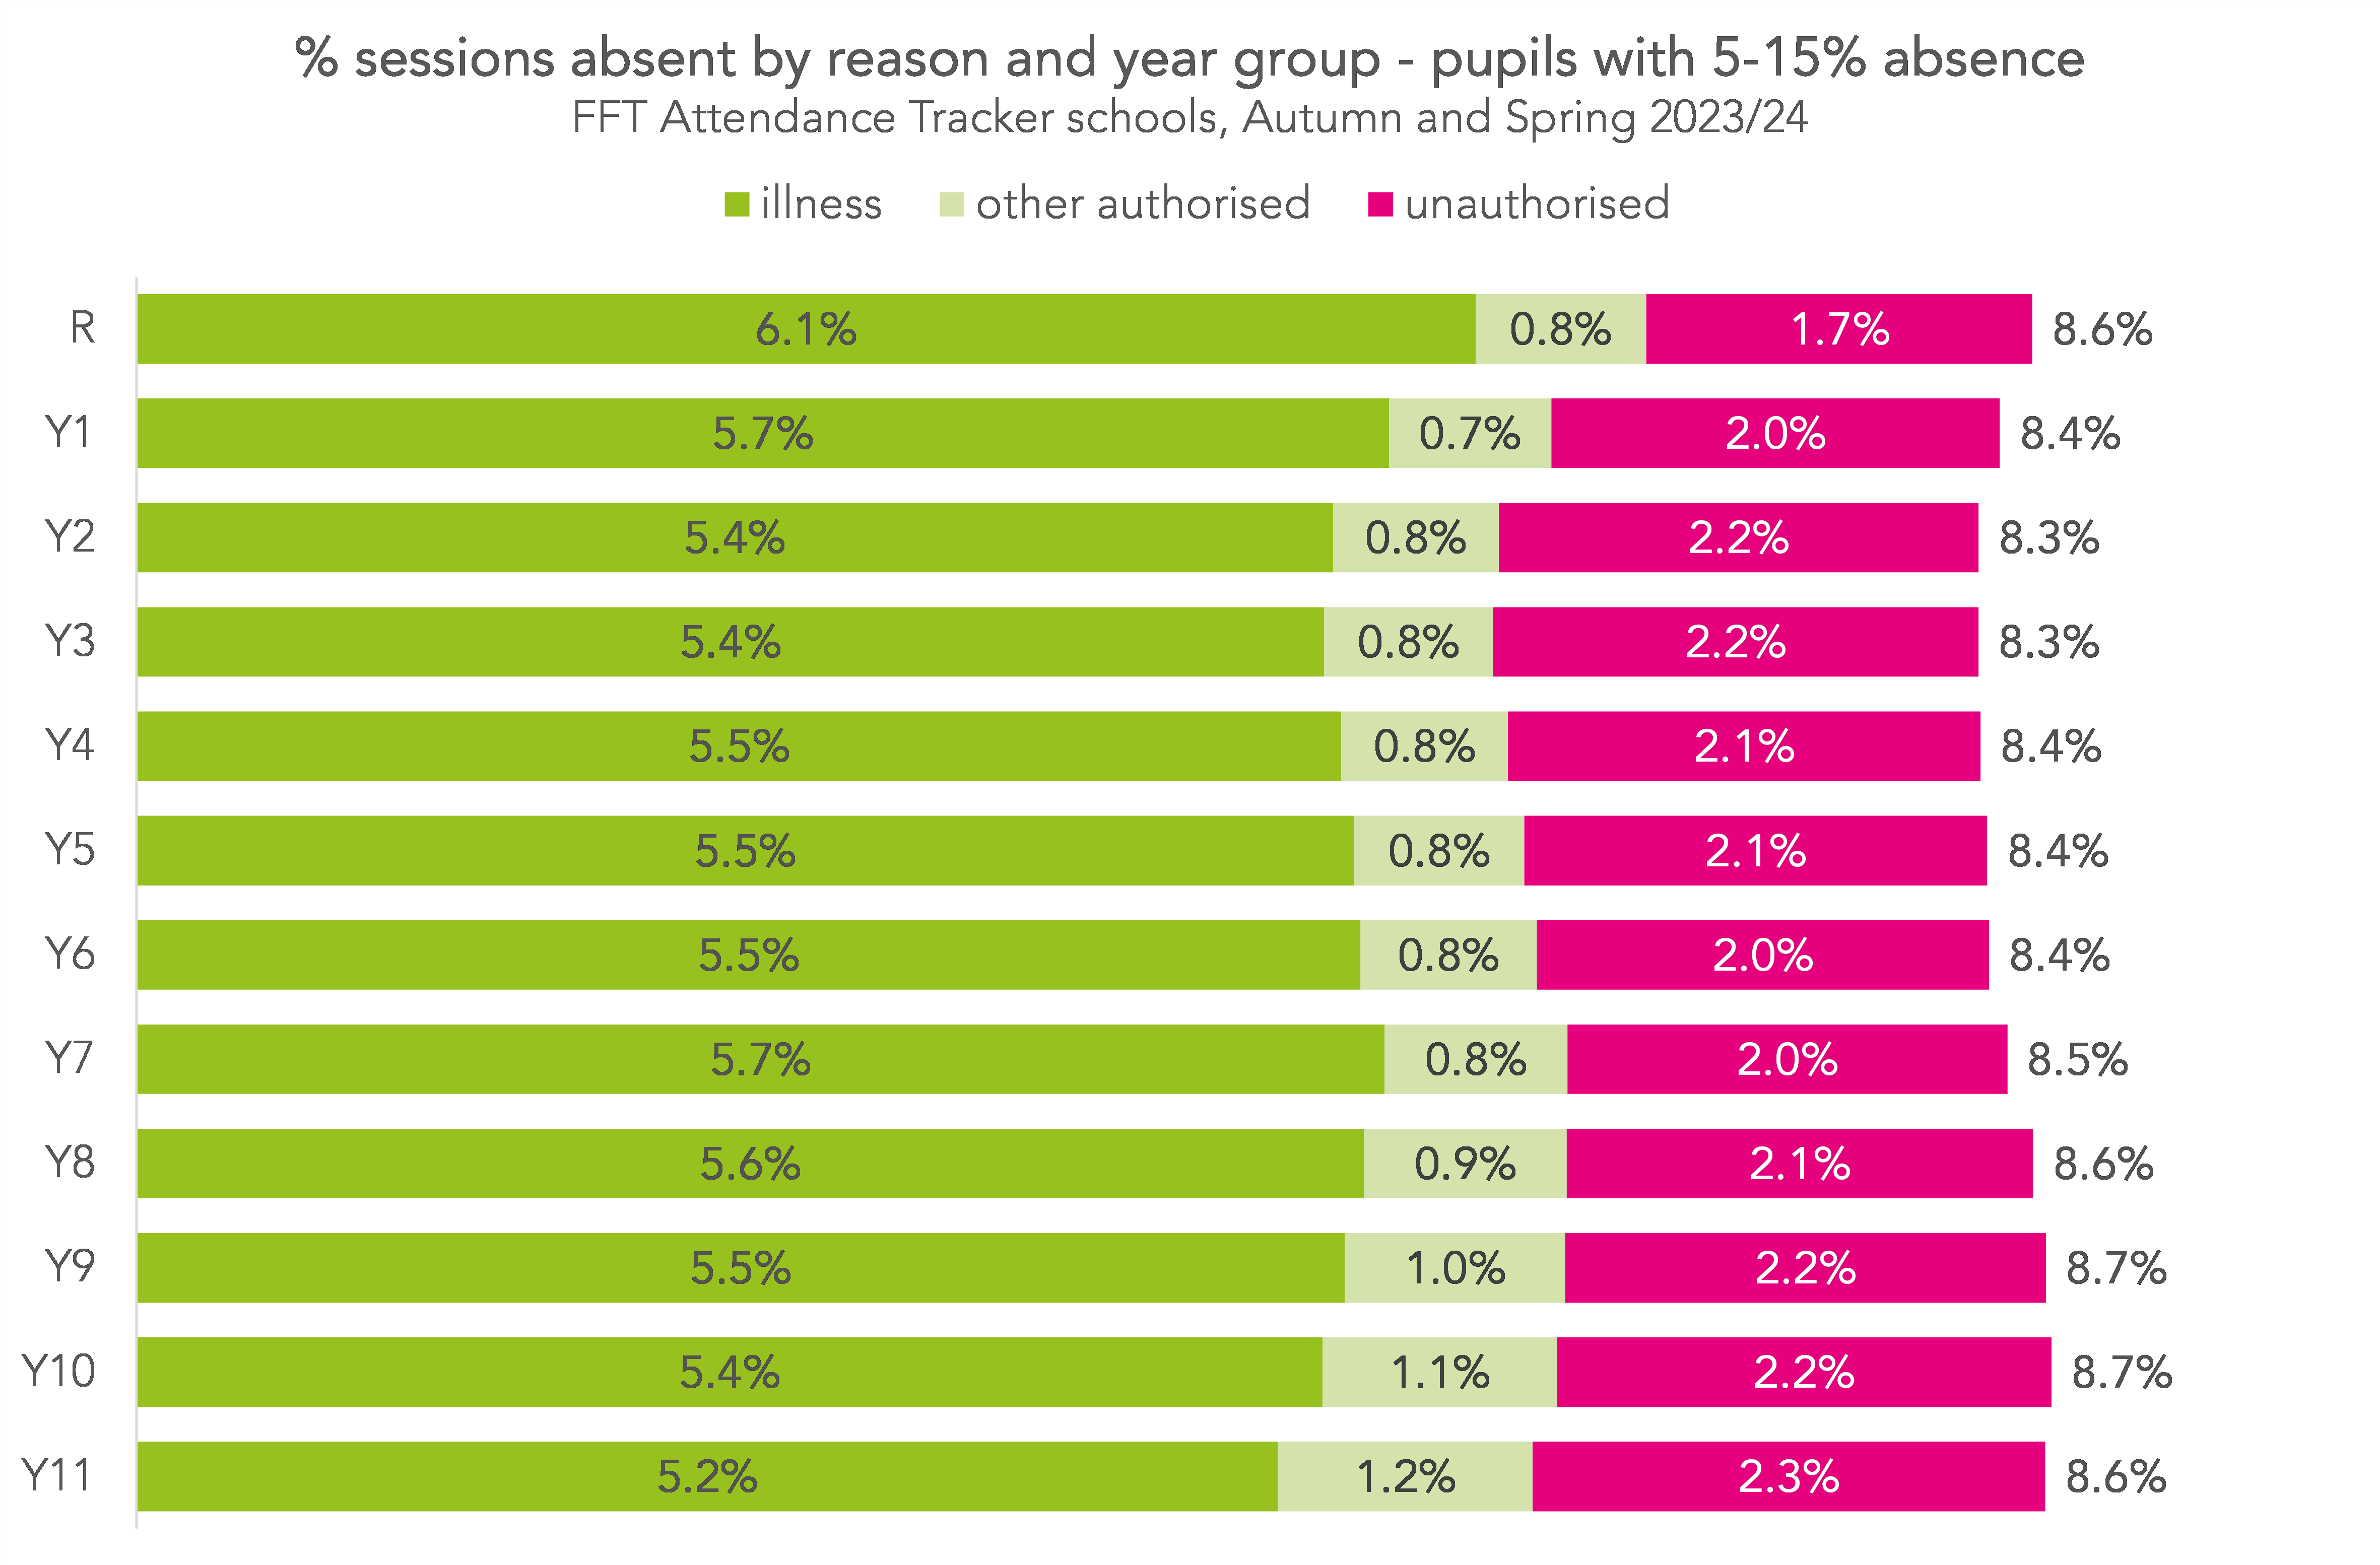
Perhaps surprisingly, the reasons recorded for absence among this population of pupils were similar across all year groups. A slightly lower percentage of sessions were missed due to illness among the oldest pupils, and a slightly higher percentage missed due to non-illness authorised absence and unauthorised absence.
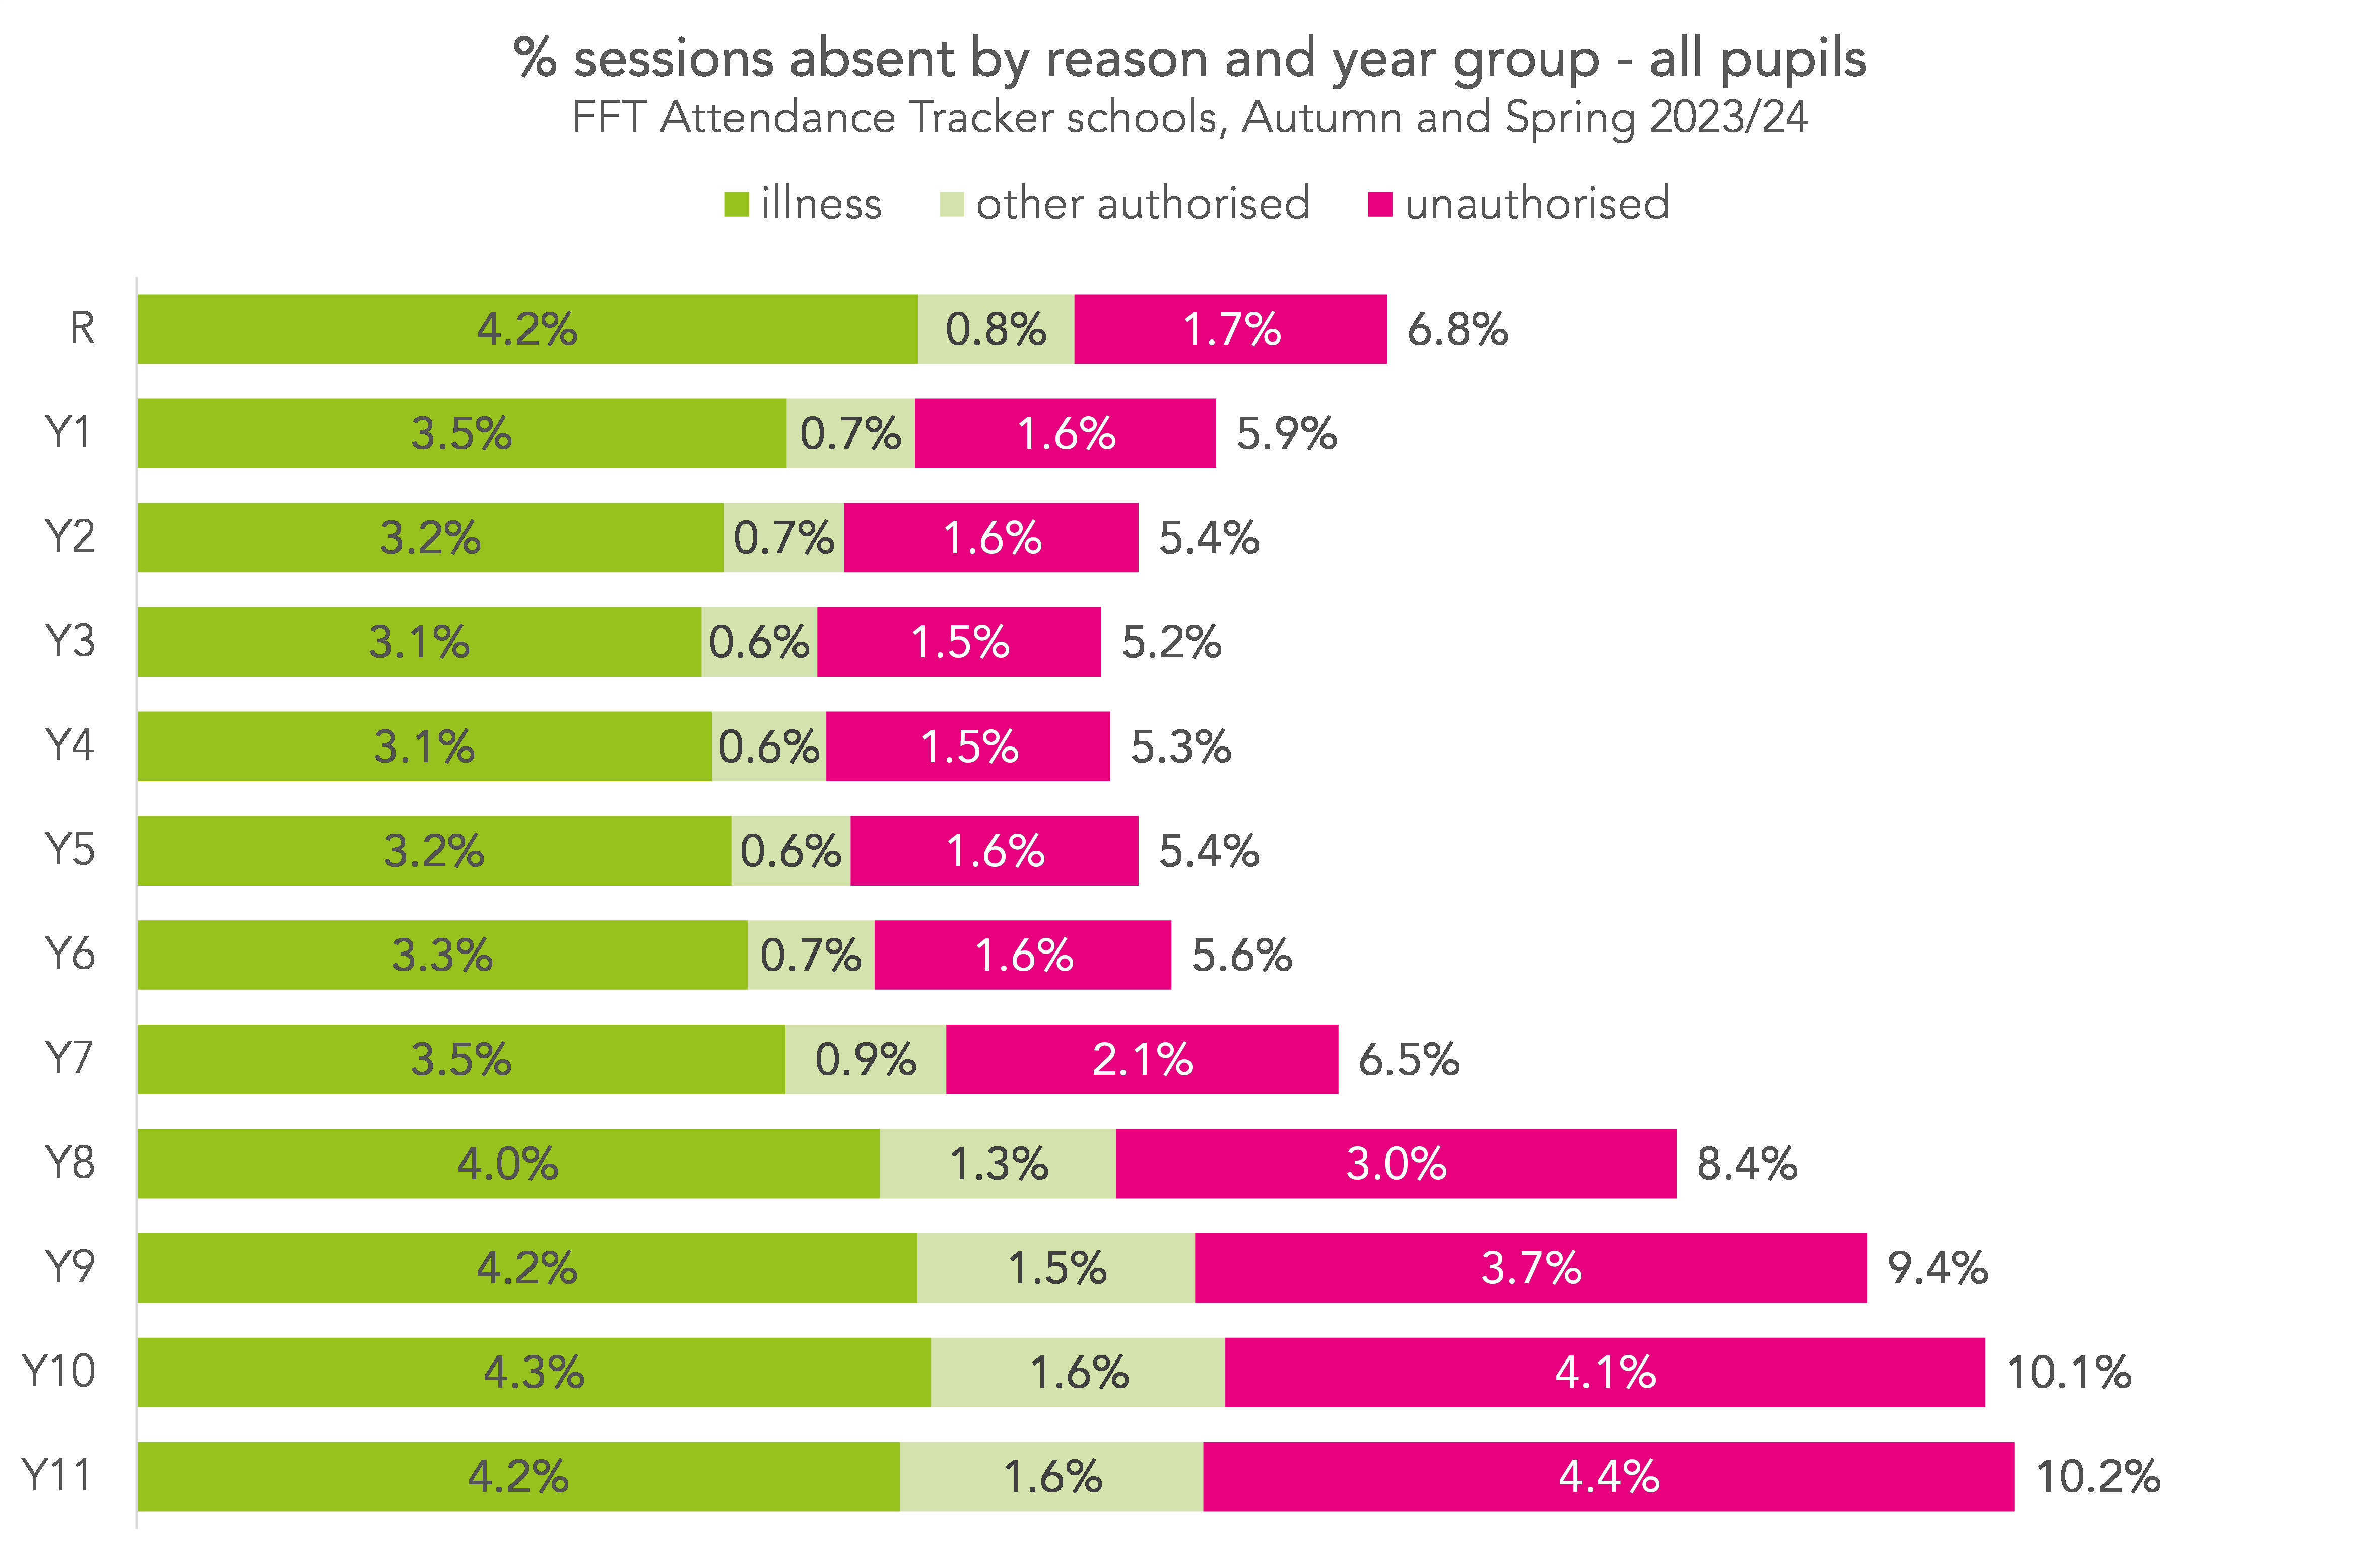
For comparison, we show the reason breakdown for all pupils below:
Pupil characteristics
Now let’s look at the characteristics of pupils with different absence rates.
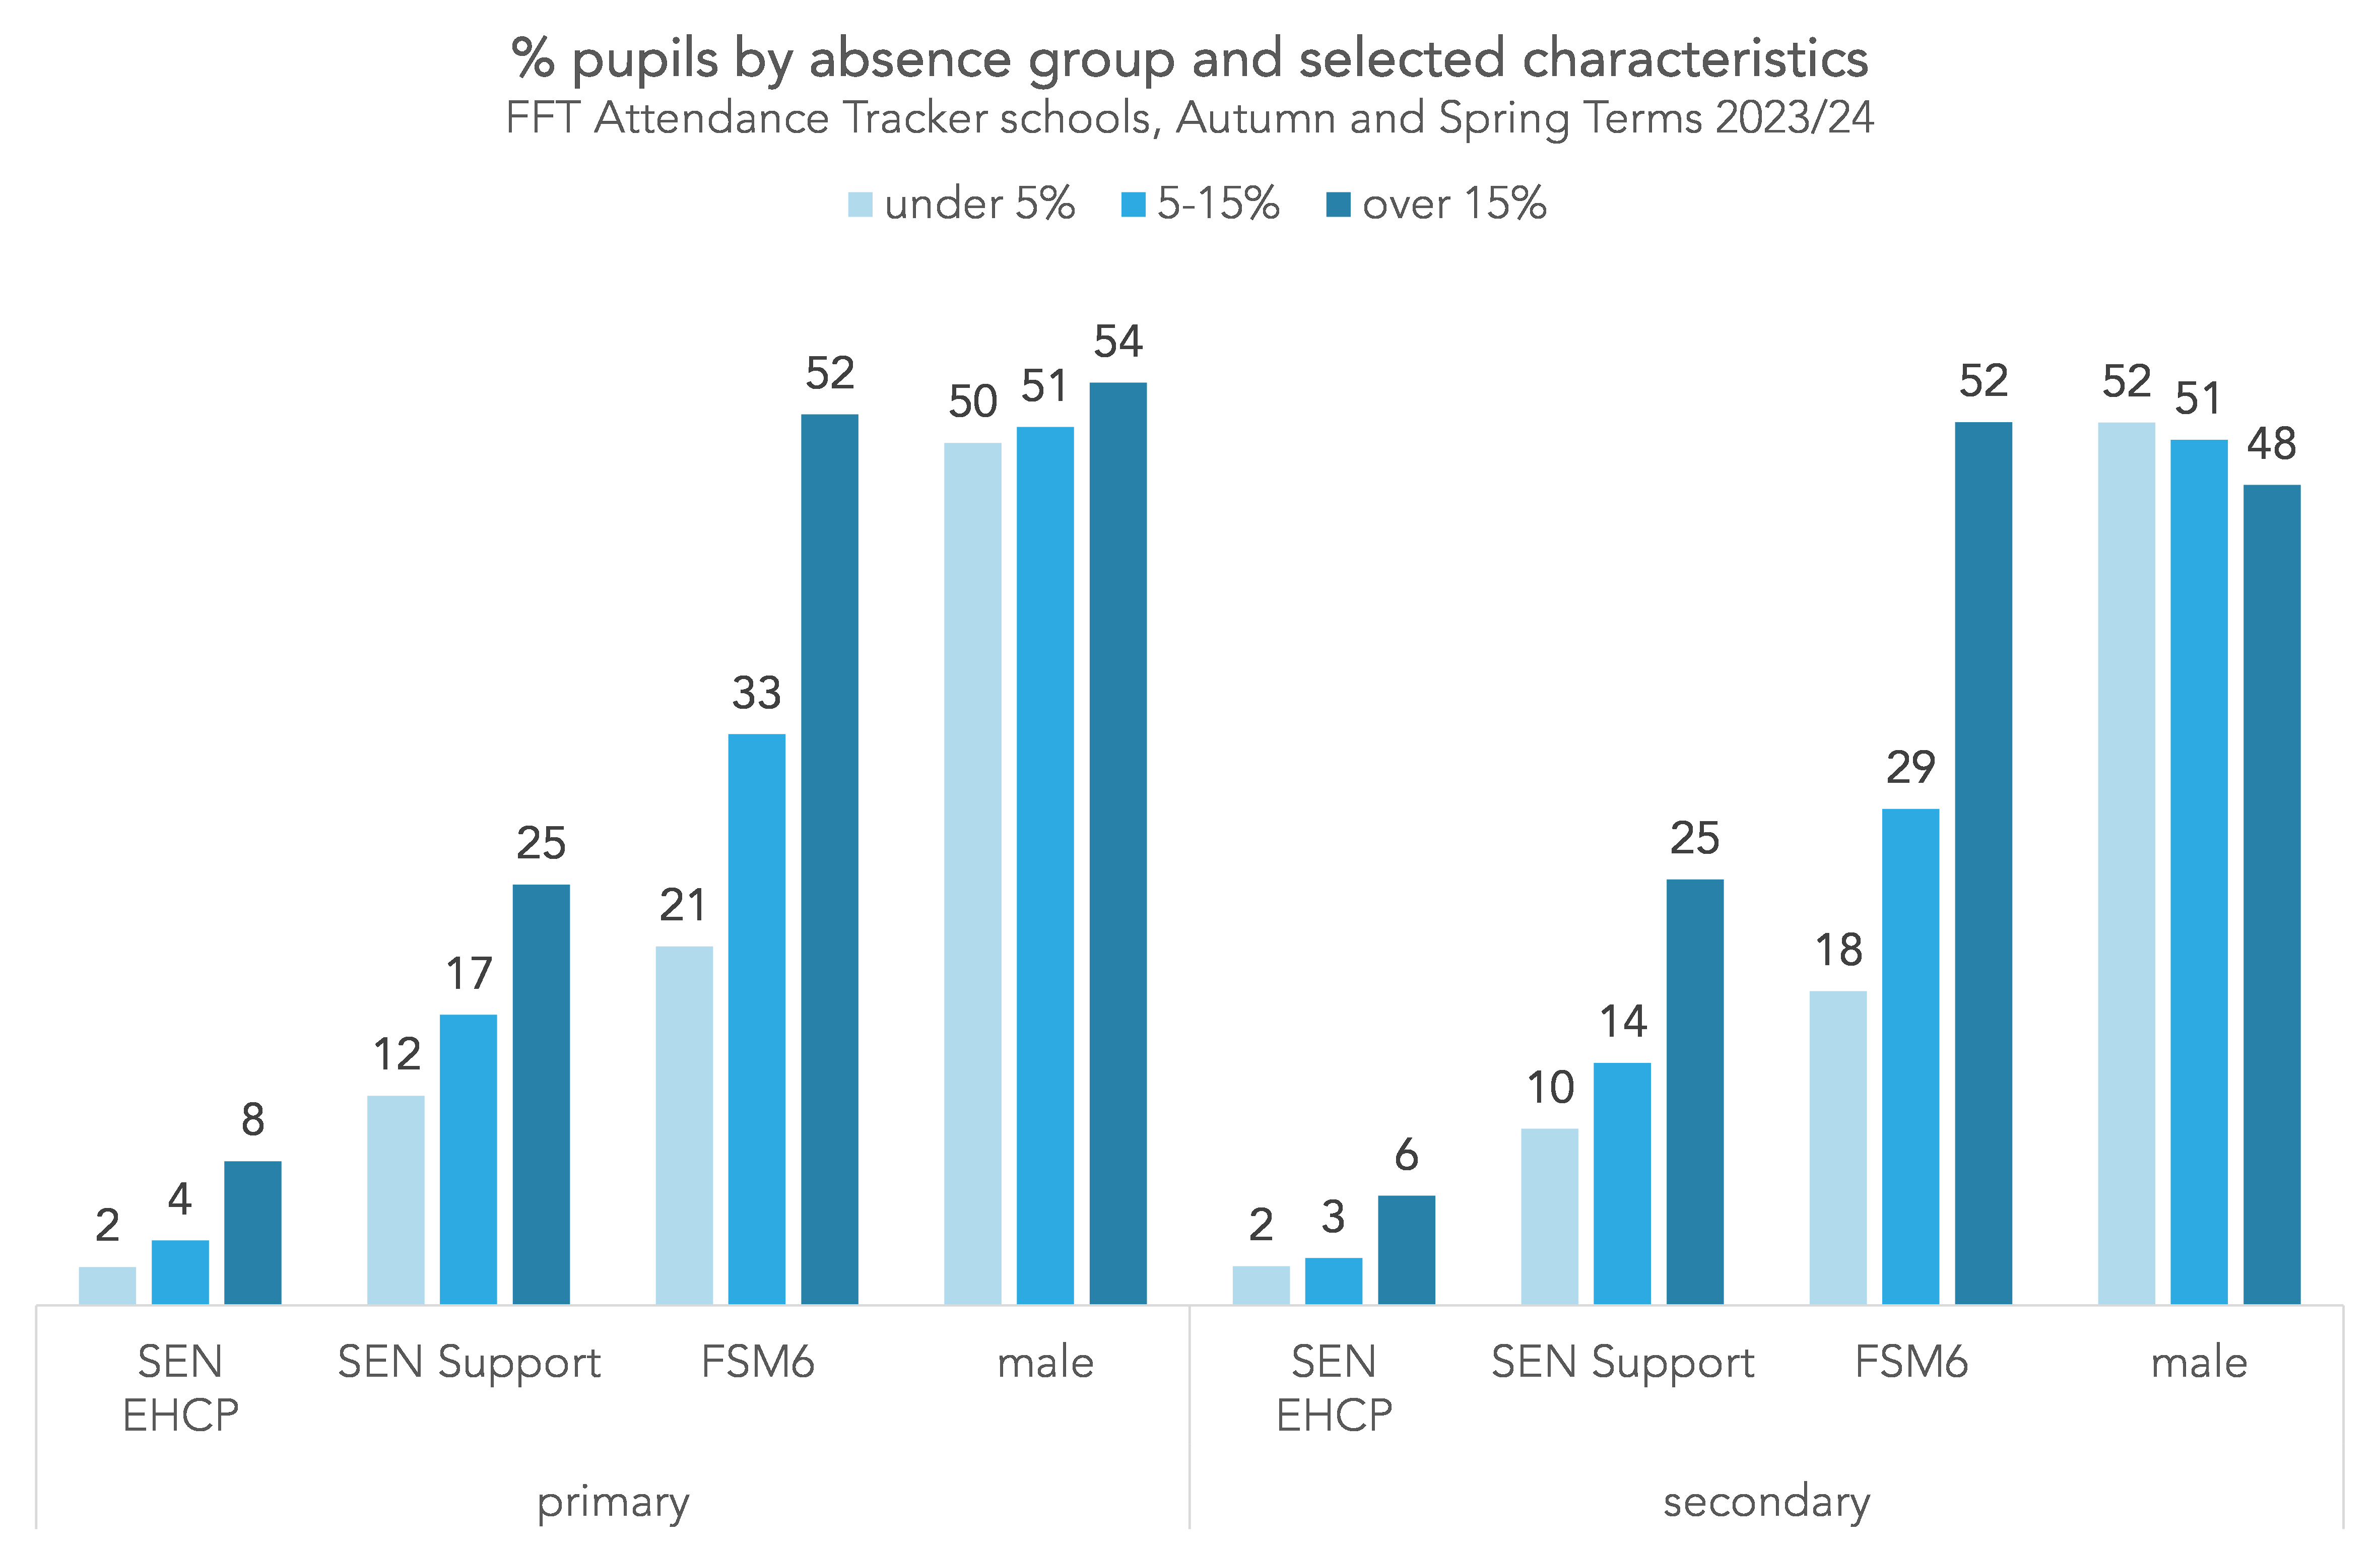
As we might expect, pupils with higher absence rates were more likely to have an identified special educational need (SEN) and to have been eligible for free school meals in the last six years (FSM6) than those with lower absence rates. For example, around 30% of pupils who missed 5-15% of sessions were FSM6, compared with around 20% of those who missed less than 5% of sessions, and around 50% of those who missed more than 15%.
So pupils who missed 5-15% of sessions were more likely to be from vulnerable groups than those who missed less than 5%, but not as likely as those who missed more than 15%.
Spells of absence
To finish, we’ll look at how frequently pupils were absent, and see how this varied by their overall absence rate. To do this, we count up the number of periods or “spells” of absence for each pupil. (You can read a bit more about the methodology of this here.)
Below we plot the percentage of pupils by the number of spells of absence they had.
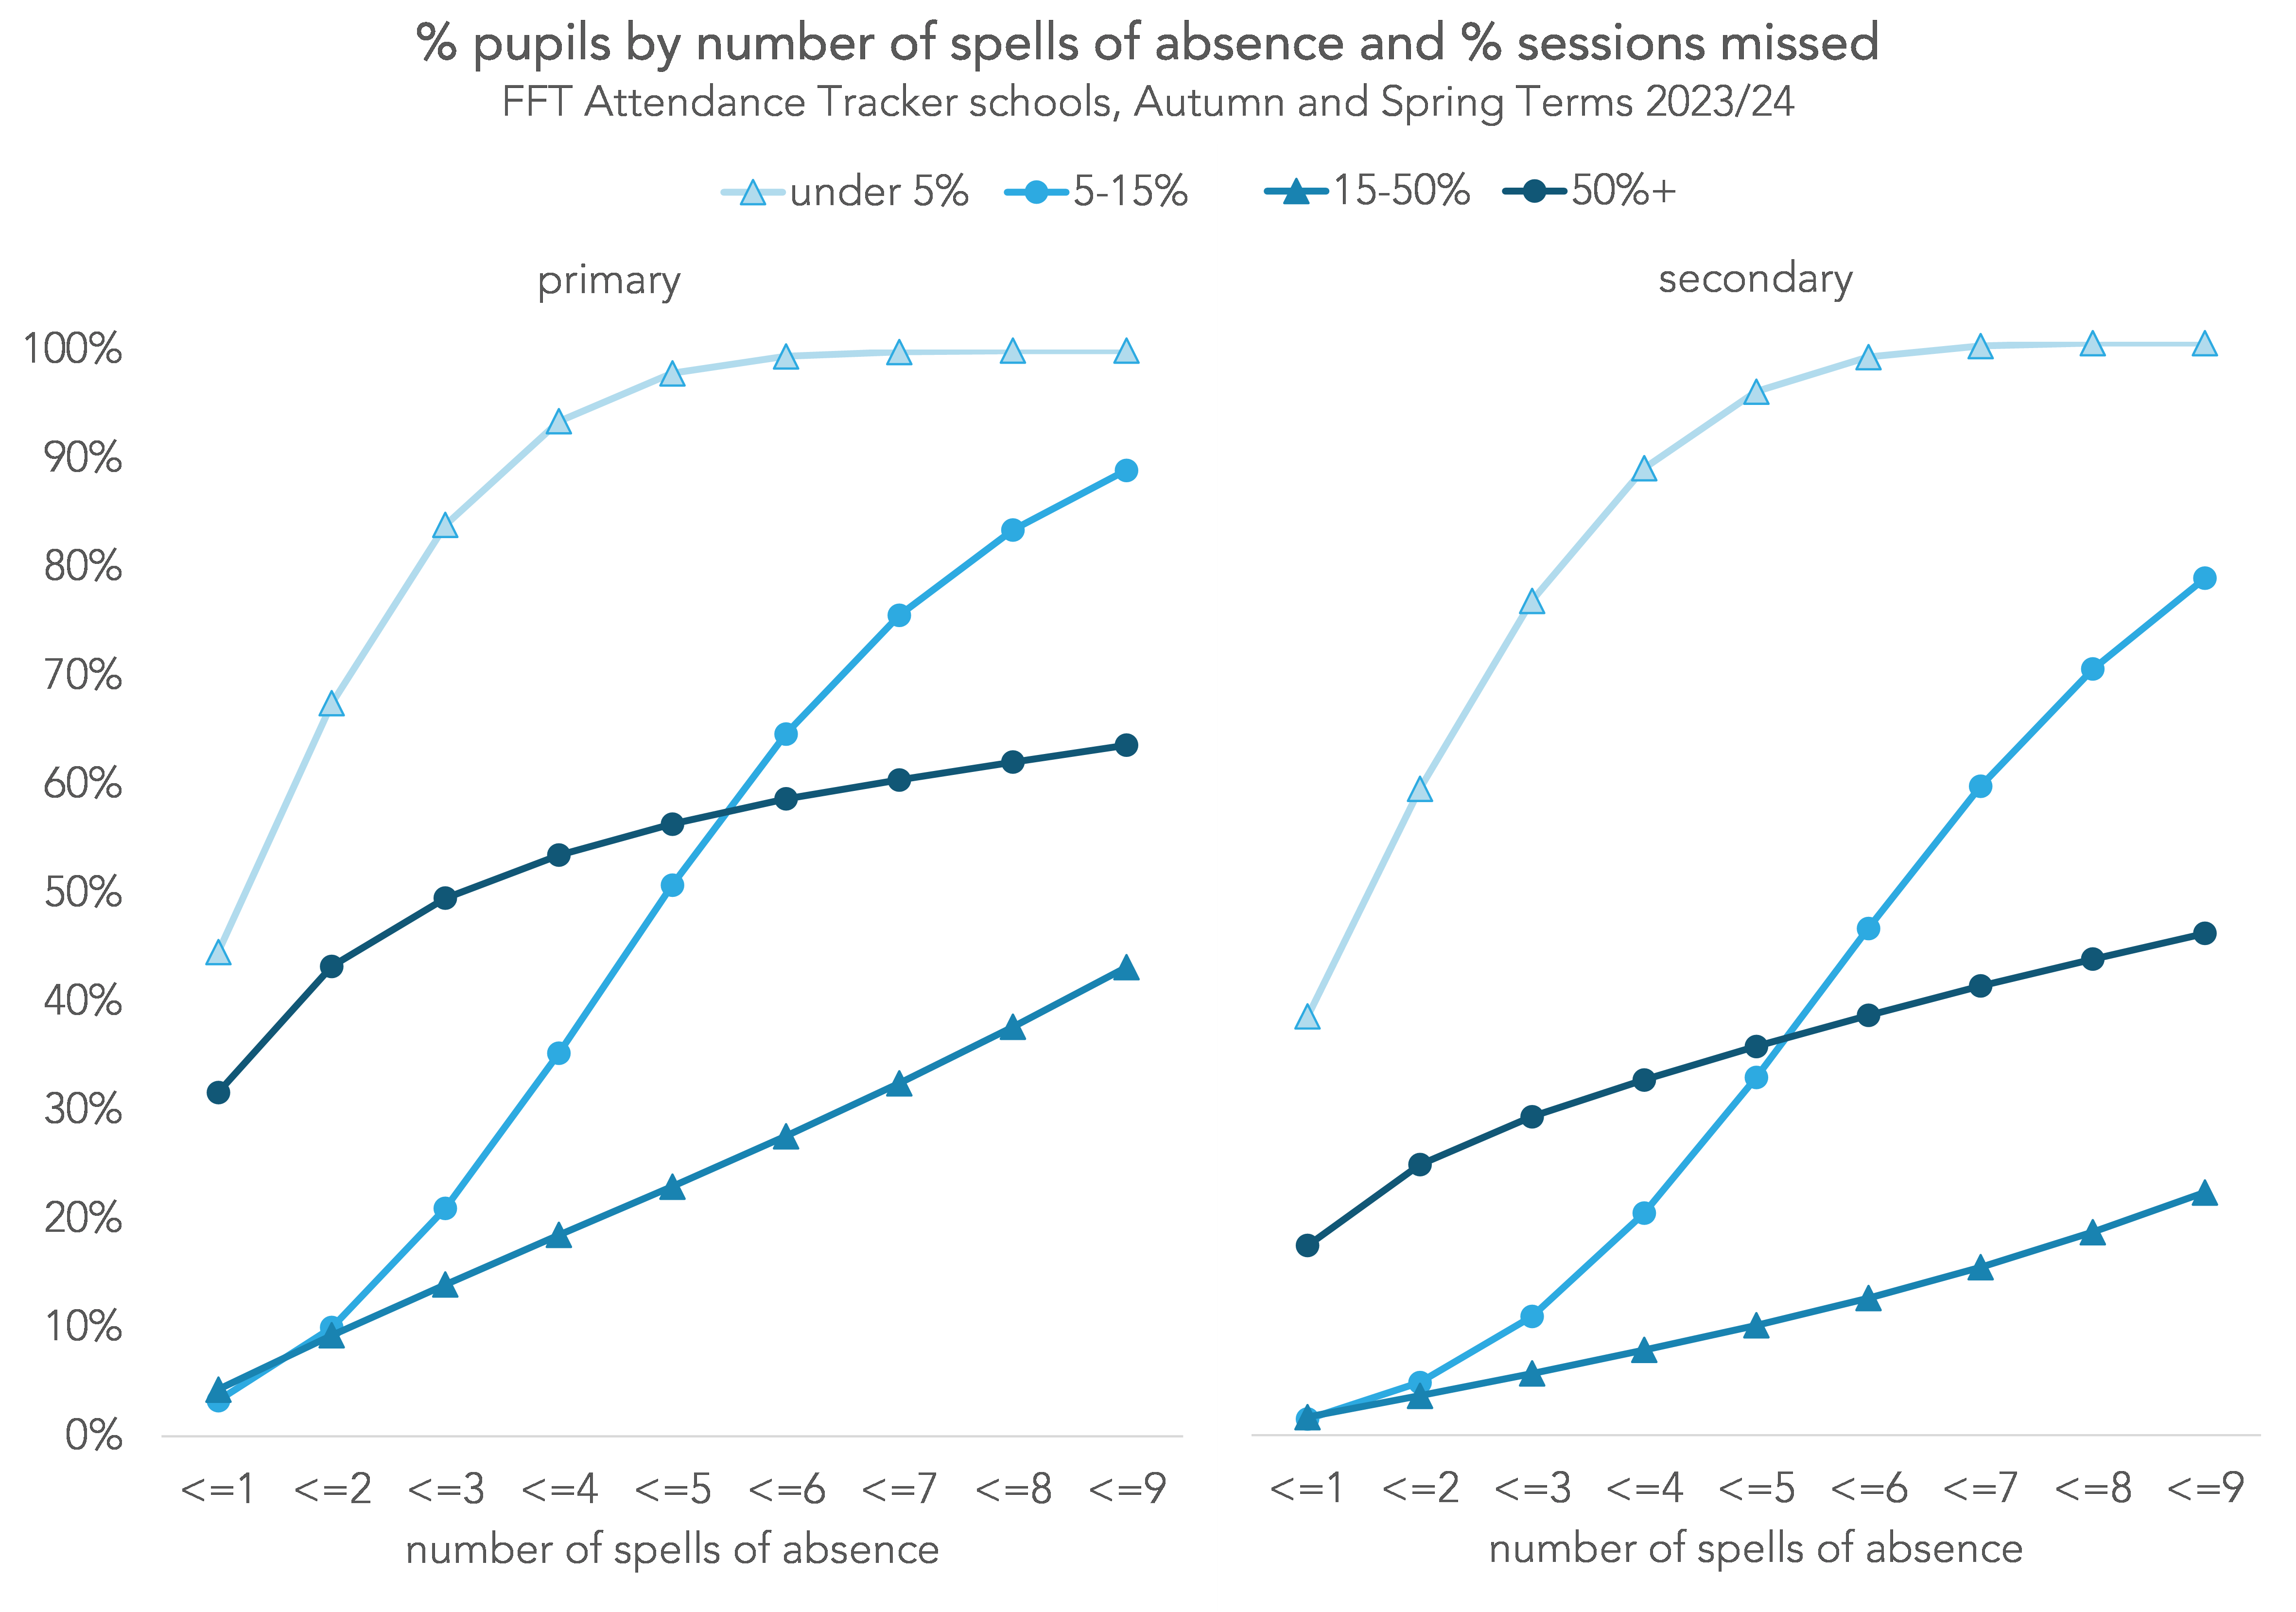
Broadly, pupils with higher rates of absence tended to have more spells, with one exception: there were more pupils with a small number of spells among those with absence rates of 50%+ than those with rates of 5-15%, and 15-50%.
Looking at the 5-15% group specifically, the picture is mixed. There were some pupils who had only a handful of spells, and some who had lots. We can see this more clearly by adding some labelling to the chart.
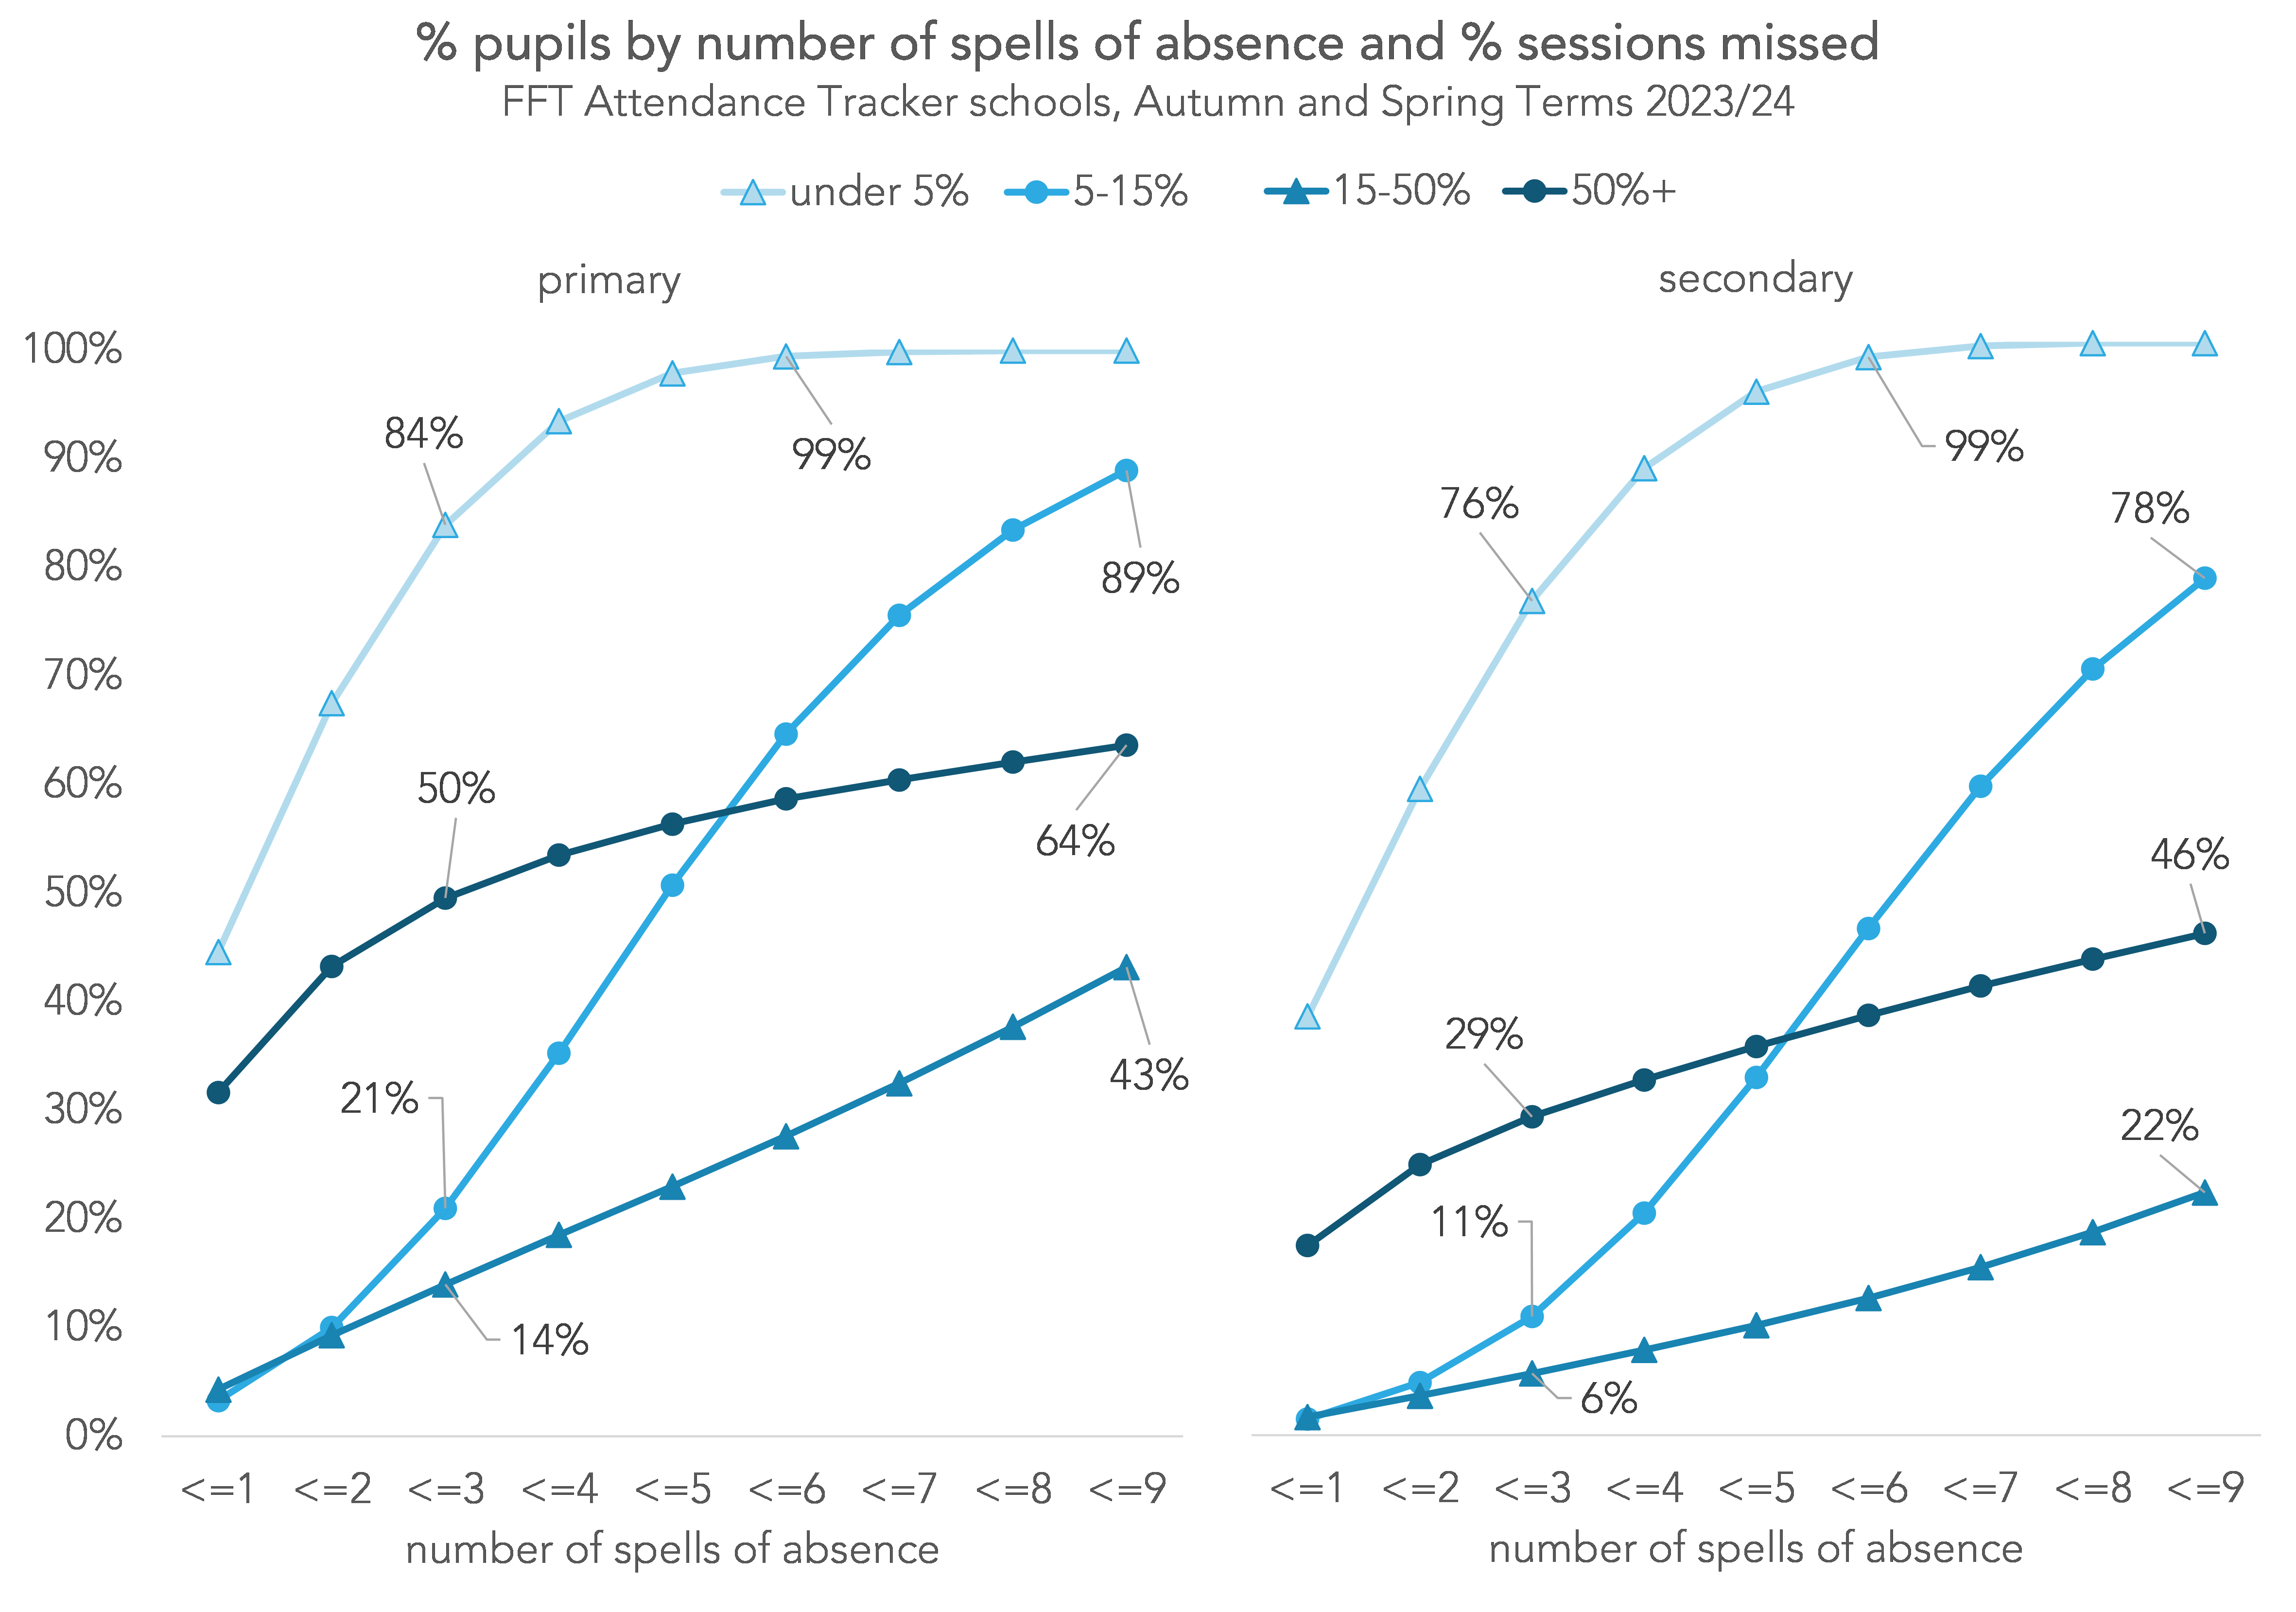
Overall, at primary, pupils with absence rates of 5-15% were more likely to have a small number of spells than a large number, while at secondary the reverse was true. (At primary, 21% of pupils in the 5-15% group had three spells or fewer while 11% had ten spells or more. At secondary, 11% had three spells or fewer and 22% had ten spells or more.)
In terms of the “average” pupil with an absence rate of 5-15%, at primary, the median number of spells was 5 (vs 2 for the under 5% group and 11 for the 15-50% group), and at secondary it was 7 (vs 2 for the under 5% group and 15 for the 15-50% group).
Very few pupils in the 5-15% group had just one spell of absence (3% at primary and 1% at secondary). However, if we discounted each pupil’s longest spell of absence, the proportion with absence rates between 5% and 15% would halve – from 32% of all pupils to 16%.
Summing up
Pupils who miss between 5% and 15% of sessions are more likely to be from a vulnerable group than those who miss less than 5%, but less likely than those who miss more than 15%.
However, it is not necessarily the case that these pupils exhibit regular patterns of absence (e.g. missing Friday afternoons). Half of all pupils in the 5-15% group over the Autumn and Spring terms this year are there by virtue of a single spell of absence.
Want to stay up-to-date with the latest research from FFT Education Datalab? Sign up to Datalab’s mailing list to get notifications about new blogposts, or to receive the team’s half-termly newsletter.


Hi, I’ve done lots of work on attendance statistics. I looked at proportion of students in an attendance band vs proportion of total days lost. In the schools I’ve looked at, students with under 80% attendance, made up @ 10% of the students, but accounted for 40-50% of the days lost. For those in the 80-90 range, it was @15% of students accounting for 20-30%. If a school wanted to significantly improve its attendance, it needed to reduce the number of students in the low attendance bands. This comes down to the school culture, how it supports students whose outside circumstances impact their resilience.
Students with 80%+ attendance are in school over 4 days a week, so that school culture will determine what proportion of students that is. The very low attendees will determine what your headline % is, and also it is the moral thing to do, to support and encourage this small percentage of students to attend more.