I was reminded a while back of one of our very first publications, Floors, Tables and Coasters, in which we examined the impact of pupil mobility on secondary schools’ published performance indicators.
Indicators published in Secondary School Performance Tables are, with a few additions and exceptions, based on pupils recorded on roll in Year 11 in the Spring term (January) School Census. Anyone who leaves before this date, voluntarily or otherwise, is not included. This risks introducing a perverse incentive to “lose” pupils from the roll either by exclusion, managed move or encouragement to leave[1].
We first examined this question using data relating to the 2013/14 Key Stage 4 cohort. Sure enough, we saw a decline in the size of the cohort between Year 7 and Year 11, particularly between the Spring of Year 10 and the Spring of Year 11.
We thought it was time we dusted down the analysis to see if things have changed.
Data
As usual, we use data from the National Pupil Database.
We track six cohorts of young people, those who reached the end of Key Stage 4 between 2017/18 and 2022/23. This includes the two years when national examinations were cancelled due to the COVID-19 pandemic in 2019/20 and 2020/21. We track them from the Spring of Year 7 (i.e. from 2013/14 to 2018/19).
Our main interest is in pupils who start Year 7 in state-funded mainstream schools in England. This includes community schools, voluntary aided/controlled schools, foundation schools, free schools and sponsored/ converter academies.
We then observe pupils’ end of Key Stage 4 outcomes wherever they feature in School Performance Tables. In addition to the types of state-funded mainstream schools listed above, we also include studio schools, university technical colleges, further education colleges, special schools, alternative provision (AP) schools and independent schools.
A Key Stage 4 destination cannot be determined for some pupils. This includes those that emigrate and a small number who have sadly died. Those in elective home education (EHE) may not be observed in the data unless they have entered examinations, in which case they will be recorded against the type of institution at which the exams were taken.
Year 7 leavers
We start off looking at pupils who were in Year 7 in the Spring School Census in all state-funded mainstream schools.
The chart below shows three cohorts: those who (ordinarily) would have reached the end of Key Stage 4 in 2019, 2021 and 2023. These three cohorts are successively larger, consisting of 540 thousand, 571 thousand and 602 thousand pupils respectively.
We show the proportion of each cohort that leave the state-funded mainstream school system each term, be it to go to a different type of school, as result of migration, or as a result of a move into elective home education. In some cases, pupils leave the cohort and then return. In such cases, we would only count pupils as leavers in the terms in which they were not enrolled at a state-funded mainstream school[2].
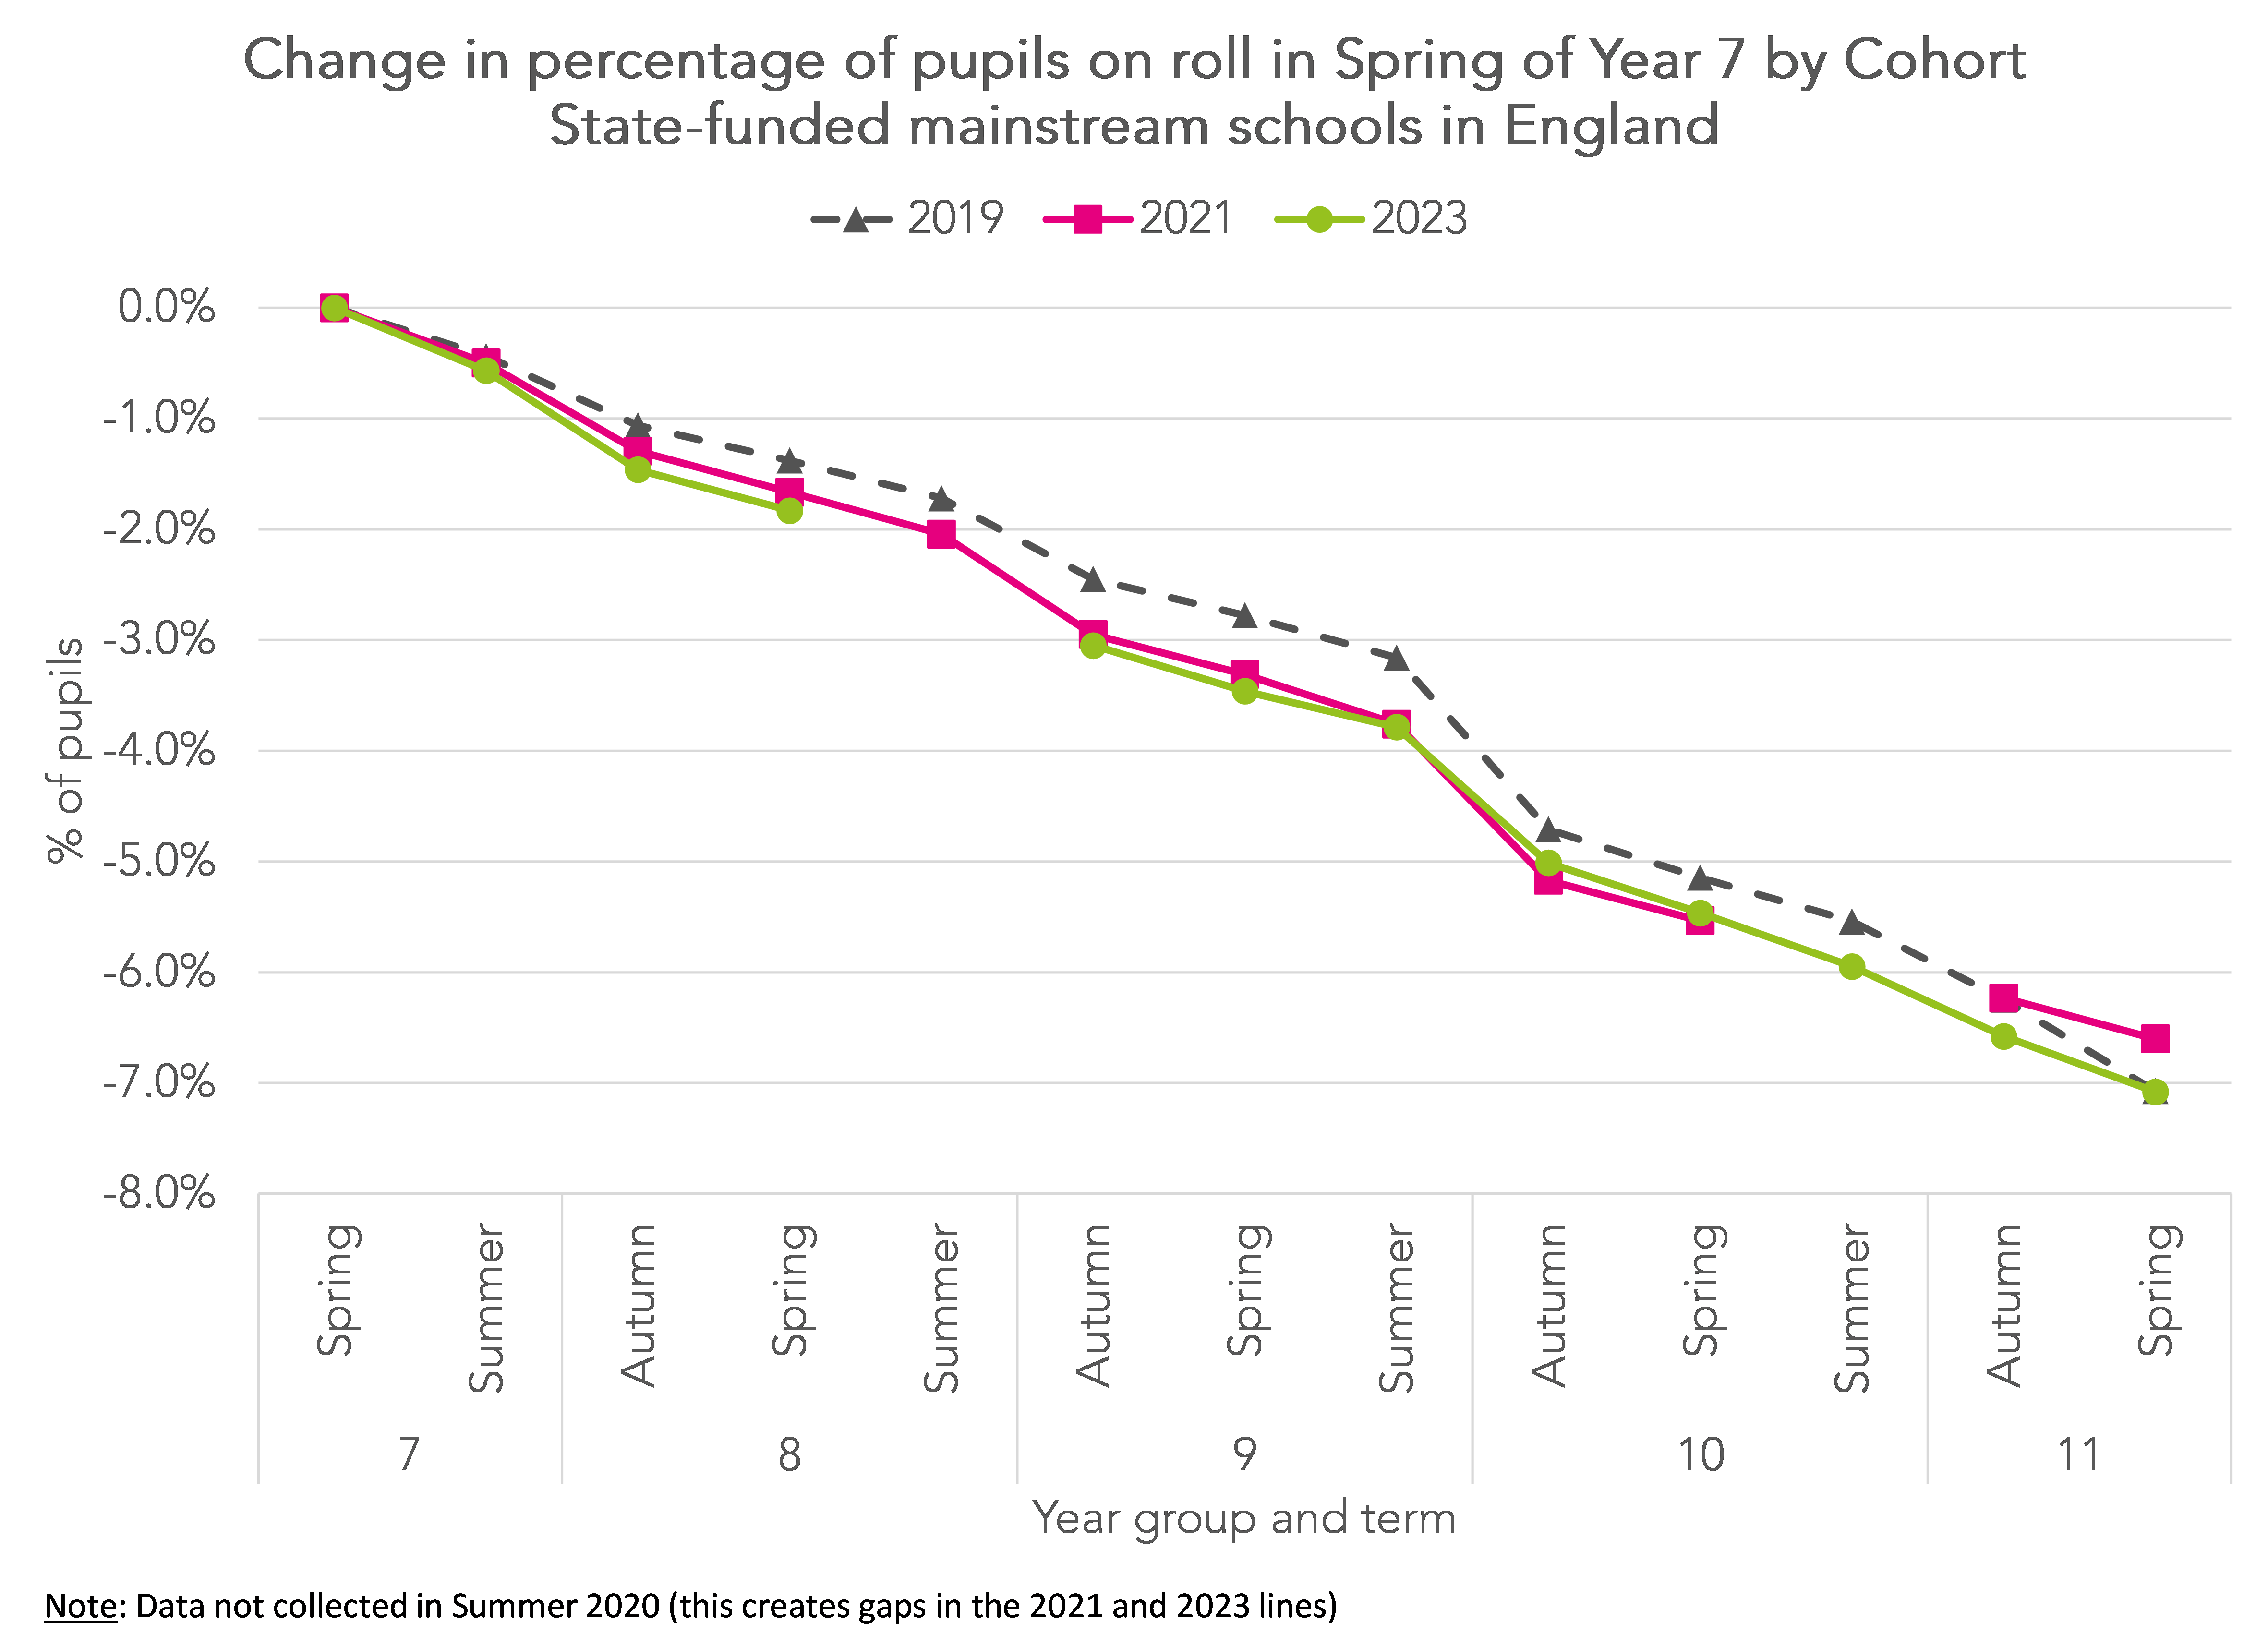
By the Spring of Year 11, around 7% of the 2019 and 2023 cohorts had left the state-funded mainstream school system.
This figure was slightly lower (6.6%) for the 2021 cohort. School performance data was not published for this cohort due to the cancellation of exams. We see that the proportion of leavers in this cohort was very similar to that of 2023 until the Spring of Year 10. For the 2021 cohort, this was just prior to the first national lockdown in 2020. The leaving rate subsequently slowed.
Compared to the 2019 cohort, the rate of leaving was lower among the 2023 cohort between Year 7 and the Summer of Year 10. However, the leaving rate was much sharper thereafter among the 2019 cohort, the result being an overall similar rate of leaving.
Transfers to other mainstream schools after Year 7
So far we’ve just looked at one aspect of outward pupil mobility, namely pupils leaving the state-funded mainstream sector altogether.
Let’s now also include pupils who move within the sector, i.e. transfer from one state-funded mainstream secondary school to another.
In some cases, we would expect pupils to leave the school they were attending in Year 7 to move to another school. This would be the case for pupils enrolled in middle schools, for example.
So for this analysis, we restrict our analysis to schools that cover the full Year 7 to Year 11 range.
This time we calculate two measures:
- The percentage of pupils who were on roll in Year 7 in the January Census who completed Key Stage 4 at a different state-funded mainstream secondary school (“change mainstream school”).
- The percentage of pupils who were on roll in Year 7 in the January Census who did not complete Key Stage 4 at a state-funded mainstream secondary school (“leave mainstream sector”).
Results for all six cohorts are shown below.
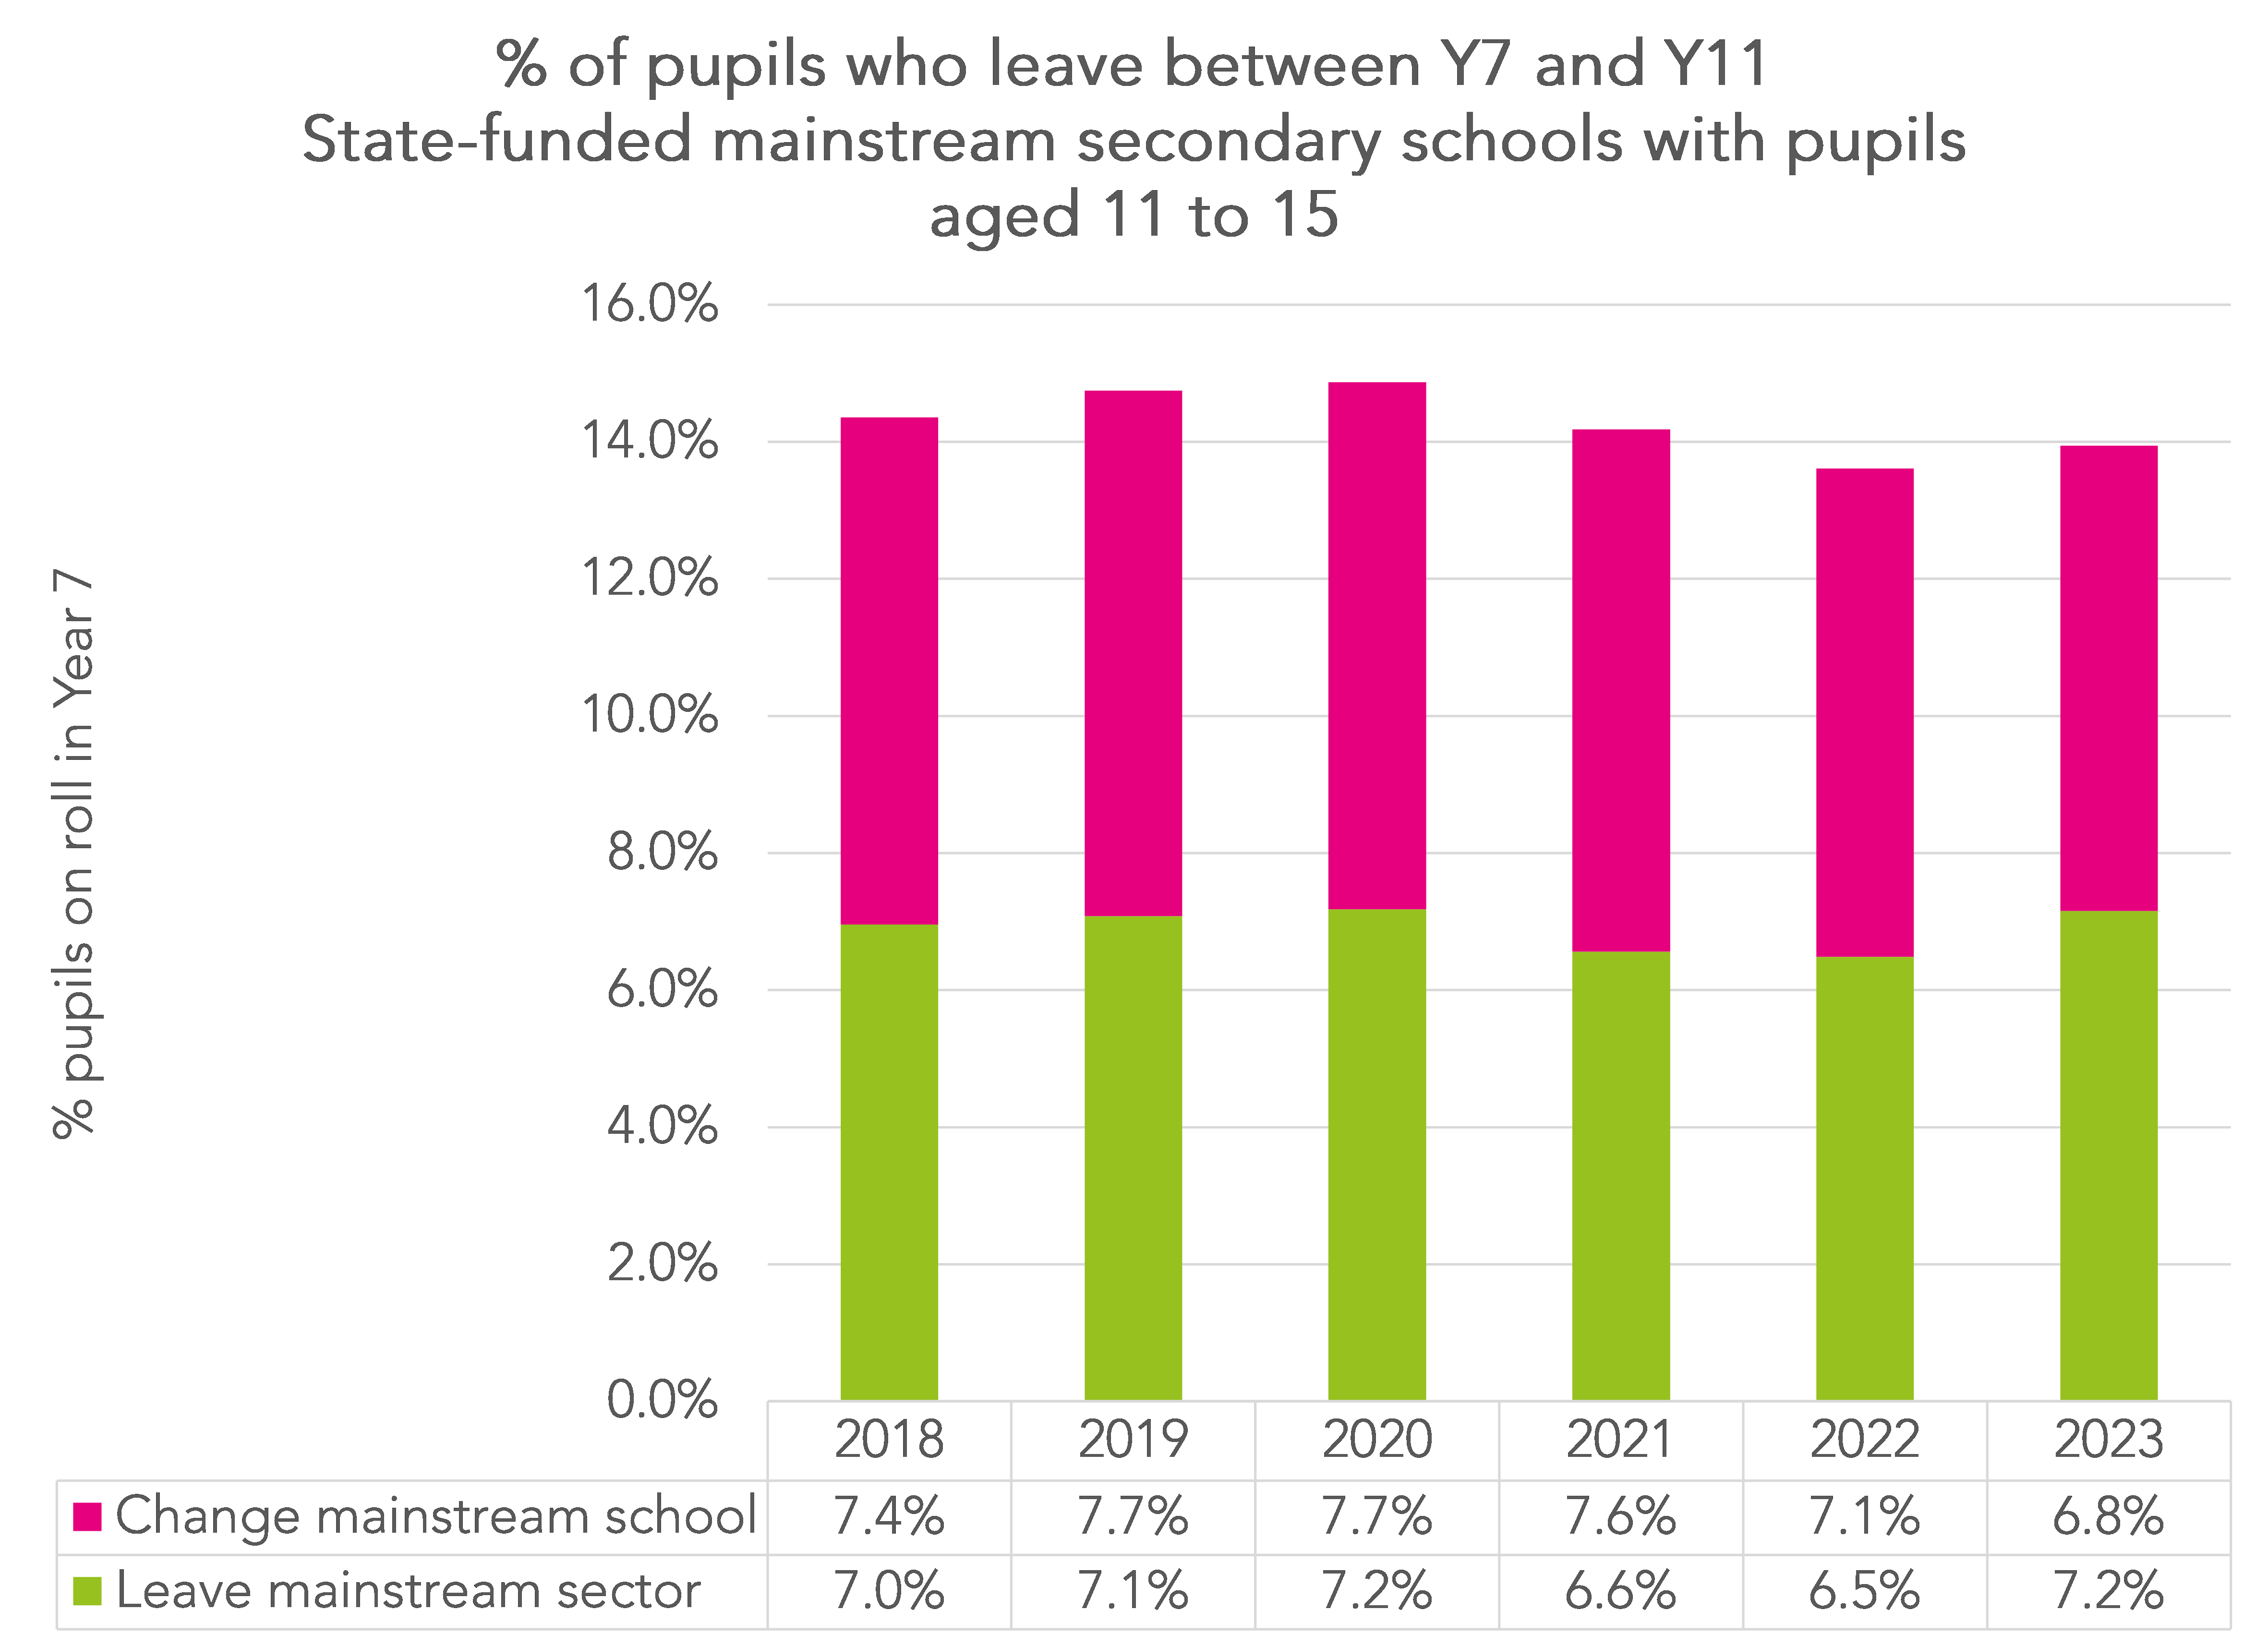
As we saw in the previous section, the percentage of pupils who left the mainstream sector was lowest among the 2021 and 2022 cohorts. But other than that, rates of pupils changing mainstream school and leaving the mainstream sector were broadly stable. In 2023, the percentage of pupils who left the sector altogether was slightly higher than the percentage who changed mainstream school. In previous years, the latter figure tended to exceed the former figure.
Final destinations
Let’s examine the final destinations of our 6 cohorts in a bit more detail.
By final destination, we mean the type of school against which pupils were recorded in Key Stage 4 data.

For most destinations, the percentages of pupils remained relatively stable from year to year.
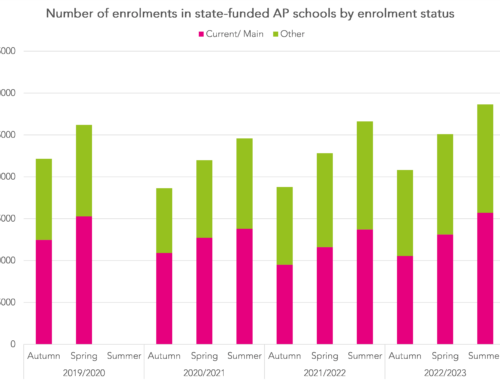
However, there has been a general decline in pupils completing Key Stage 4 at AP schools, at least in as far as the Key Stage 4 data shows.
But there has also been an increase in the proportion of pupils leaving with no destination. This will include an unknown number of pupils who have emigrated.
The characteristics of leavers
To finish, we examine some of the characteristics of pupils who change school or leave the mainstream sector.
We do this for the following characteristics:
- Gender
- Ethnic background
- Special educational needs (SEN) status (as at Year 7)
- Ever eligible for free school meals (FSM) by Year 7
- Key Stage 2 reading and maths test outcomes
- Exclusions and suspensions up to the end of 2022[3]
- The 2023 Progress 8 score of the school attended in Year 7, using the bandings that appear in School Performance Tables.
One limitation we acknowledge is that exclusions and suspensions are based on pupils’ full school histories up to the end of Year 10. We do not look here at whether exclusions and suspensions precede school moves or take place afterwards. That will have to be for another day.
Results are shown in the charts below.
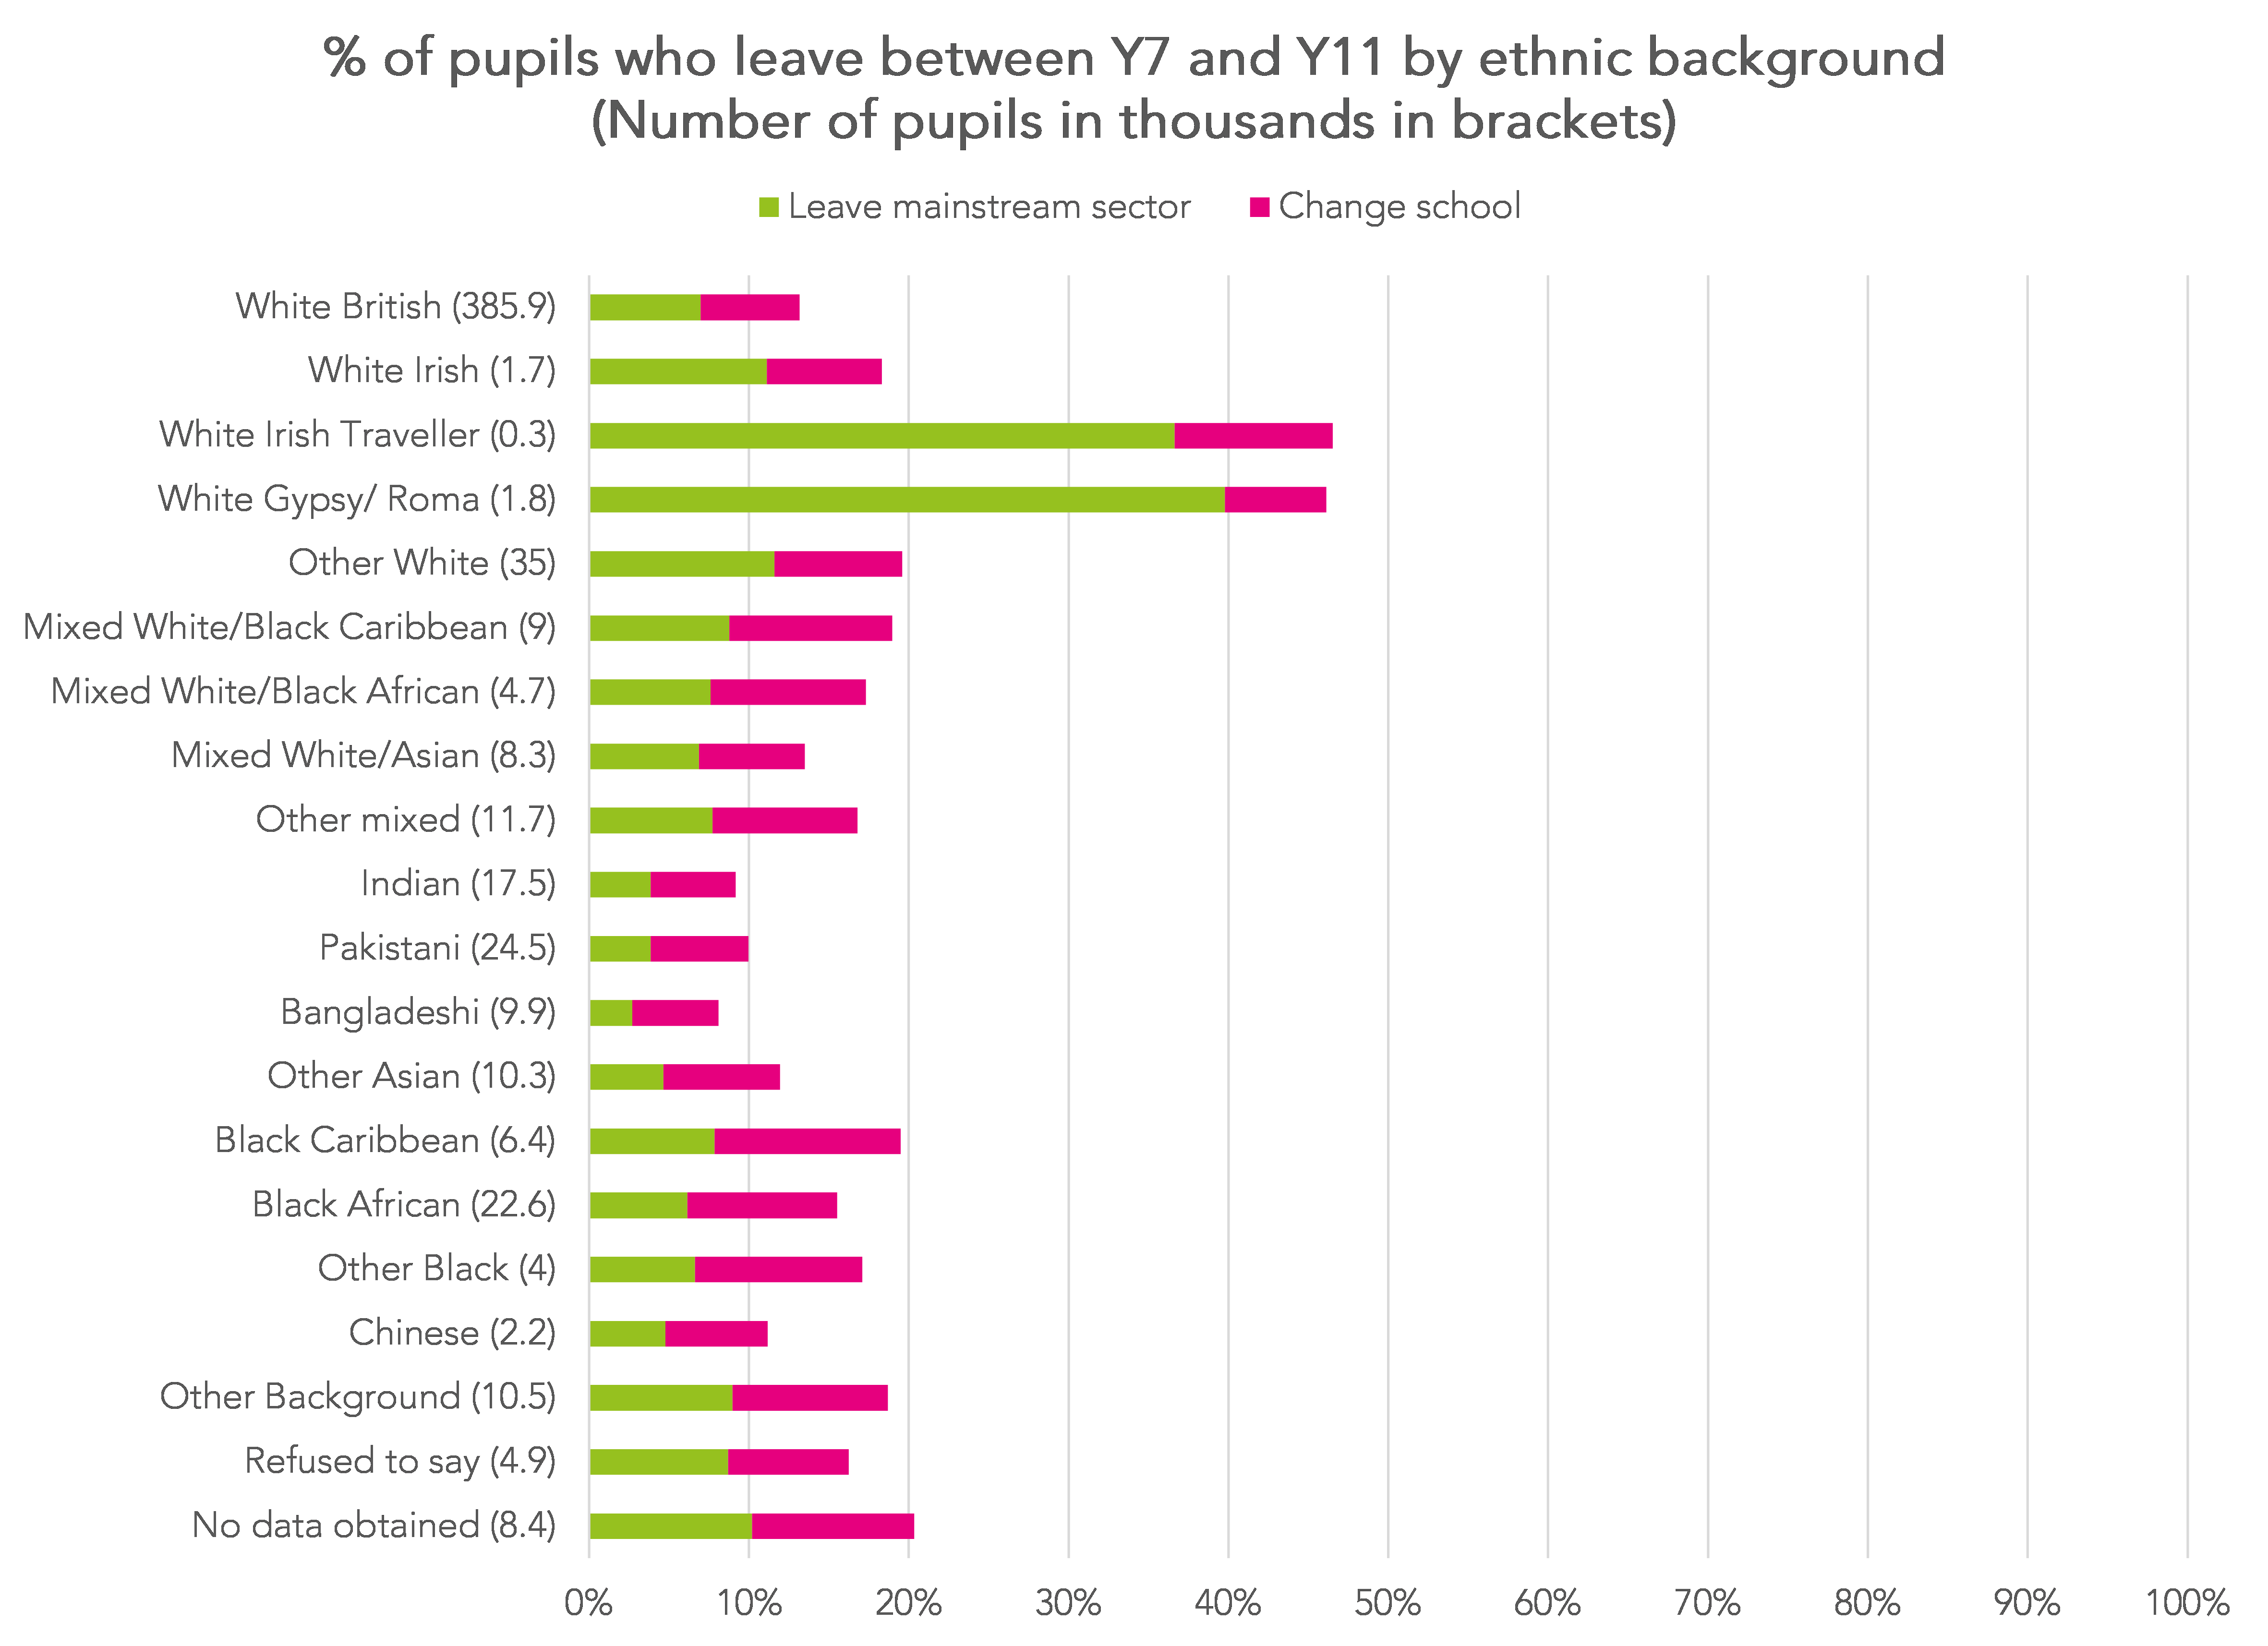
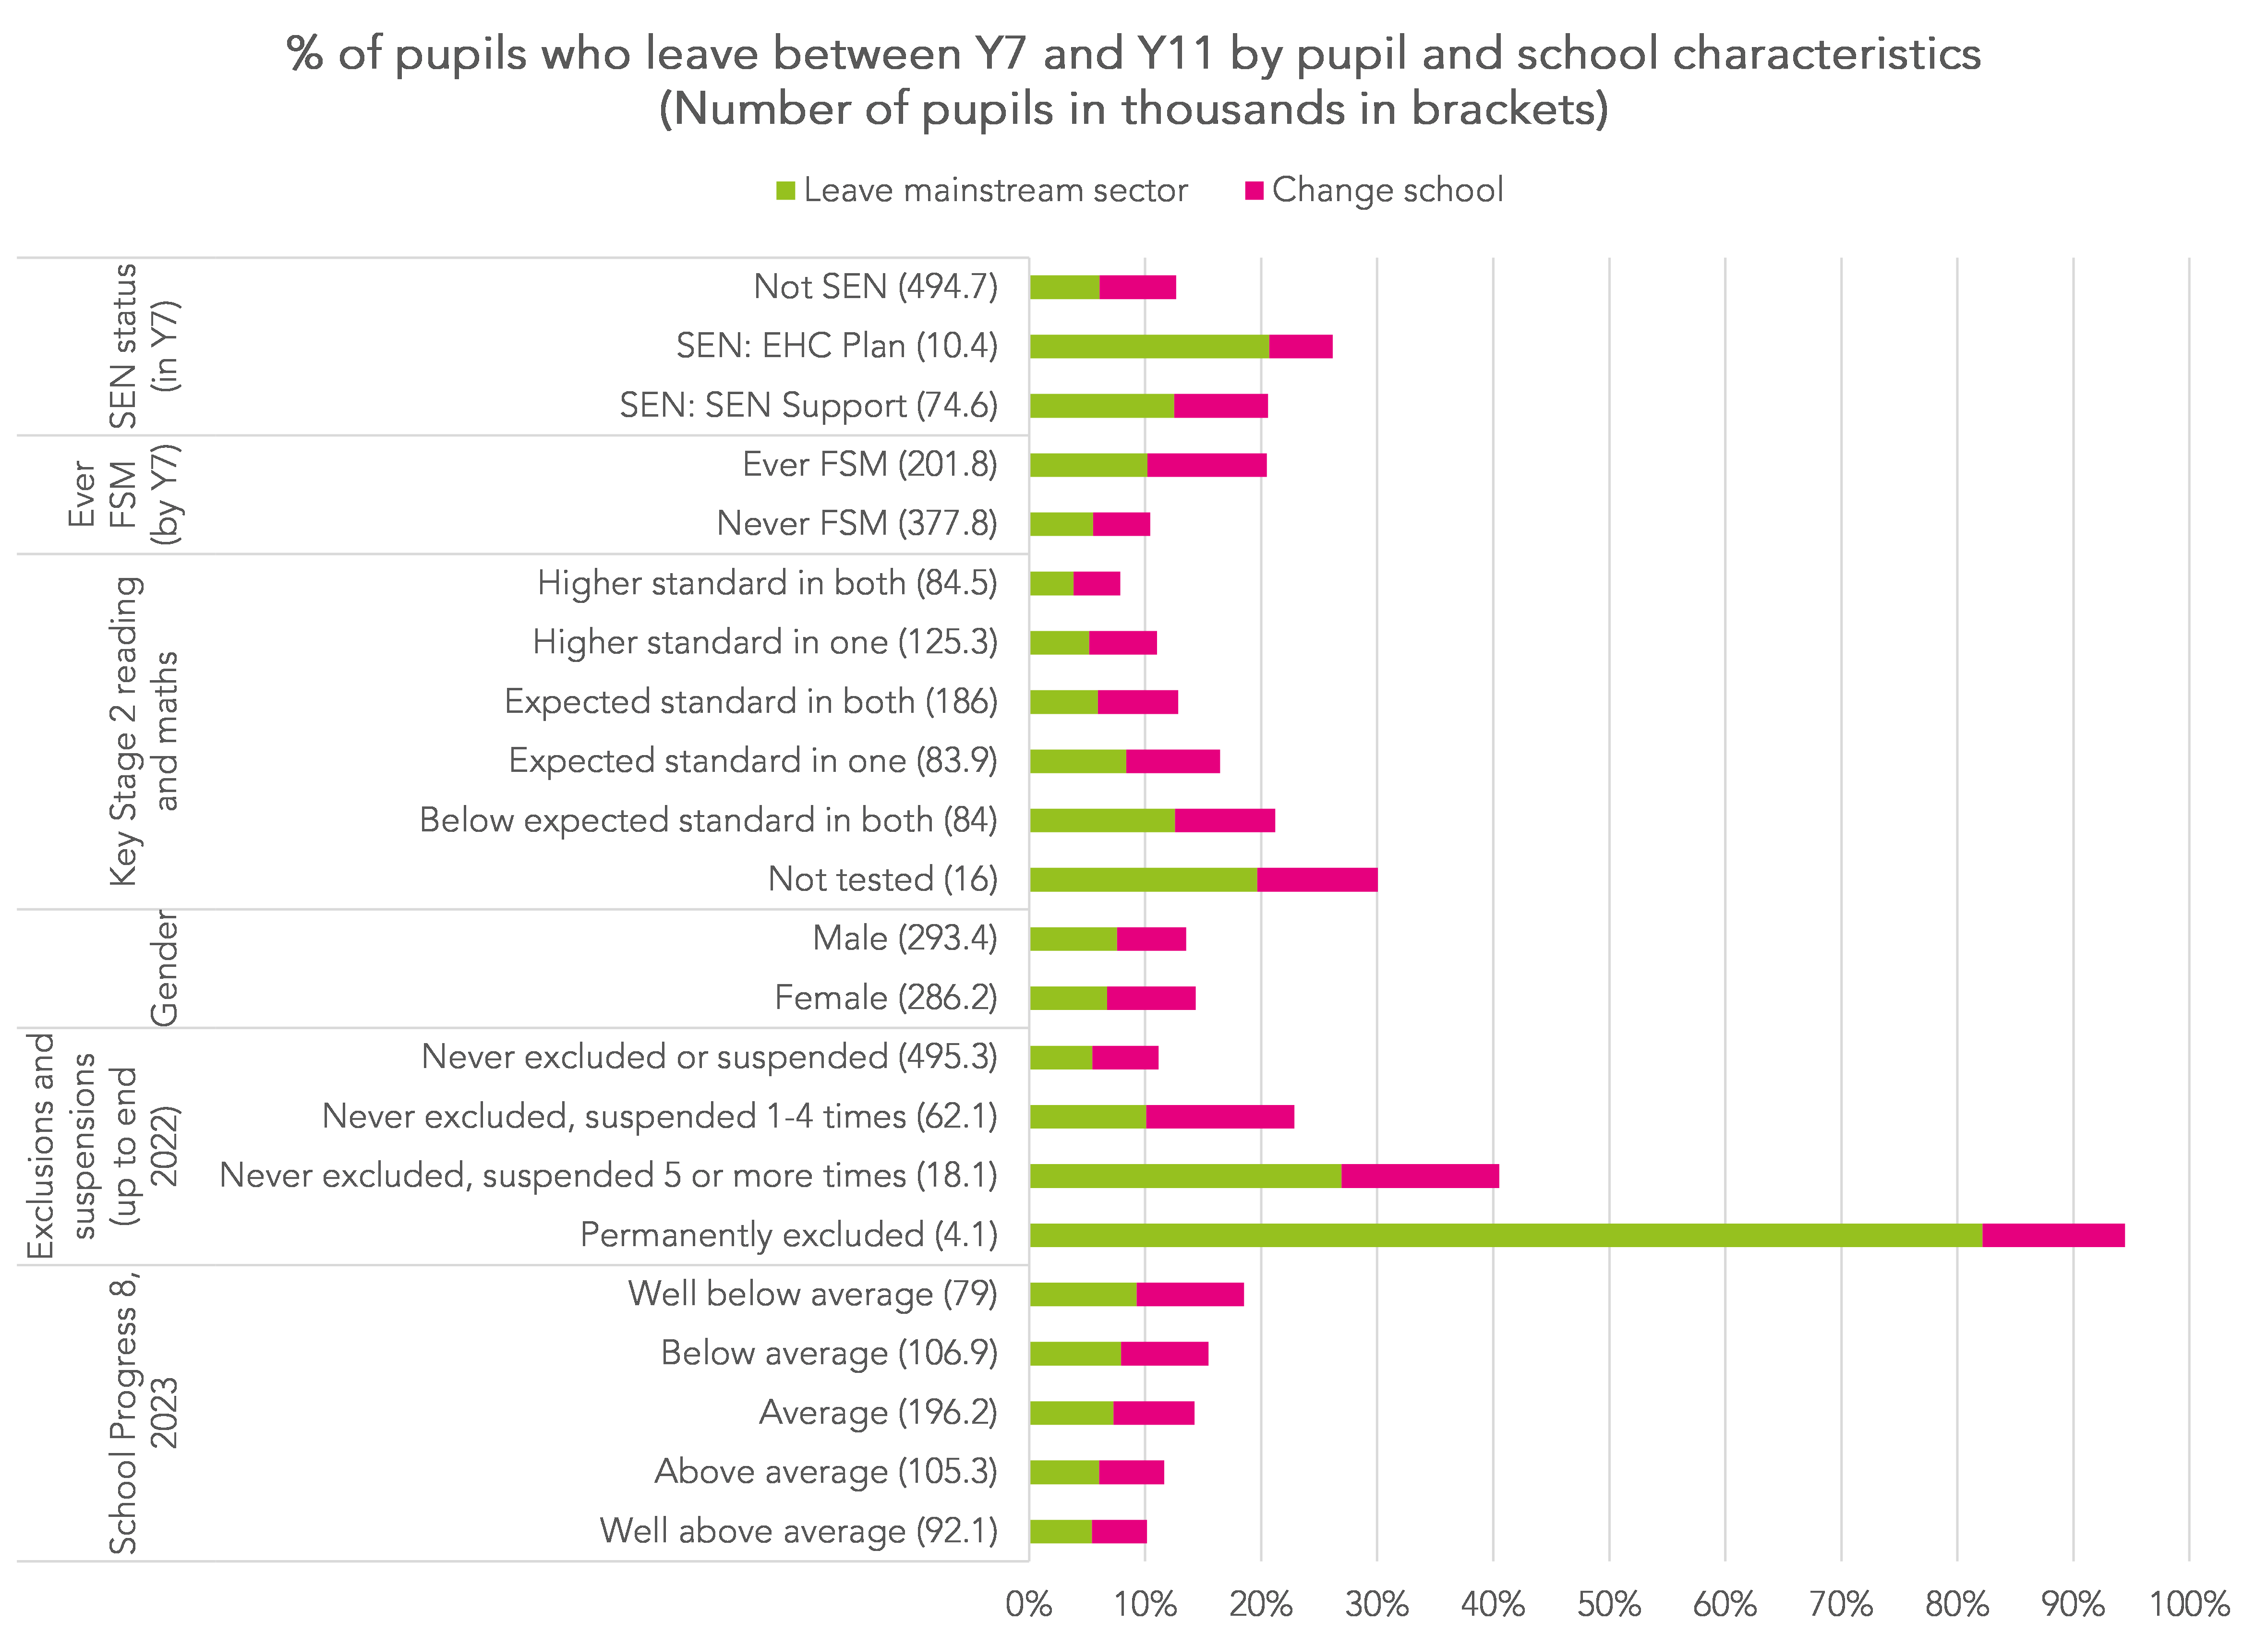
Broadly speaking, and perhaps unsurprisingly, vulnerable pupils tend to be more prone to mobility. This includes those who are economically disadvantaged, those with special educational needs, those with a history of exclusion or repeat suspension, and those with lower levels of Key Stage 2 attainment. There are substantial overlaps between these groups, of course.
It is also the case that outward pupil mobility is higher among lower performing schools. But as we (and many others) have shown, lower performing schools tend to have higher proportions of pupils in the groups listed above.
Summing up
In this article we’ve taken a more recent look at the extent to which pupils change schools between Year 7 and Year 11.
Some degree of pupil mobility is to be expected as result of families moving, changes in care placements and so on. We can’t tell from data alone whether school moves are entirely the decision of the family/ carers but what we can do is examine how rates of mobility vary between schools and between pupil groups.
The figures we show are pretty stable for the last six cohorts of pupils completing Key Stage 4. There were slightly fewer pupils who left the state-funded mainstream sector during 2021 and 2022. Exams were cancelled in the first of these years, and and a slight increase in the proportion for which a destination cannot be determined over the last few years.
It remains the case that vulnerable pupils are the most likely to experience a change of school.
Current published headline measures in School Performance Tables at present are based on pupils on roll in Year 11 in the January School Census. You can find measures for “non-mobile” pupils (those on roll throughout Year 10 and Year 11) buried in them but they do not have the prominence of the overall measures. Even then, they do not consider the attainment of any pupils who left before Year 10.
This is why we have previously argued for creating “weighted” measures that account for all pupils on roll between Year 7 and Year 11 but “weighted” by the number of terms each pupil spends on roll.
This is not necessarily either/ or. Although possibly too much for Performance Tables, versions of Progress 8, for example, could be presented in Ofsted’s IDSR: the current version, a weighted version, even a contextualized version.
Alternatively, simple statistics such as the percentage of Year 7 pupils who finish Key Stage 4 at the same school could be presented. Perhaps they could be included in a balanced scorecard of performance such as the School Quality Index.
In any event, more data would help present a broader perspective on a school’s performance.
[1] Although exclusions are recorded, reasons for pupils leaving school cannot be inferred
[2] For example, a pupil counted as a leaver in Autumn of Year 9 would not be counted as a leaver in Spring of Year 9 if they appeared on the roll of a school
[3] Data for 2023 is not yet available
Want to stay up-to-date with the latest research from FFT Education Datalab? Sign up to Datalab’s mailing list to get notifications about new blogposts, or to receive the team’s half-termly newsletter.

Leave A Comment