As well as publishing the Progress 8 measure, the Department for Education (DfE) also publishes a number of other “value added” measures[1] of attainment at Key Stage 4.
These are value added measures of each of the four “buckets” that comprise the Progress 8 (and Attainment 8) measures: English, maths, other EBacc subjects and any other subjects. These measures are calculated for all pupils in a school’s cohort.
In addition, separate value added scores are produced for the three EBacc slots other than English and maths: Science, humanities and languages. These are only calculated for pupils entered for those subjects.
In this blogpost we are going to take a look at the languages value added (VA) measure and make a suggestion for redefining it in future.
Data
We use Key Stage 4 pupil and exam data from the National Pupil Database from 2023. We are using the “unamended” version of the data (prior to the publication of Performance Tables) and so any differences compared to published figures arise from this.
We limit the analysis to state-funded mainstream schools.
We find that 271,500 pupils were entered for at least one GCSE in a language, 45% of the full cohort.
Of those entered, 18,930 (7%) were entered for 2 or more languages. For these pupils, we find their highest scoring language for use in the following analysis. In the case of ties, we select the subject entered first (based on examination date).
Which languages did pupils enter?
In the following table, we show the number of entries in each language. The table distinguishes those included in the VA measure and those who weren’t. This latter group is made up of pupils without a measure of prior attainment as a result of being educated outside England or in the independent sector at the time they would have been taken.

The typical modern foreign languages of French, Spanish and, to a lesser extent, German occupy the top 3 spaces, accounting for 242,830 entries (almost 90% of all entries in languages).
The relationship with prior attainment
Next, let’s see how attainment in GCSE languages varies with respect to prior attainment.
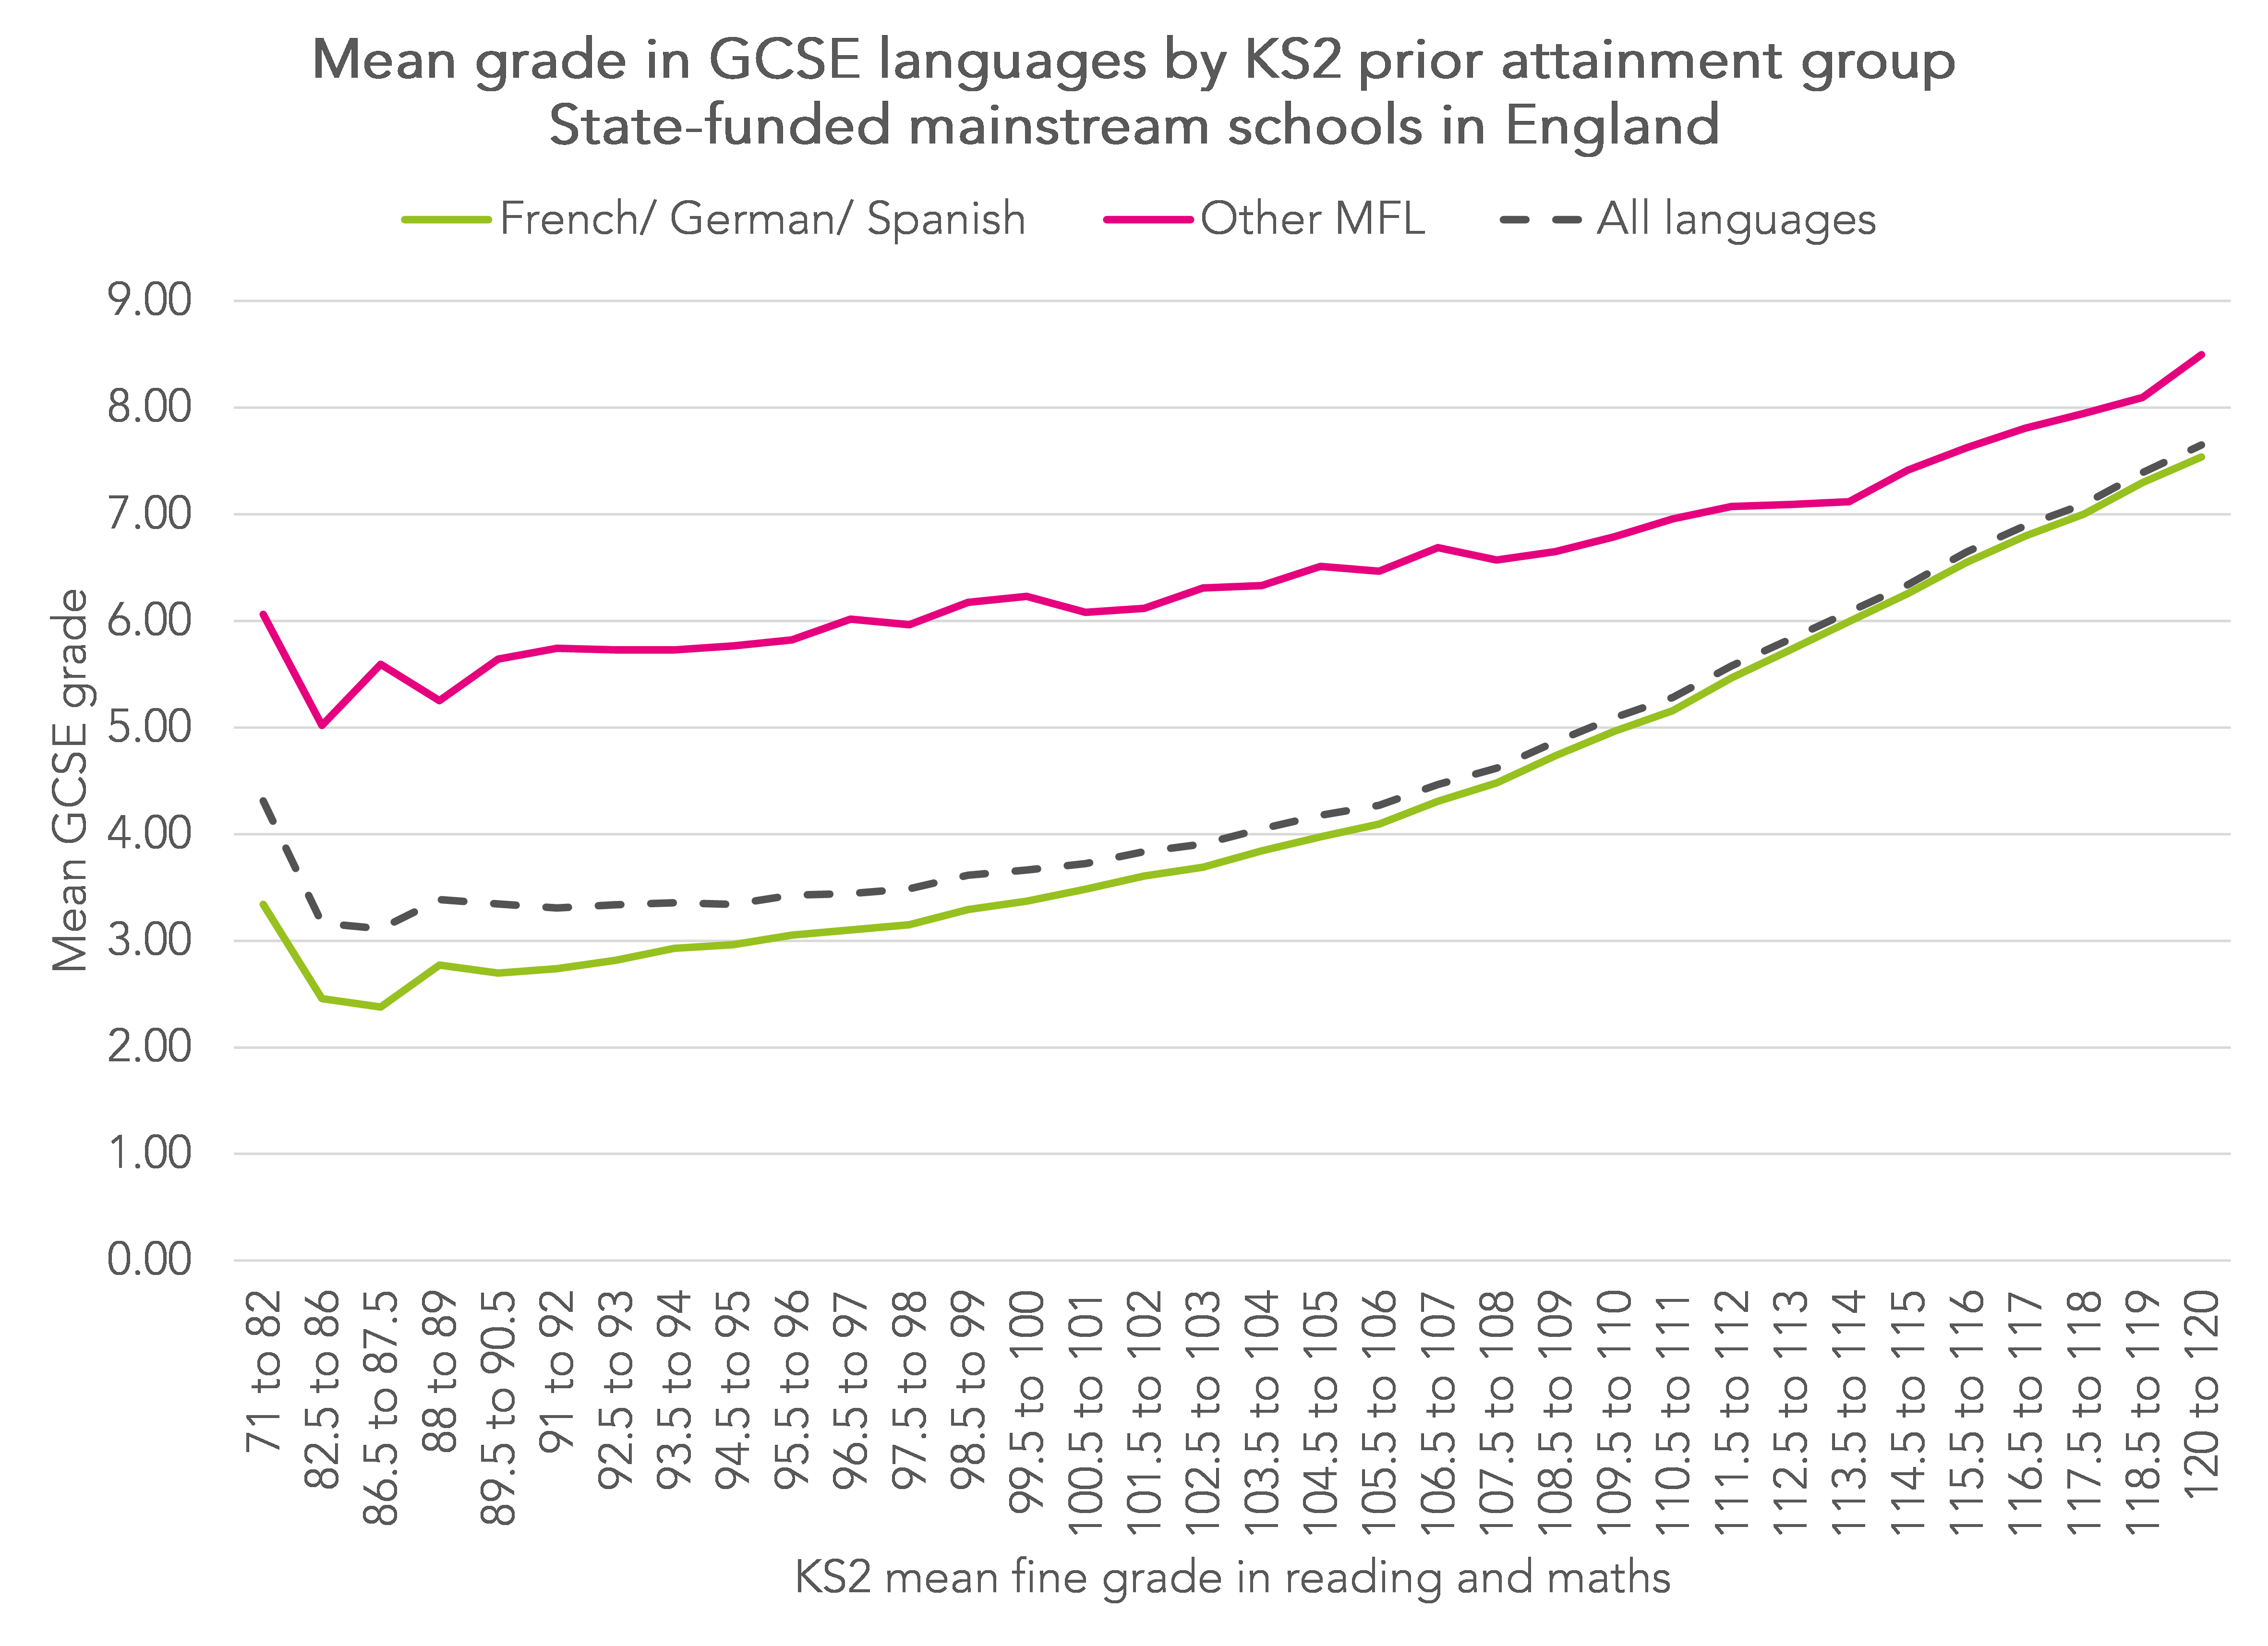
The broken line indicates how GCSE attainment increases with prior attainment for all languages combined. This line defines a notional expectation against which pupils’ actual results are compared to calculate the VA measure. For example, the expectation for a pupil with a KS2 score of 112.5 or 113 would be 5.83 points. If they achieved a grade 7 they would contribute a score of 1.13 towards their school’s VA score.
We also provide two other lines.
The first (slightly lower) line indicates attainment in the “top 3” languages of French, German and Spanish.
The second (higher) line indicates attainment in other languages.
In other words, pupils who enter other languages (which may well be the languages they speak at home), tend to achieve far higher grades in those languages than do pupils with similar prior attainment in French, German and Spanish.
How languages VA varies by subject
We can now see how language VA scores vary by subject entered.
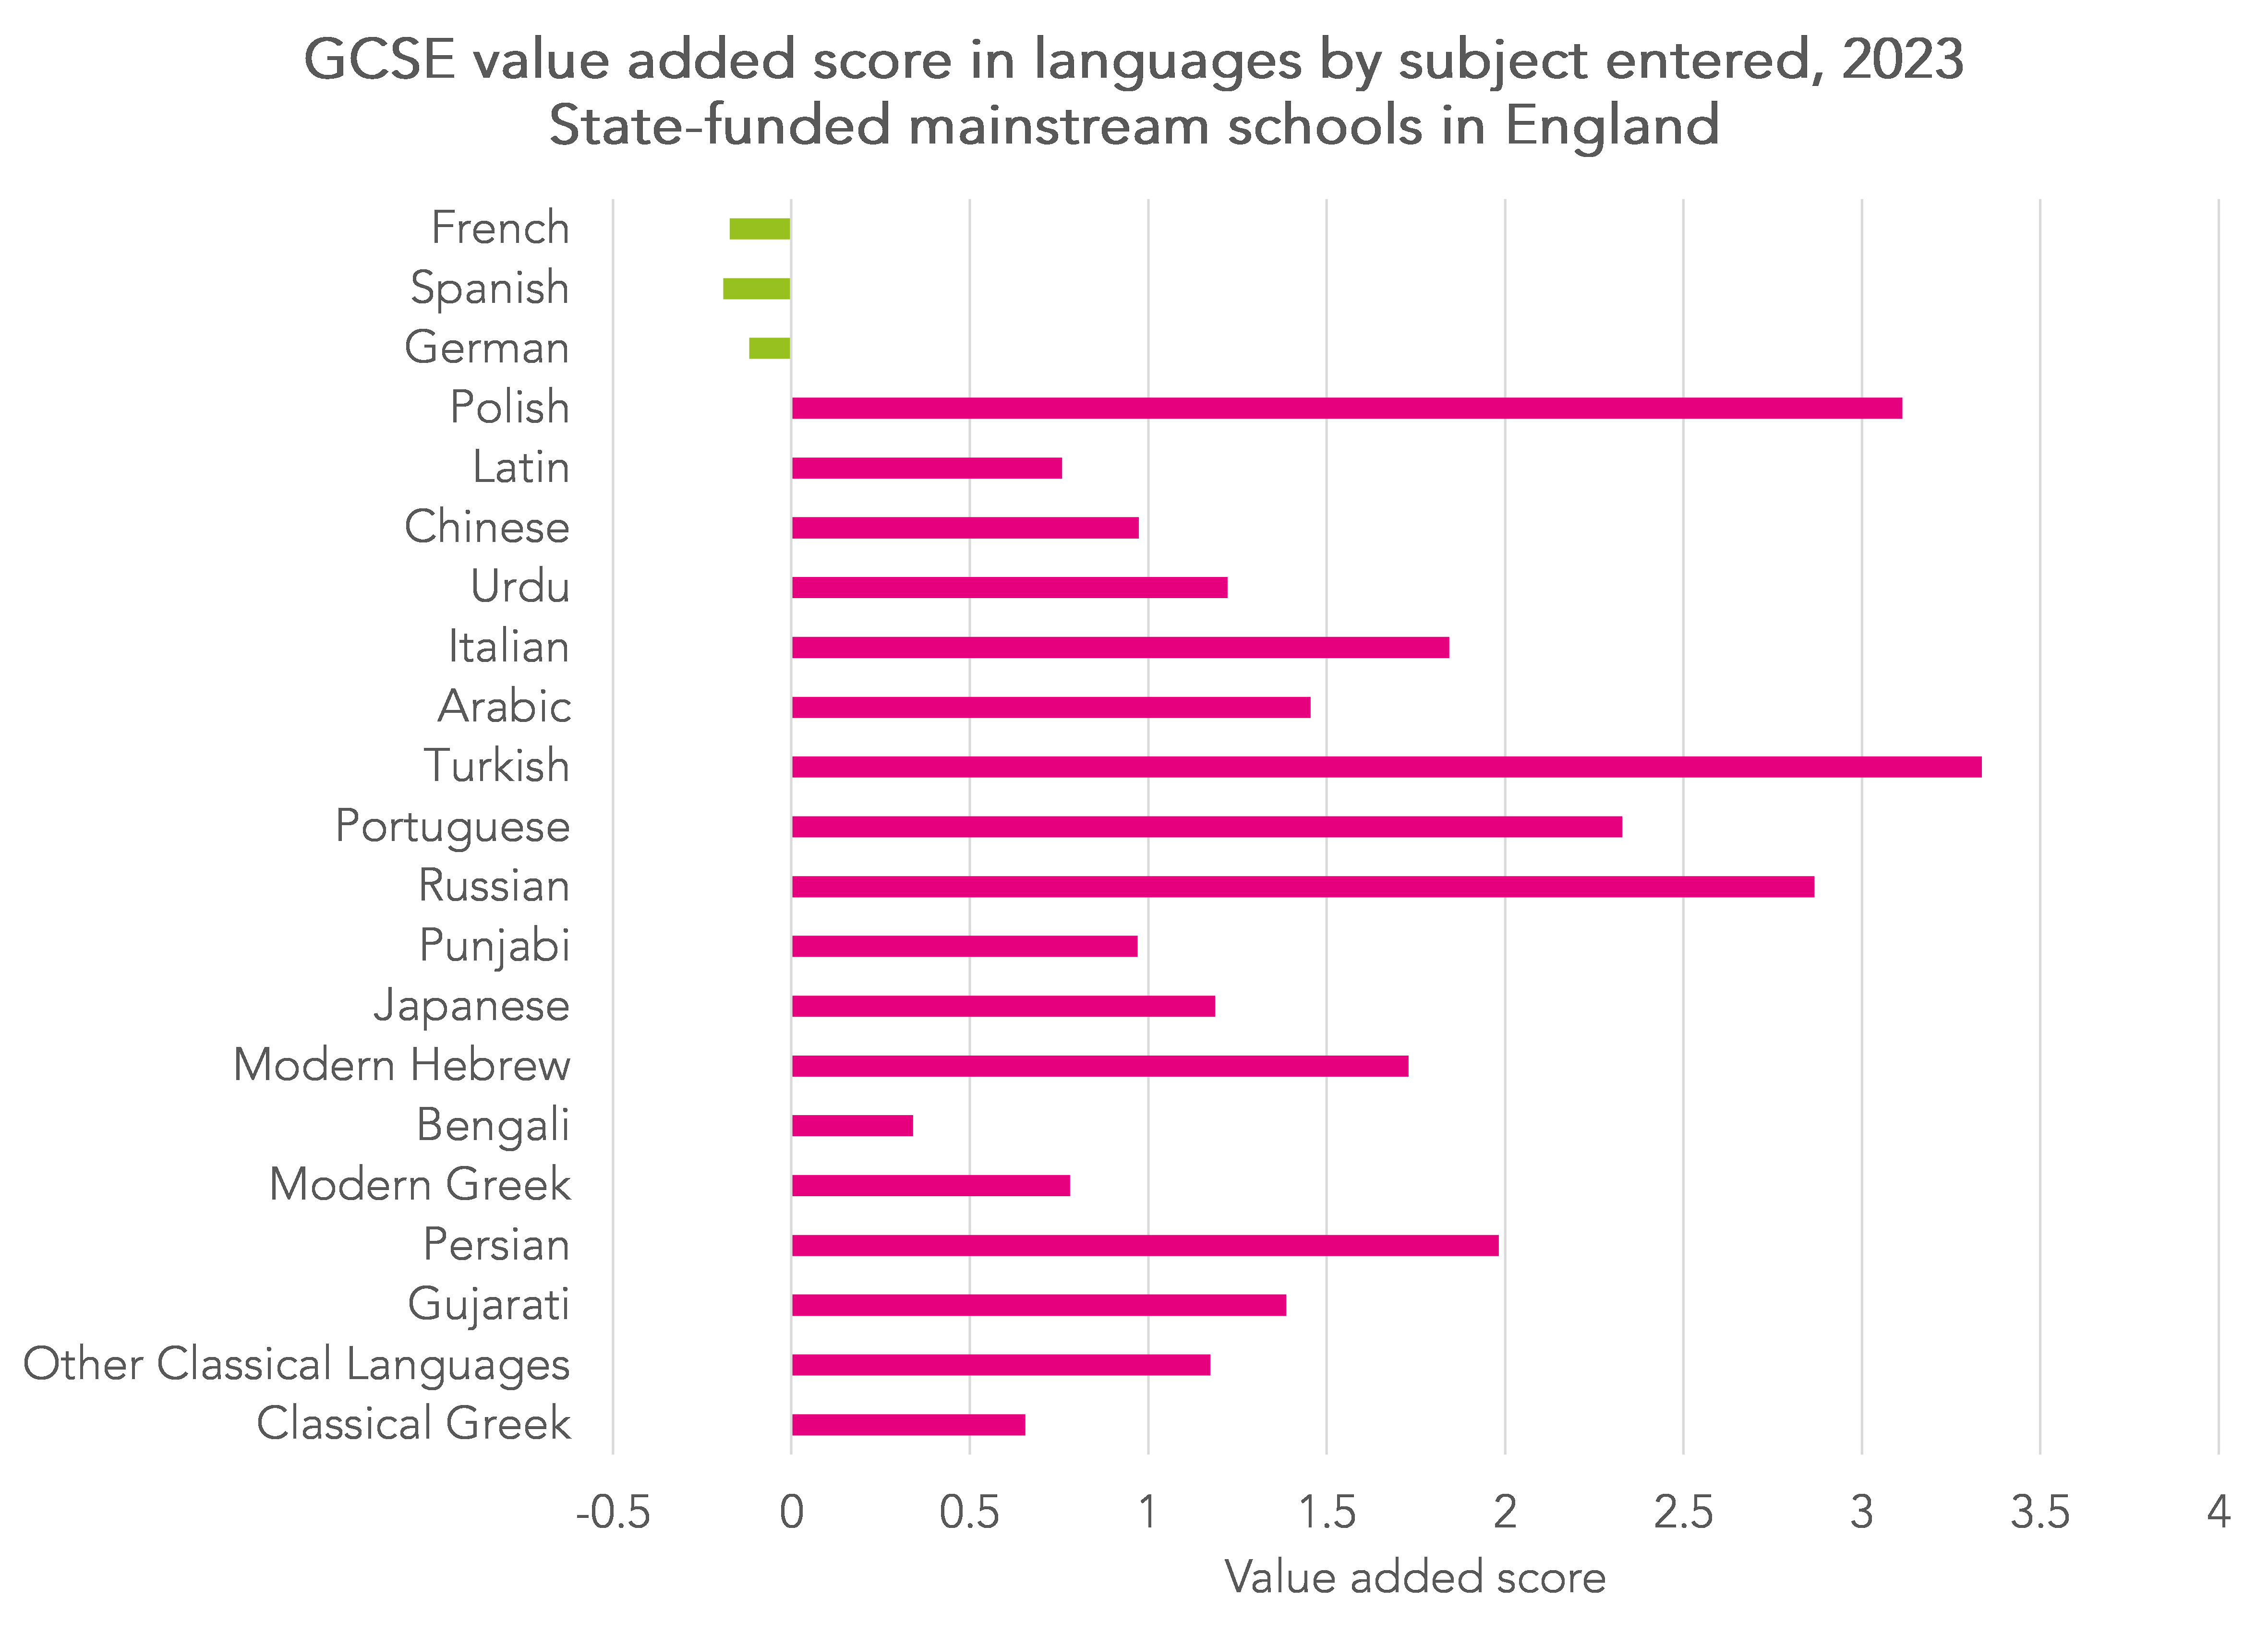
On average, pupils who enter French, German and Spanish achieve negative VA scores and pupils who enter other languages tend to achieve positive VA scores.
Those who enter Polish, Portuguese, Russian and Turkish achieve two grades higher on average compared to other pupils entered for languages.
Impact at school level
3,120 schools had at least 10 pupils included in the languages VA measure. We calculate the average languages VA score for each of these schools, along with the percentage of languages entries in “other languages”, i.e. not including French, German and Spanish.
In the chart below, we group schools according to the percentage of their entries in languages that were in other languages.
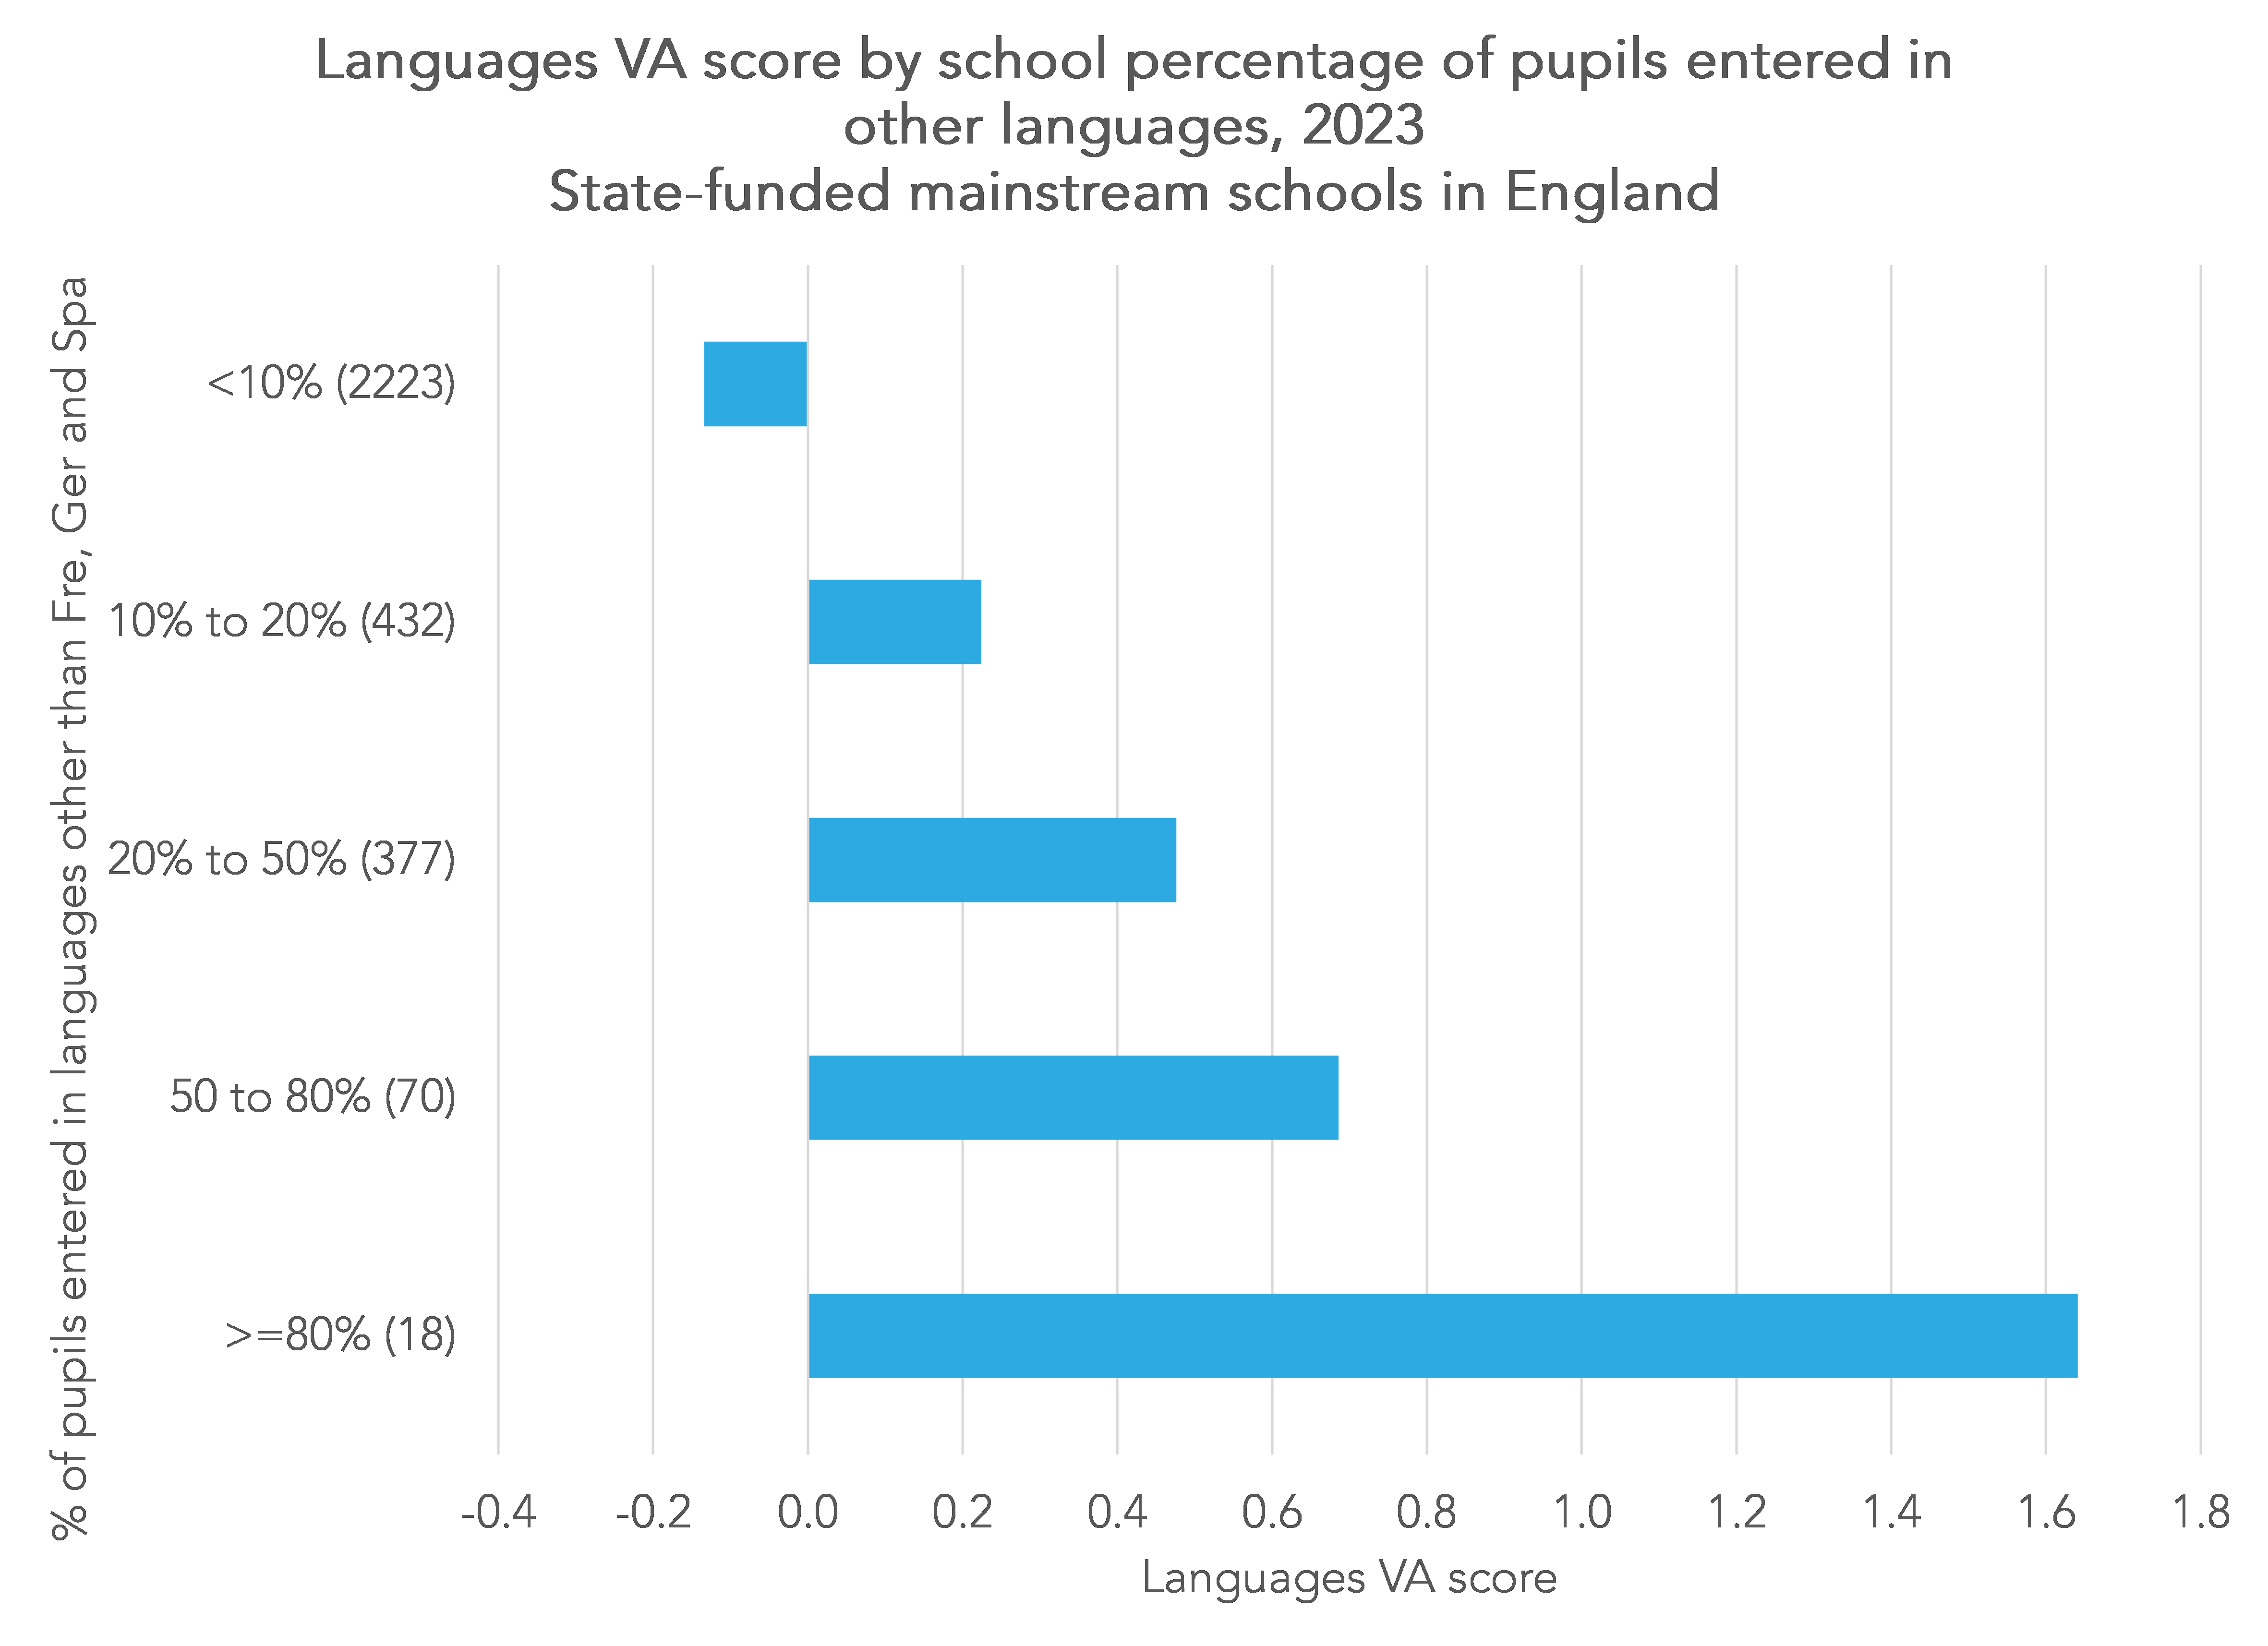
Just 18 schools had at least 80% of their entries in languages in other languages. However, their VA scores tended to be high (1.64 on average).
By contrast, 2,223 schools had less than 10% of their entries in languages in other languages (or put another way, at least 90% of their languages entries in French, German and Spanish). On average, their VA score was -0.13.
Keep an eye on the percentage of the cohort entered in languages
One other thing to watch out for when comparing schools’ VA scores in languages is the percentage of the whole cohort that are entered for French, German and Spanish.
We calculate this figure for each school in the chart below, dividing schools into 5 groups again and comparing the VA score for each group[2].
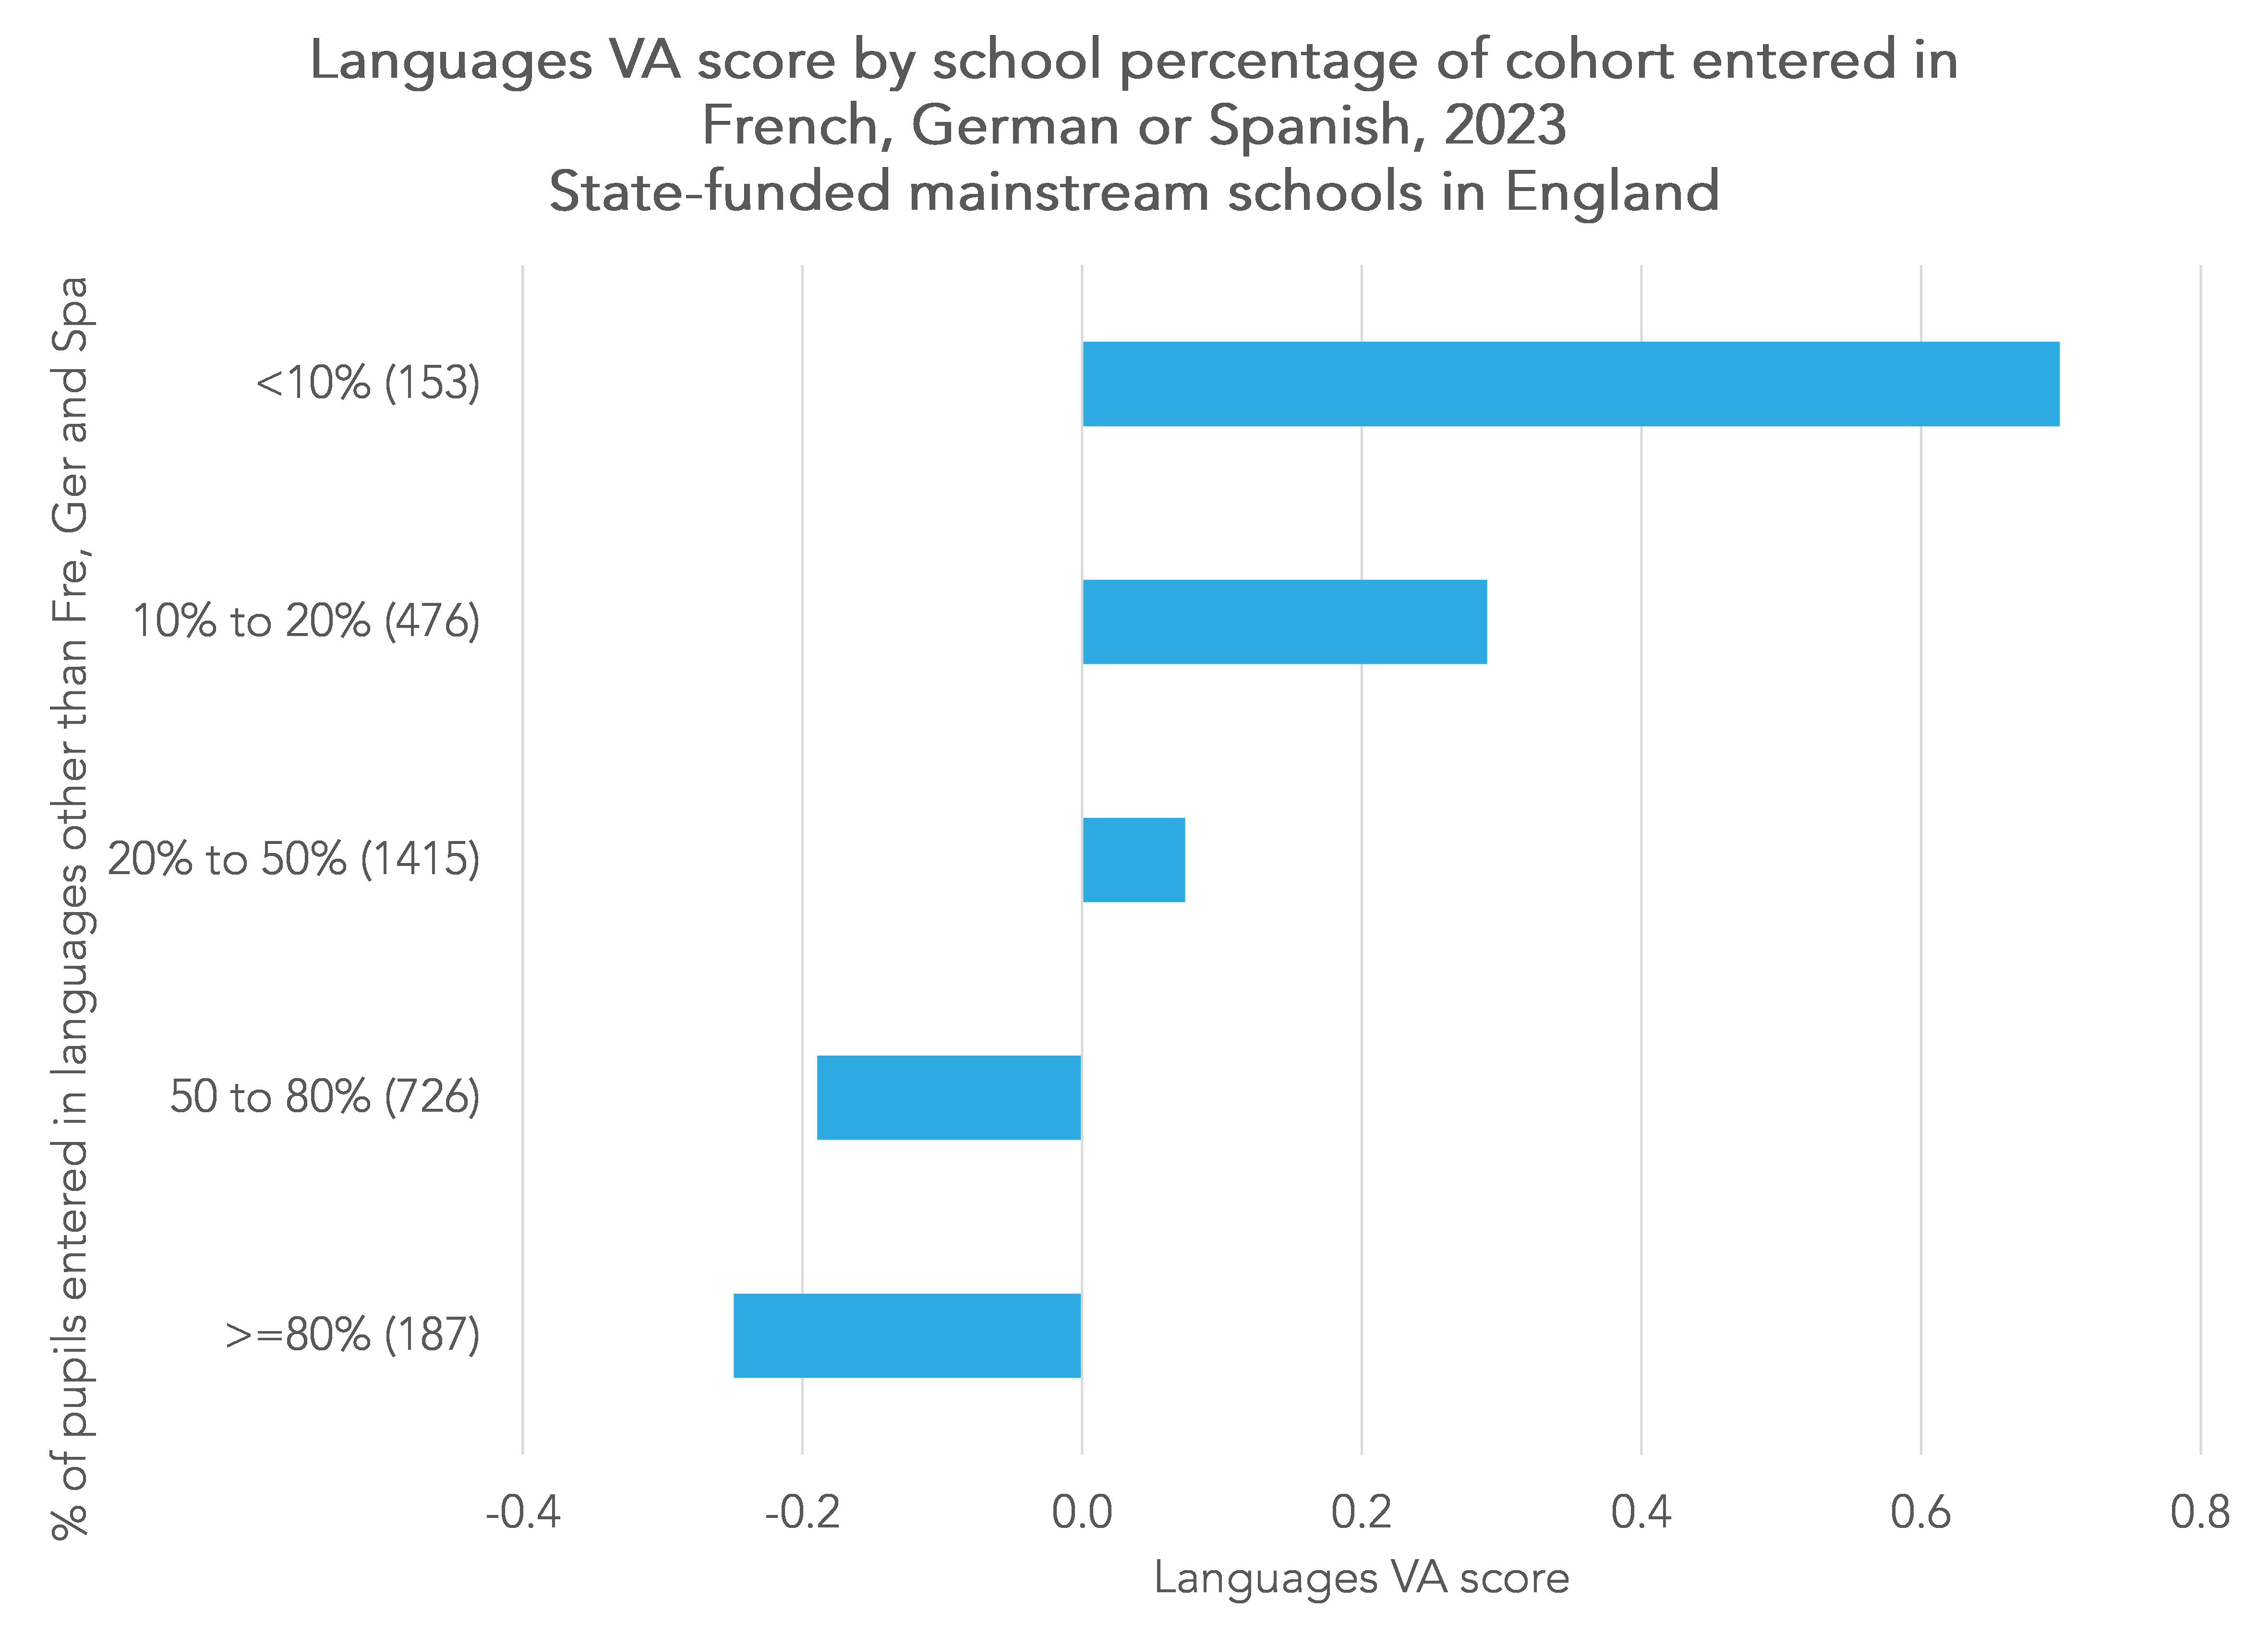
Here we see that those schools that enter relatively few pupils in French, German and Spanish tend to achieve the highest VA scores.
Some of this will be due to the community languages issue highlighted in the previous section.
But some of it is likely to be due to motivational factors. In schools with low entry rates in languages it is more likely that pupils have made a positive choice to study a language.
Summing up
Pupils who enter languages other than French, German and Spanish, tend to achieve higher grades than pupils with similar prior attainment who enter those three languages.
This has consequences for the languages value added measure published in School Performance Tables. Schools that make more use of community languages will tend to achieve better VA scores.
As a minimum, this could be addressed by calculating separate expectations for French/ German/ Spanish and for other languages in the languages VA measure.
However, this does nothing to address the comparability of scores between schools that enter most of their cohort in languages and schools that enter only a minority of pupils.
And if we can get away with a small plug, our FFT Aspire system has VA scores for individual languages (and all subjects for that matter).
- Value added measures are measures of attainment that take account of pupils’ prior attainment, e.g. measures of attainment at Key Stage 4 take account of attainment at the end of Key Stage 4.
- Selective schools are excluded from this chart
Want to stay up-to-date with the latest research from FFT Education Datalab? Sign up to Datalab’s mailing list to get notifications about new blogposts, or to receive the team’s half-termly newsletter.


We also need to be careful not to assume that all pupils entered in languages outside the ‘big three’ are native speakers. Some schools teach these languages as one of their main language offer (ie to a cohort rather than just native speakers). For example, a school might offer Spanish and Chinese as the two languages from KS3. When the value-added is calculated for the Chinese cohort it will be distorted by the inclusion of native speakers nationally, whose attainment will be relatively high given their overall prior ability. A separate value-added calculation for native and non-native speakers would overcome this and might put different languages on an equal footing.
Can further breakdown be found, across cities? A comparison in such detail, ref to VA, non VA, like the above comment. At state schools versus private schools, or those opting to sit a GCSE at college, depending on the providers, so not just results of GCSE from schools, and how many pupils chose at GCSE 1 or 2 languages, of that cohort, were any sitting let’s say German with Chinese, based on perhaps mother tongue spoken at home. A combination that mixed up non EU with EU?
How many of those who achieved a pass at GCSE in a language are registered to carry on to A level?
Hi Melissa- Yes, it would be feasible to do some more (we’ve been meaning to do something on the last question for instance, though expanding it to all subjects). That said, DfE publish a lot of these statistics (e.g. % of pupils doing 2 or more languages by local authority) although they can be a bit cumbersome to work with https://explore-education-statistics.service.gov.uk/find-statistics/key-stage-4-performance#explore-data-and-files