Earlier this year the Department for Education (DfE) launched Regional Improvement for Standards and Excellence (RISE) teams.
These teams will work with schools in two ways:
- A universal service to help schools improve by promoting collaboration and sharing best practices
- A targeted service for schools identified by Ofsted as needing to improve.
In a boldly-titled blog, DfE supposedly set out everything we need to know about how the teams will work.
However, it does not tell me what I want to know, which is how their impact will be evaluated.
DfE may well have this in hand already. No doubt there will be evaluation plans and internal monitoring. Maybe they will put out a tender for an independent evaluation at some point.
In the meantime, I’m going to set out a fairly simple method of evaluating the impact of their targeted intervention work.
This can be achieved by using publicly-available datasets to go back in time to examine how schools that would have been eligible for intervention in the past subsequently went on to perform.
The first set of RISE schools
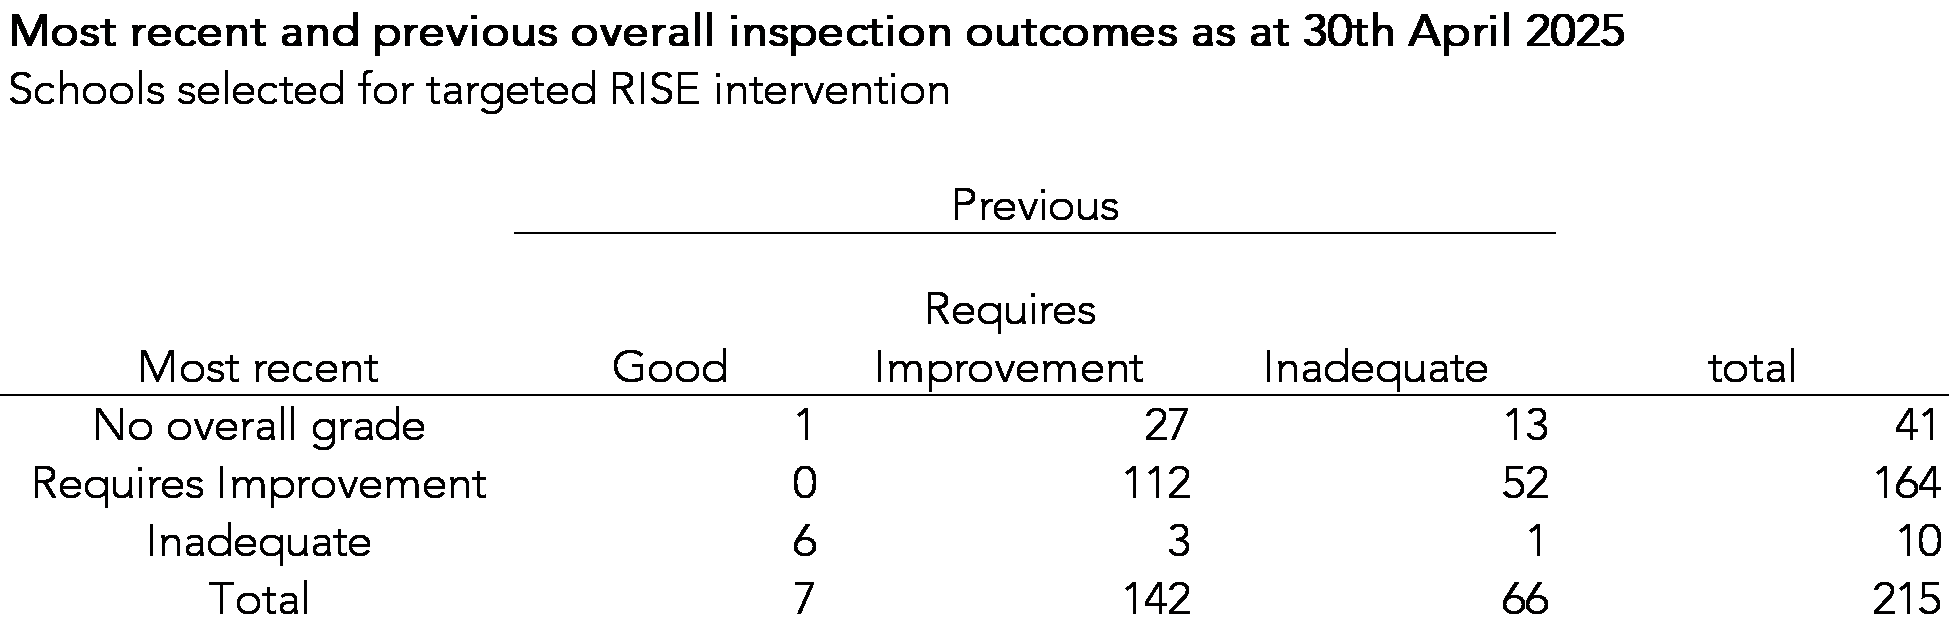
We link together the published list of 215 schools selected for targeted intervention by RISE teams with their most recent inspection grade and their previous inspection grade for the 215 schools. This comes from Ofsted Management Information for April 2025.

The majority are “stuck” schools: state-funded schools graded Requires Improvement (RI) – or equivalent – at their most recent Ofsted inspection and were also graded below Good at their previous Ofsted inspection[1].
Those whose most recent inspection was in September 2024 or later do not have an overall grade. They all have a quality of education sub-judgment of RI or inadequate[2].
10 schools were judged inadequate overall. These would not be considered “stuck” but appear to be in scope of the RISE teams by dint of being judged inadequate having undergone structural intervention, such as becoming an academy or changing Trust.
We can see this more clearly if we break down the set of 215 schools that will receive RISE intervention by a) overall effectiveness judgment (or quality of education if inspected after 31st August 2024), b) type of school (academy/ free school or other[3]) and c) whether they have undergone structural change since their penultimate inspection.
In total, there are 203 stuck schools selected for intervention, of which 58 are academies or free schools that have already undergone a recent structural change.
How schools were selected for targeted intervention
The criteria used to select schools for targeted intervention were (largely) straightforward, being (largely) stuck schools.
However, not all stuck schools are in the list of 215.
Using Ofsted Management Information for April 2025 we identify 650 stuck schools. Additional criteria are then used to select those for intervention:
- Those that are currently undergoing structural intervention (or are imminently about to) are not included. However, we do not know who these are as data on Academy transfers is not publicly available (surely it should be?).
- In addition, according to insiders that I spoke to, there appears to be an element of qualitative judgment about which schools will receive intervention.
Following the above, we end up with 215 schools.
The selection of secondary schools
112 of the 215 intervention schools are secondary schools[4]. Of these, 106 meet the definition of a stuck school. We focus on this group for the rest of the article.
From our list of 650 stuck schools we identify 237 secondary schools. This means that just under half (45%) are eligible for targeted intervention by RISE teams.
We then examined the probability of the 237 schools being selected for RISE intervention on the basis of 5 variables:
- Whether the school had undergone a structural change since its penultimate inspection
- Number of days graded below good
- Progress 8 score 2024[5]
- Inspection judgment for the effectiveness of leadership and management in the most recent inspection
We run the data through a simple classification tree in which we predict being selected for RISE intervention.
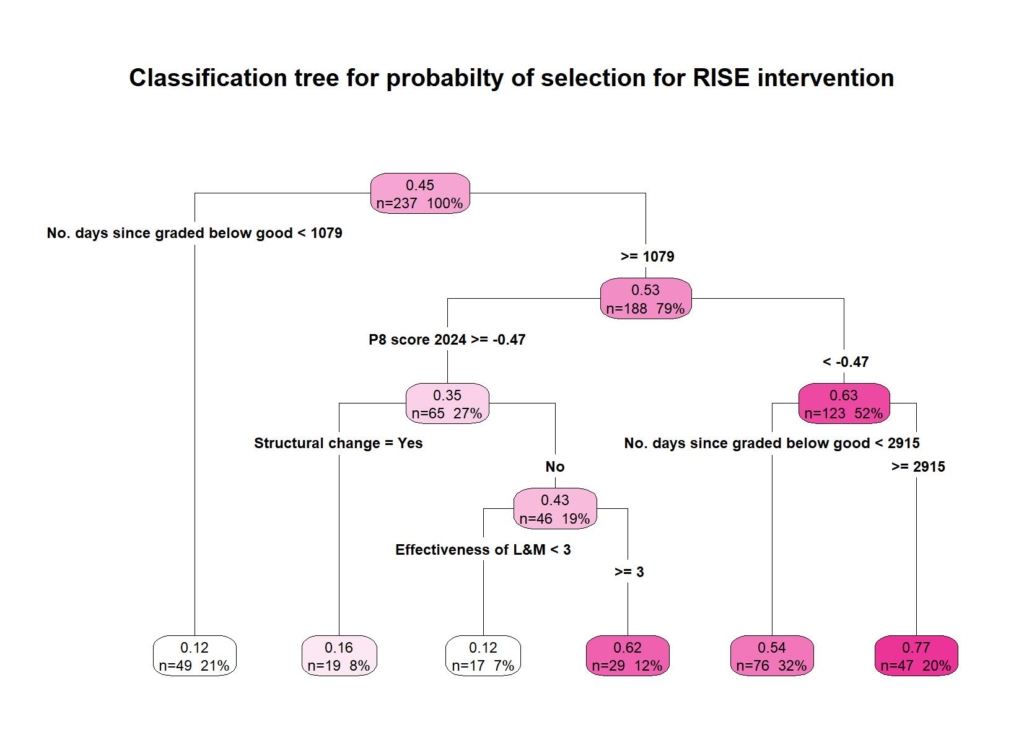
The tree divides the schools into 6 groups, 3 of which have a low (<17%) probability of selection and 3 which have a high (>53%) probability.
Starting at the top, we firstly divide schools into those last graded good within the last 1079 days (not quite 3 years) and those that weren’t.
The second partition (the block on the far left on the bottom row) shows that there were 49 stuck schools that had been graded good within the last 3 years. Just 6 (12%) were selected for RISE.
Looking at the 3 groups with a higher probability of selection and working from right to left we can pick out 3 groups:
- 47 schools graded below good for at least 2915 days (8 years) and with a 2024 P8 score below -0.47. 36 (77%) were selected for intervention
- 76 schools graded below good for between 1079 and 2915 days and with a 2024 P8 score below-0.47. 41 (54%) were selected for intervention
- 29 schools that
- Were graded below good for at least 1079 days
- Had a 2024 P8 score above -0.47
- Had not undergone structural change since their last intervention
- Were graded 3 or 4 for the effectiveness of leadership and management in their most recent inspection
18 of these schools (62%) were selected for intervention
Defining a counterfactual
To evaluate the targeted intervention of the RISE teams we need some sort of estimate of what would likely happen in the absence of their existence.
We call this a counterfactual. By comparing the results that actually occur with the counterfactual we would end up with some sort of estimate of the impact of the RISE teams.
In an ideal world, we’d randomly assign half of the 215 schools to receive a targeted intervention and the other half would receive “business as usual.” Whether this is practical or not is a moot point as it’s not happening anyway.
So as usual we’re left with making the best of what we can with existing data. This generally involves making some assumptions.
In this case, we can see from the previous section that there are some factors which are useful in identifying which stuck schools were selected for intervention.
This means we can go back in time, identify a set of schools with similar characteristics in the past, and then see what subsequently happened to them.
This would give us a “business as usual” counterfactual. This refers to the activity that would have gone on in the past to improve the sorts of schools RISE advisers will work with.
The point to underline here is that the counterfactual does not mean “do nothing”. Various school leaders, trust leaders and local authority officers would have been involved in trying to improve stuck schools in the past. Hence “business as usual”.
How the performance of stuck schools changed in the past
Let’s go back in time to August 2019.
Which schools would the RISE advisers have worked with then had they been in existence?
Using the prevailing published Ofsted management information data, we can identify the stock of stuck secondary schools that existed at the time.
We remove any that closed within the following 12 months. We assume that the closure (which includes Academy transfers) would have been known at the time.
We then match the 106 stuck secondary schools selected for RISE intervention to a matched school from the 2019 set of stuck secondary schools.
The matching process is based on:
- Exact matching on
- Whether the school had undergone structural change since its penultimate inspection
- Whether the school was an academy
- Whether the school was a middle school
- Grade for effectiveness of leadership and management in the most recent inspection
- Propensity score matching on
- 2024 Progress 8 score
- Days since last inspection graded good
We then repeat the process for the set of schools classed as “stuck” at the end of August 2022[6].
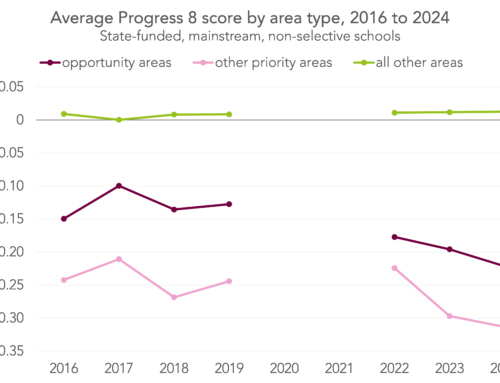
In the chart below, we show Progress 8 scores for both pools.
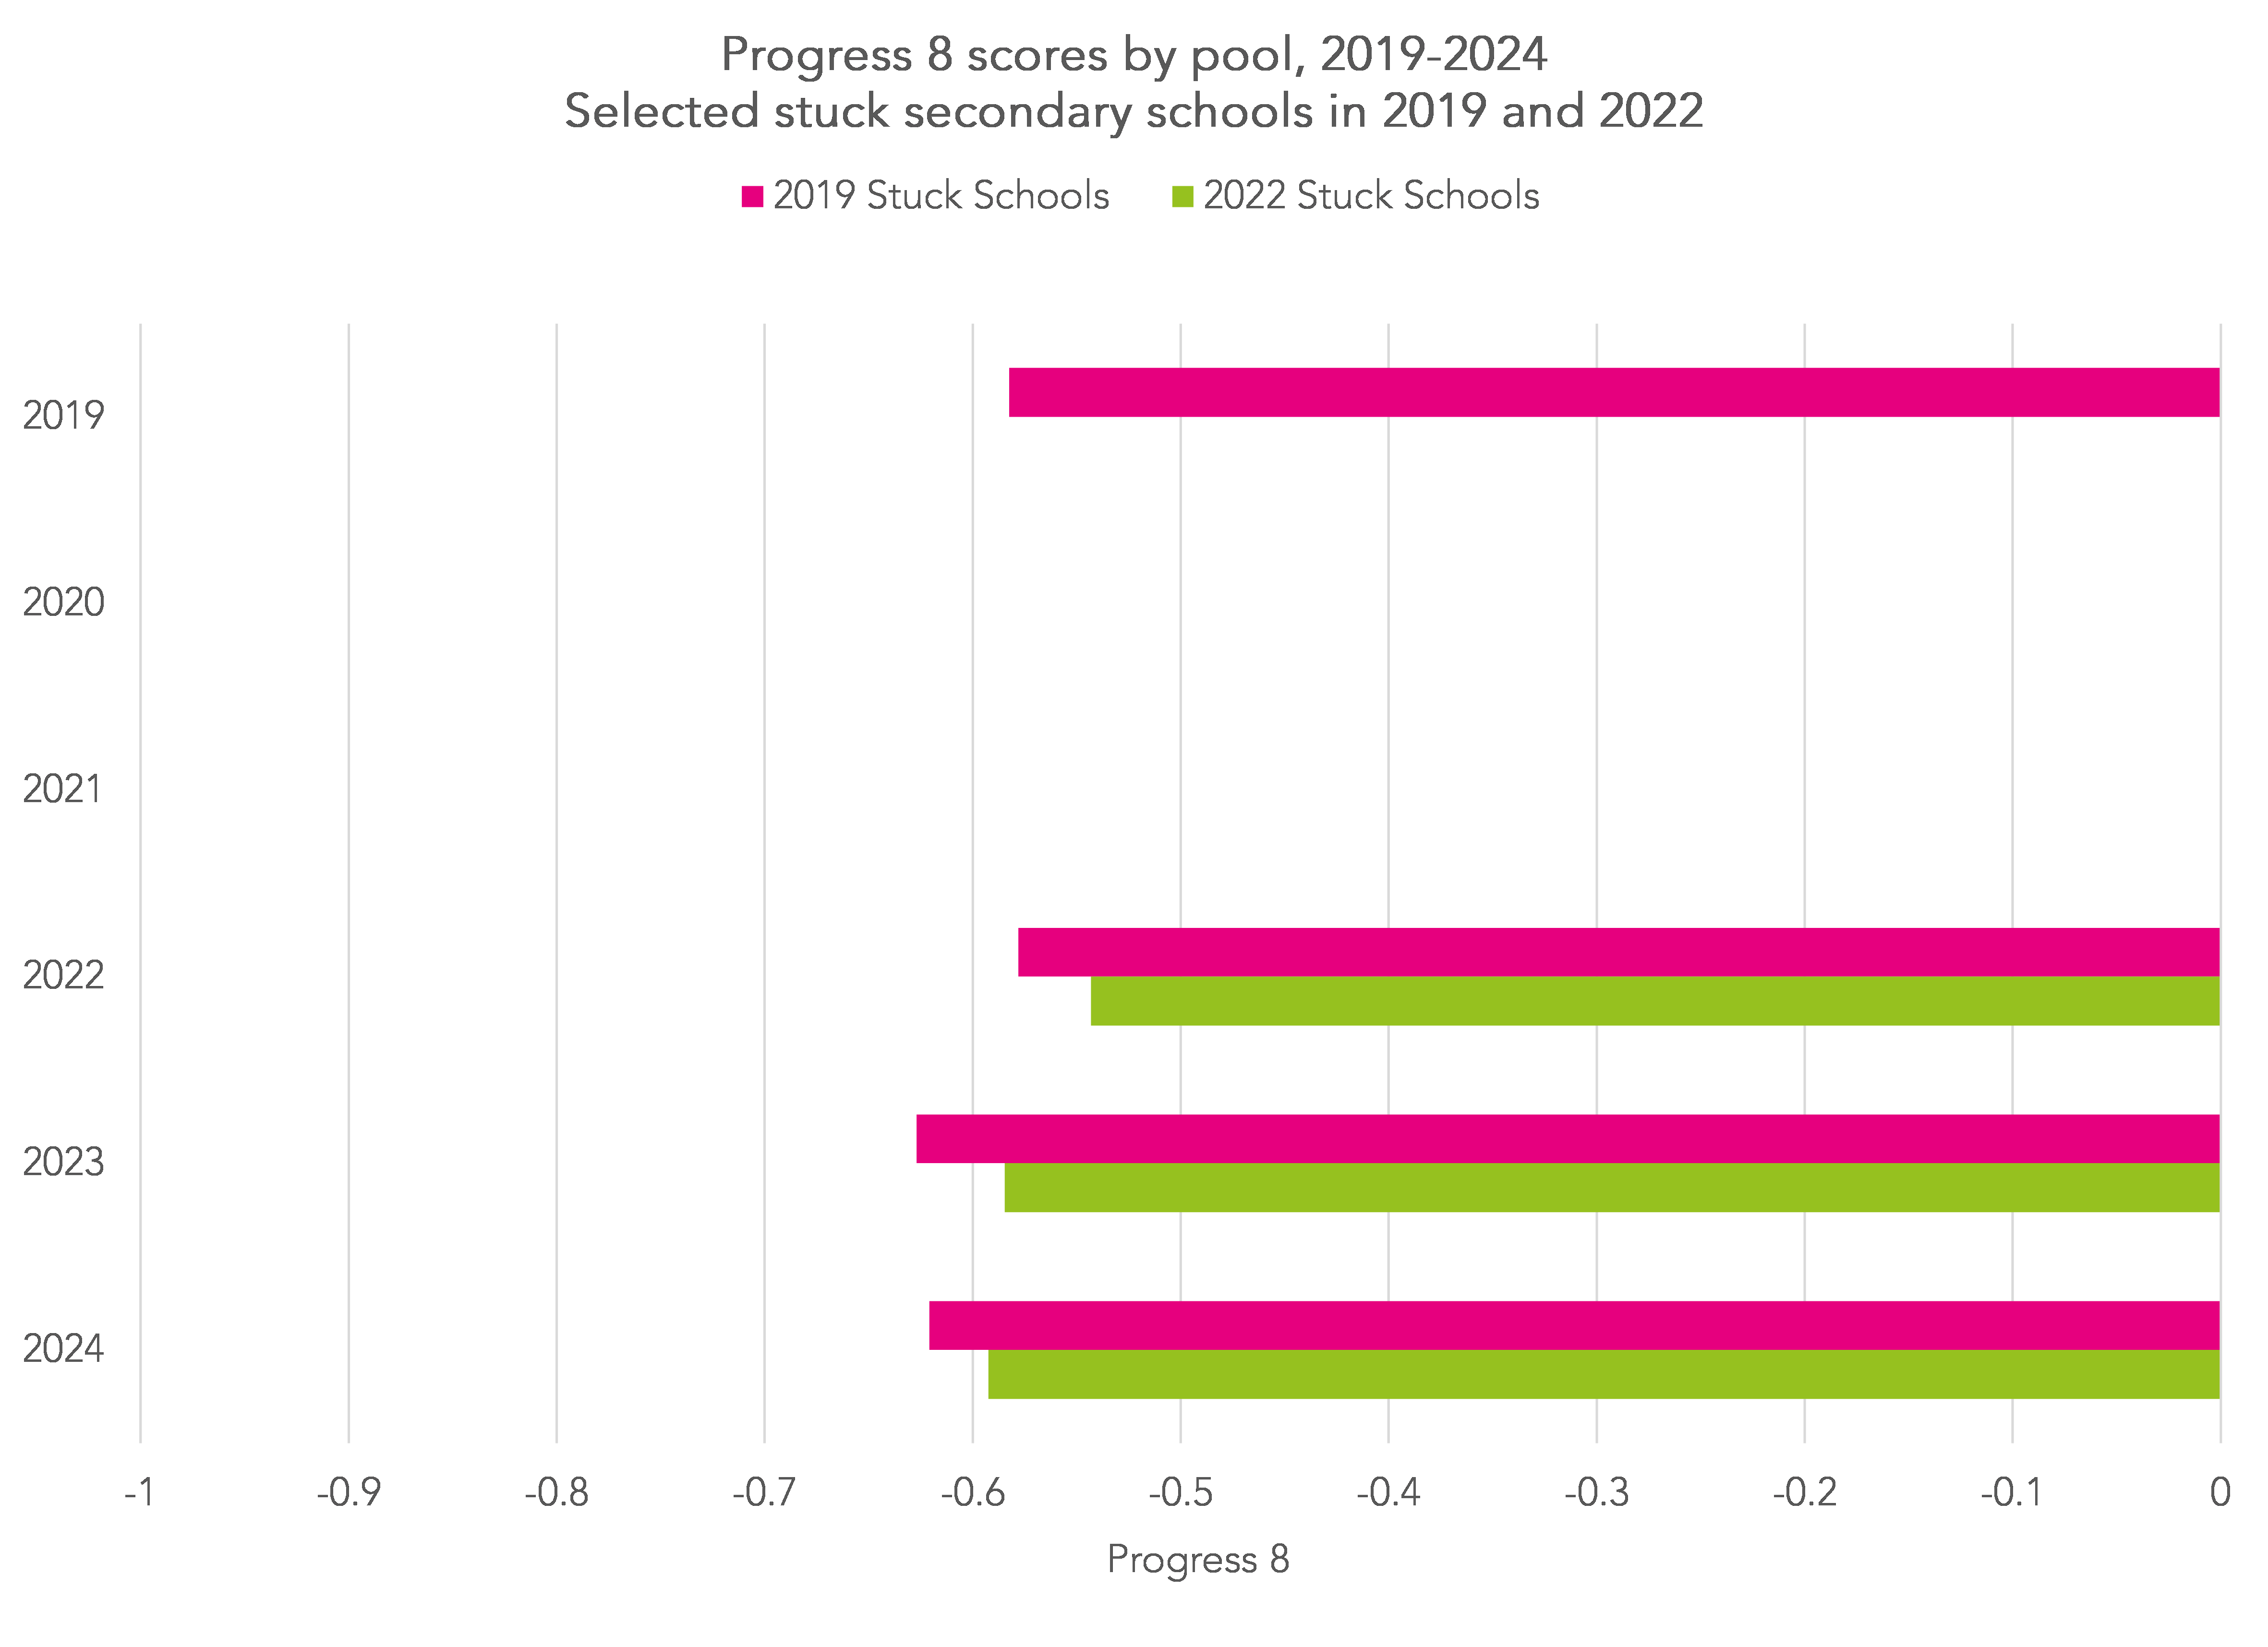
Progress 8 was not published in 2020 and 2021. The average score of the 2019 pool of counterfactual schools improved slightly when we first follow them up in 2022 before deteriorating slightly in 2023 and again in 2024.
The average score of the 2022 pool of counterfactual schools fell slightly when first followed up in 2023, then fell again slightly in 2024.
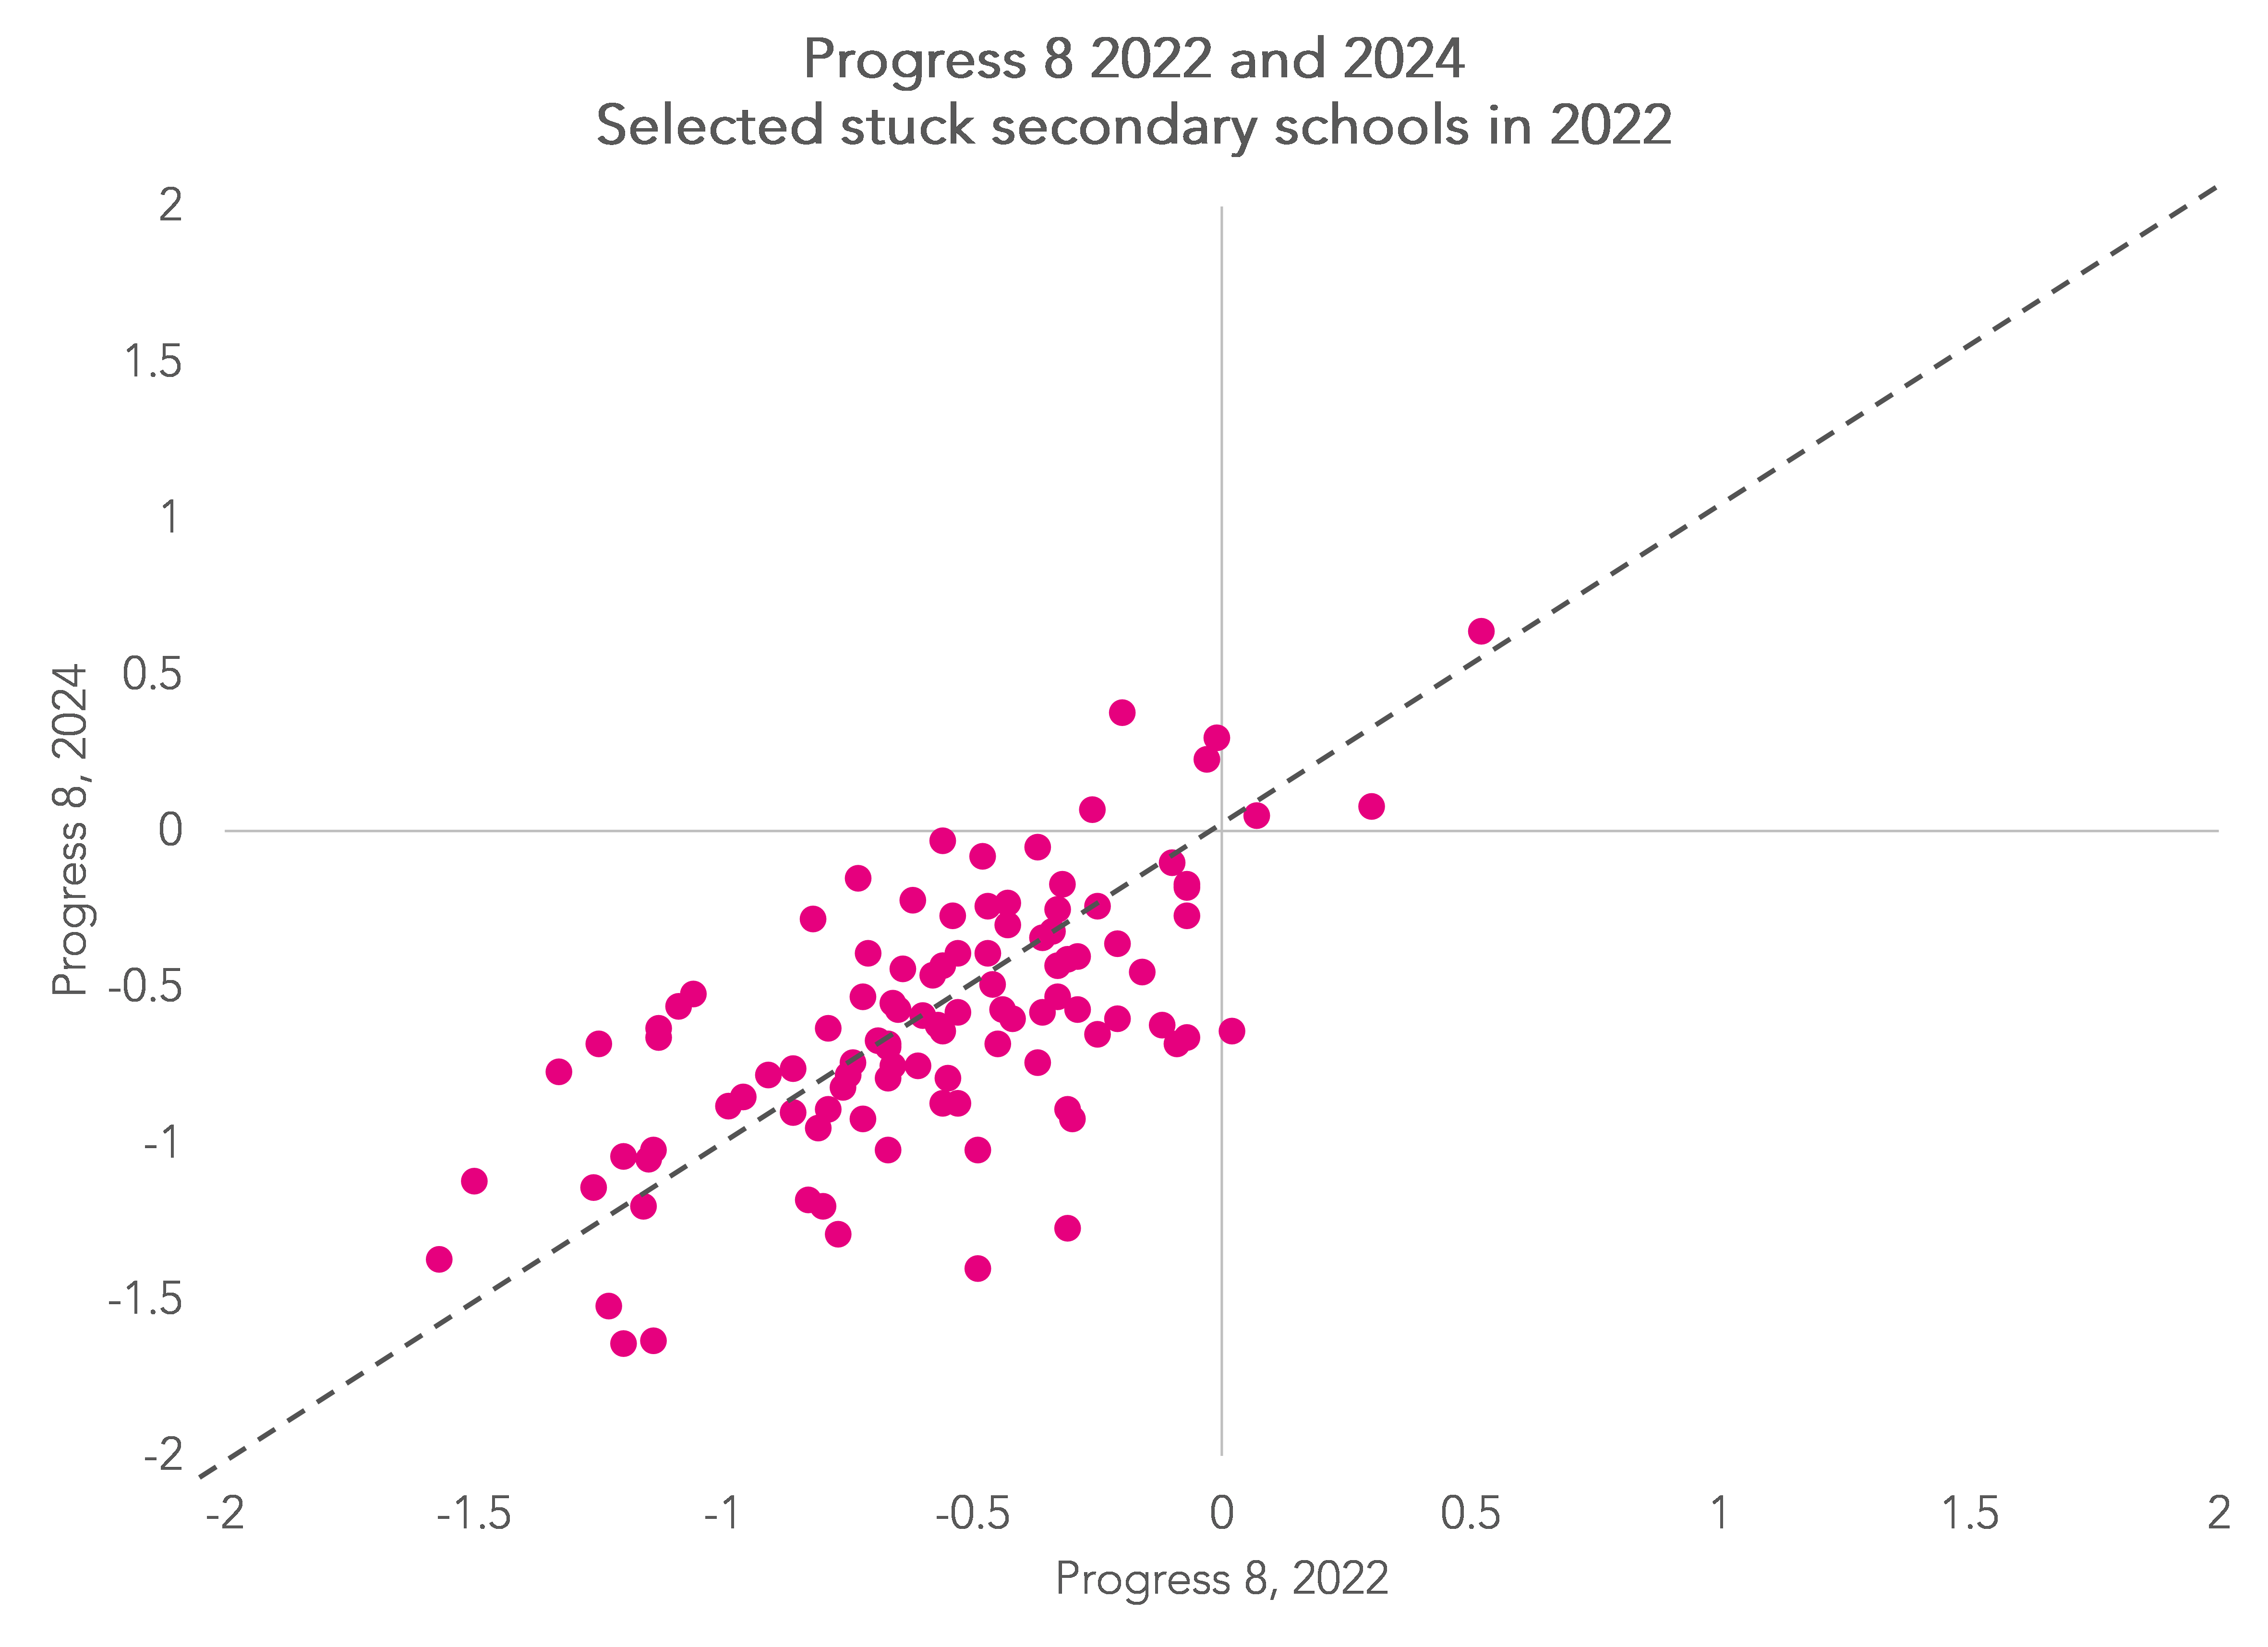
That’s an average, of course. There is variation amongst the schools with some schools seeing their score improve, others staying the same and some deteriorating.
Summing up
We will eventually get to see how the schools that RISE advisers have chosen for targeted intervention perform.
That said, the first time we will see Progress 8 scores for them following intervention, assuming Progress 8 returns after its enforced two-year hiatus, will be in 2027.
What we won’t know with any certainty is what would have happened to those schools in the absence of their intervention.
But it does appear that the sorts of schools that have been chosen for targeted intervention have historically tended not to improve their Progress 8 scores.
Put another way, calculating the average change in Progress 8 score might be a reasonable way of assessing the impact of the RISE teams in targeted intervention secondary schools.
A similar approach can be used with other outcomes: go back in time to identify a set of stuck schools with similar characteristics to those selected for RISE and examine change over time with respect to Key Stage 2 attainment, absence, exclusions/ suspensions and so on.
There are some limitations to this historical data-based approach. Firstly, the pandemic affects our results. Secondly, identification of the 2019 pool of counterfactual schools uses Ofsted judgments from the previous inspection framework.
We also can’t be certain which schools would have been eligible for RISE intervention if the teams had existed in the past. Although there are clues in the data, there is an element of subjective judgment in the selection process that is hard to replicate.
Finally, the RISE teams seem to have some sort of sector-wide school improvement role. This might work against the use of Progress 8 to evaluate their targeted intervention work since any improvements in this group of schools could be offset by improvements in other schools as a result of their universal service strand.
- In addition, 10 Academies graded inadequate have been included.
- Schools without grades for overall effectiveness can also be classified as “stuck” if they are graded 3 or 4 for the effectiveness of leadership and management sub-judgment, although there are no RISE schools that fall into this category and which are graded 1 or 2 for quality of education.
- Maintained schools, voluntary aided and controlled schools, foundation schools
- Of the remainder, 90 are primary schools, 10 are special schools, 2 are Alternative Provision schools and 1 is all-through.
- 5 of the schools are middle schools so do not have Progress 8 scores
- Of the 106 stuck secondary schools selected for RISE intervention, 32 were in the pool of stuck secondary schools in both August 2019 and August 2022.
Want to stay up-to-date with the latest research from FFT Education Datalab? Sign up to Datalab’s mailing list to get notifications about new blogposts, or to receive the team’s half-termly newsletter.

Leave A Comment