Key Stage 4 performance measures for secondary schools have been published today.
Due to the pandemic forcing the cancellation of Key Stage 2 national curriculum tests in 2020, there is no Progress 8 data this year.
Progress 8 is not without its flaws, as we have written about at length (see this for example).
But despite its flaws, it offers a fairer way of comparing schools than just using raw attainment measures alone as it adjusts for differences in attainment on intake.
This year’s performance measures show just why this is the case.
Attainment 8 and prior attainment
The Attainment 8 measure is a score for each pupil composed of 8 “slots” as follows:
- English: Best grade from GCSE (or AS-level) language or GCSE (or AS-level) literature
- Maths: GCSE (or AS-level) maths grade
- EBacc: Best 3 grades from GCSEs (or AS-levels) in science, humanities (geography or history) and languages (ancient and modern)
- Open: 3 best grades from other qualifications not already counted
The English and maths slots are double weighted.
A pupil with grade 5 passes in each of English language, English literature, maths, double science, geography, business studies and art and design would have an Attainment 8 score of 50.
Progress 8, when it was published, was based on Attainment 8.
To begin with, let’s go back to data from 2024 to see just why Progress 8 is needed.
For all 3,000 secondary schools in England, we plot the mean Attainment 8 score of their pupils by the mean Key Stage 2 (reading and maths) score of the cohort.
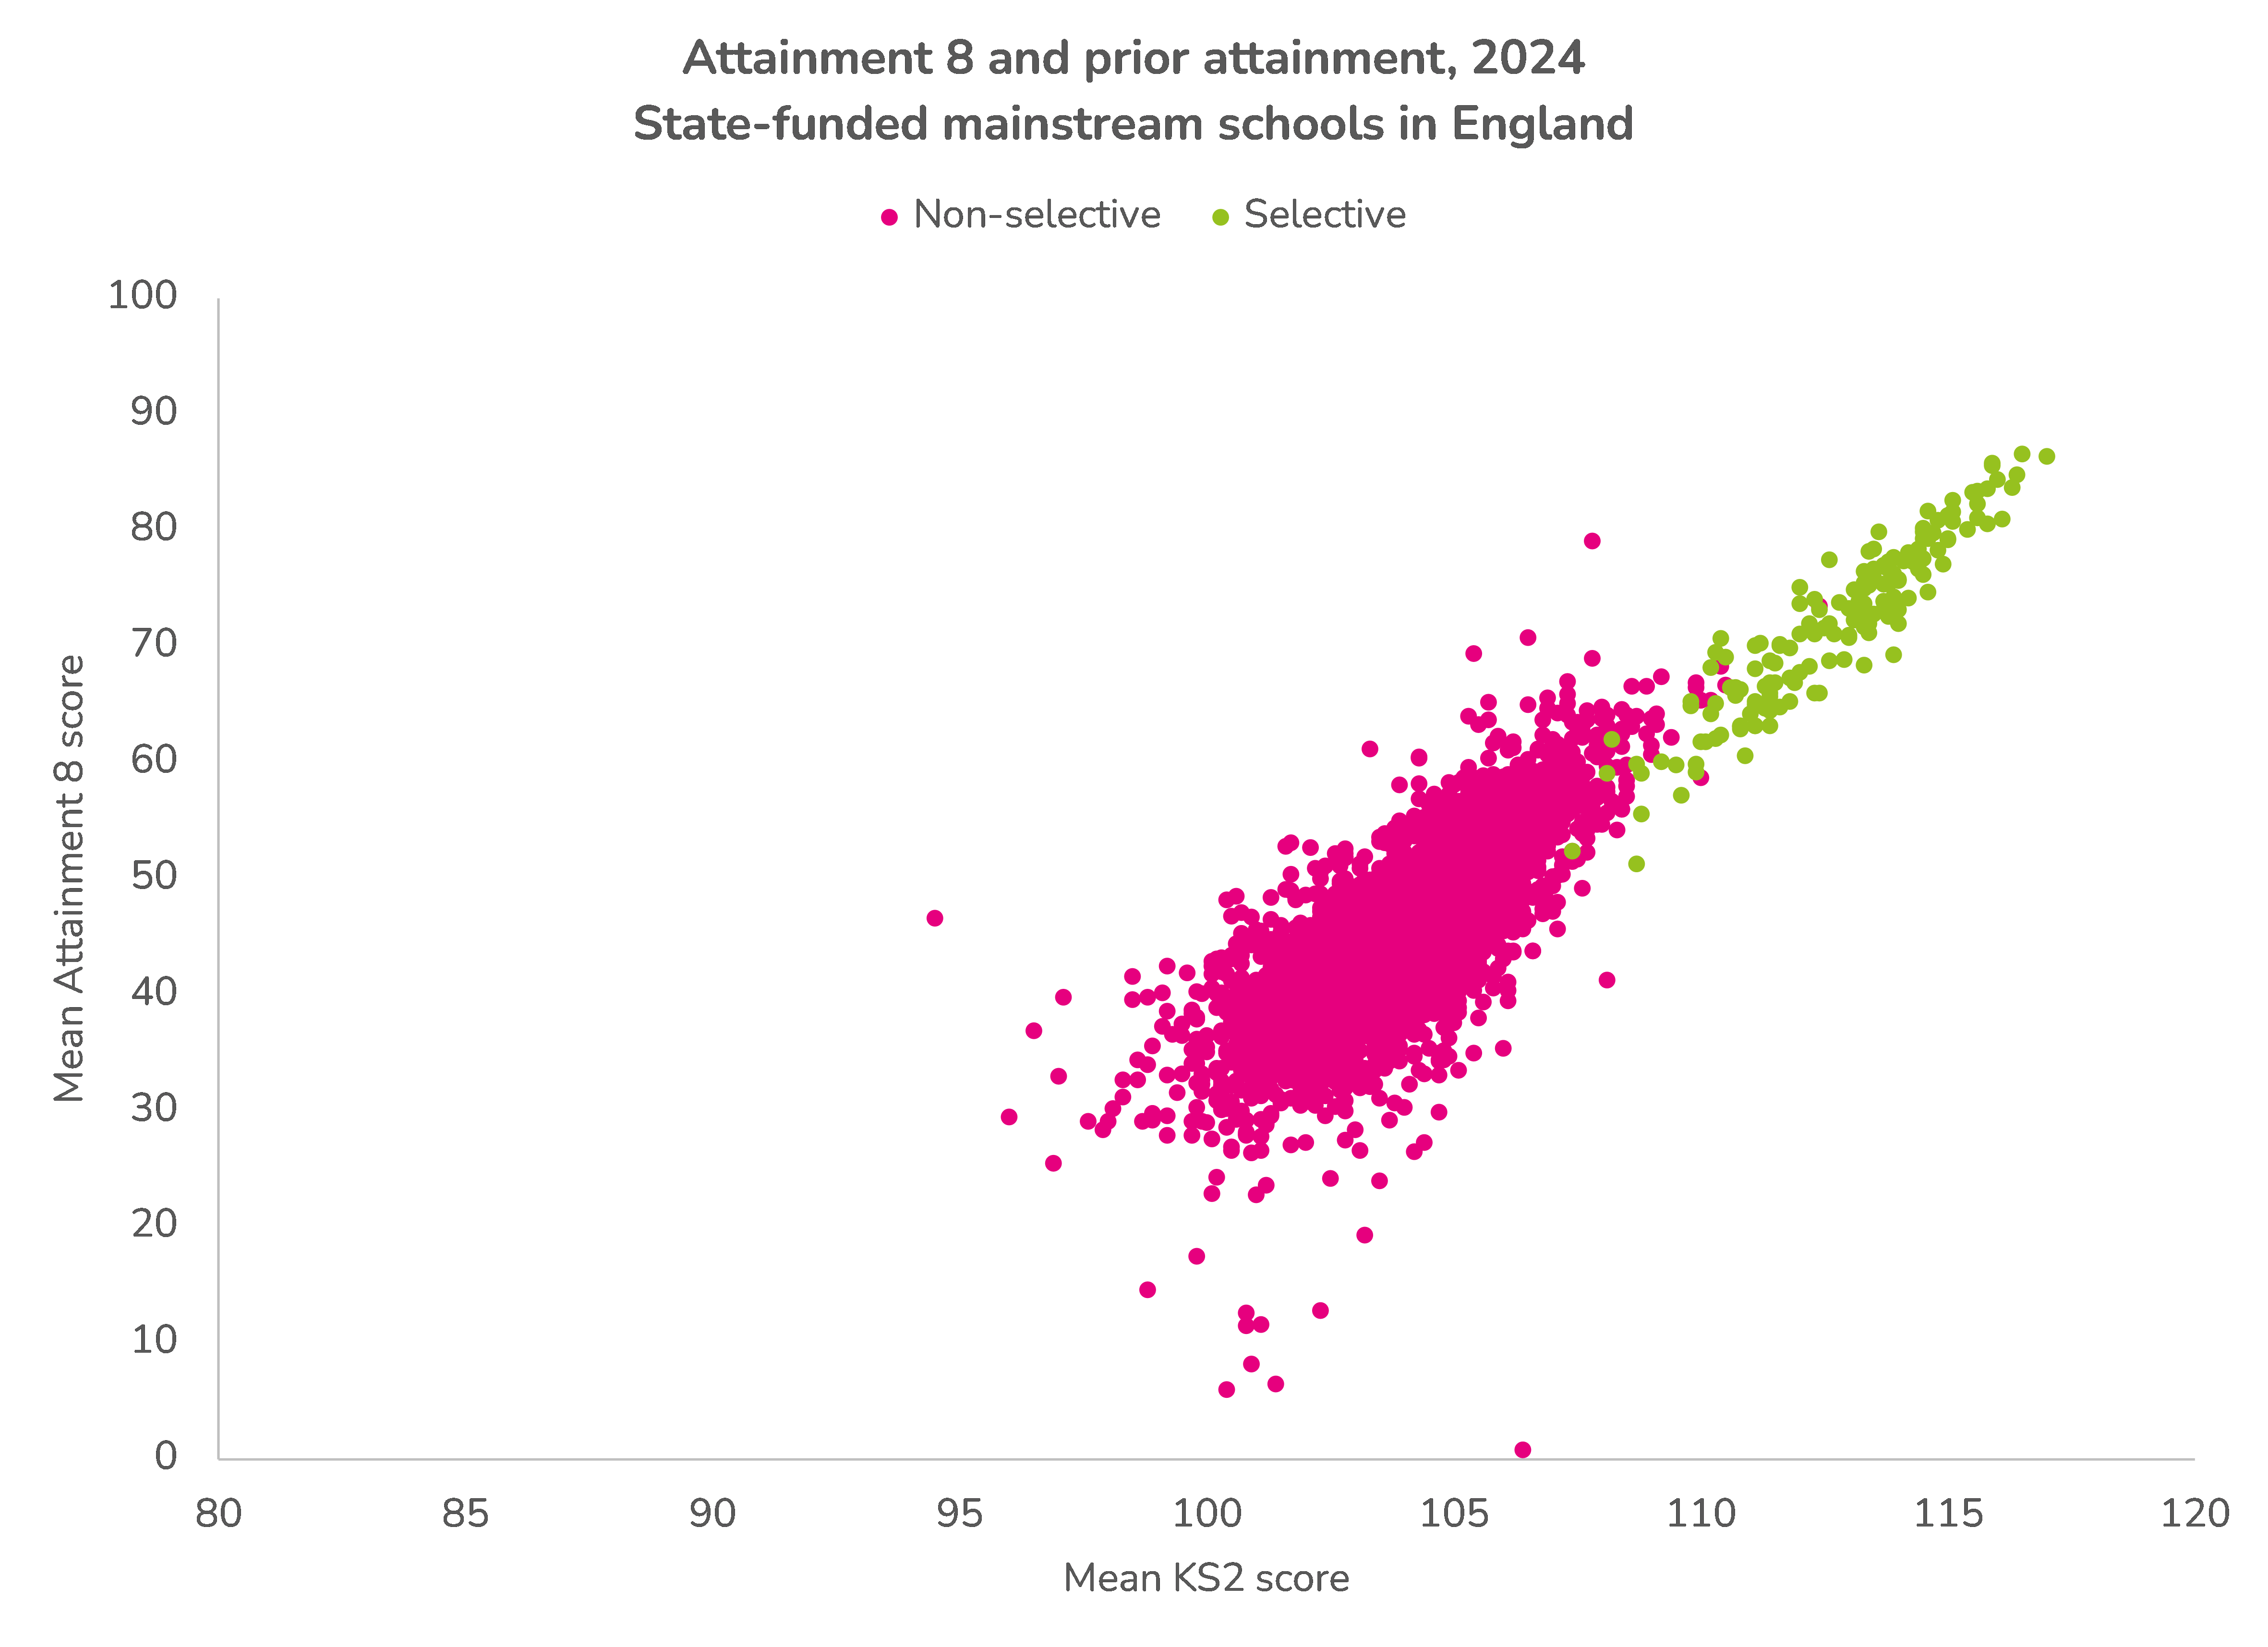
The two measures are strongly correlated (r=0.85). Put simply, Key Stage 4 attainment merely reflects attainment on entry. Selective schools achieve the highest Attainment 8 scores because their pupils were already higher attaining than pupils at other schools when they joined the school.
Making sense of Attainment 8 in 2025
Comparisons of school performance measures using attainment measures such as Attainment 8 are unfair for schools with lower attaining intakes.
In the following chart, we plot Attainment 8 from 2025 against Progress 8 from 2024.
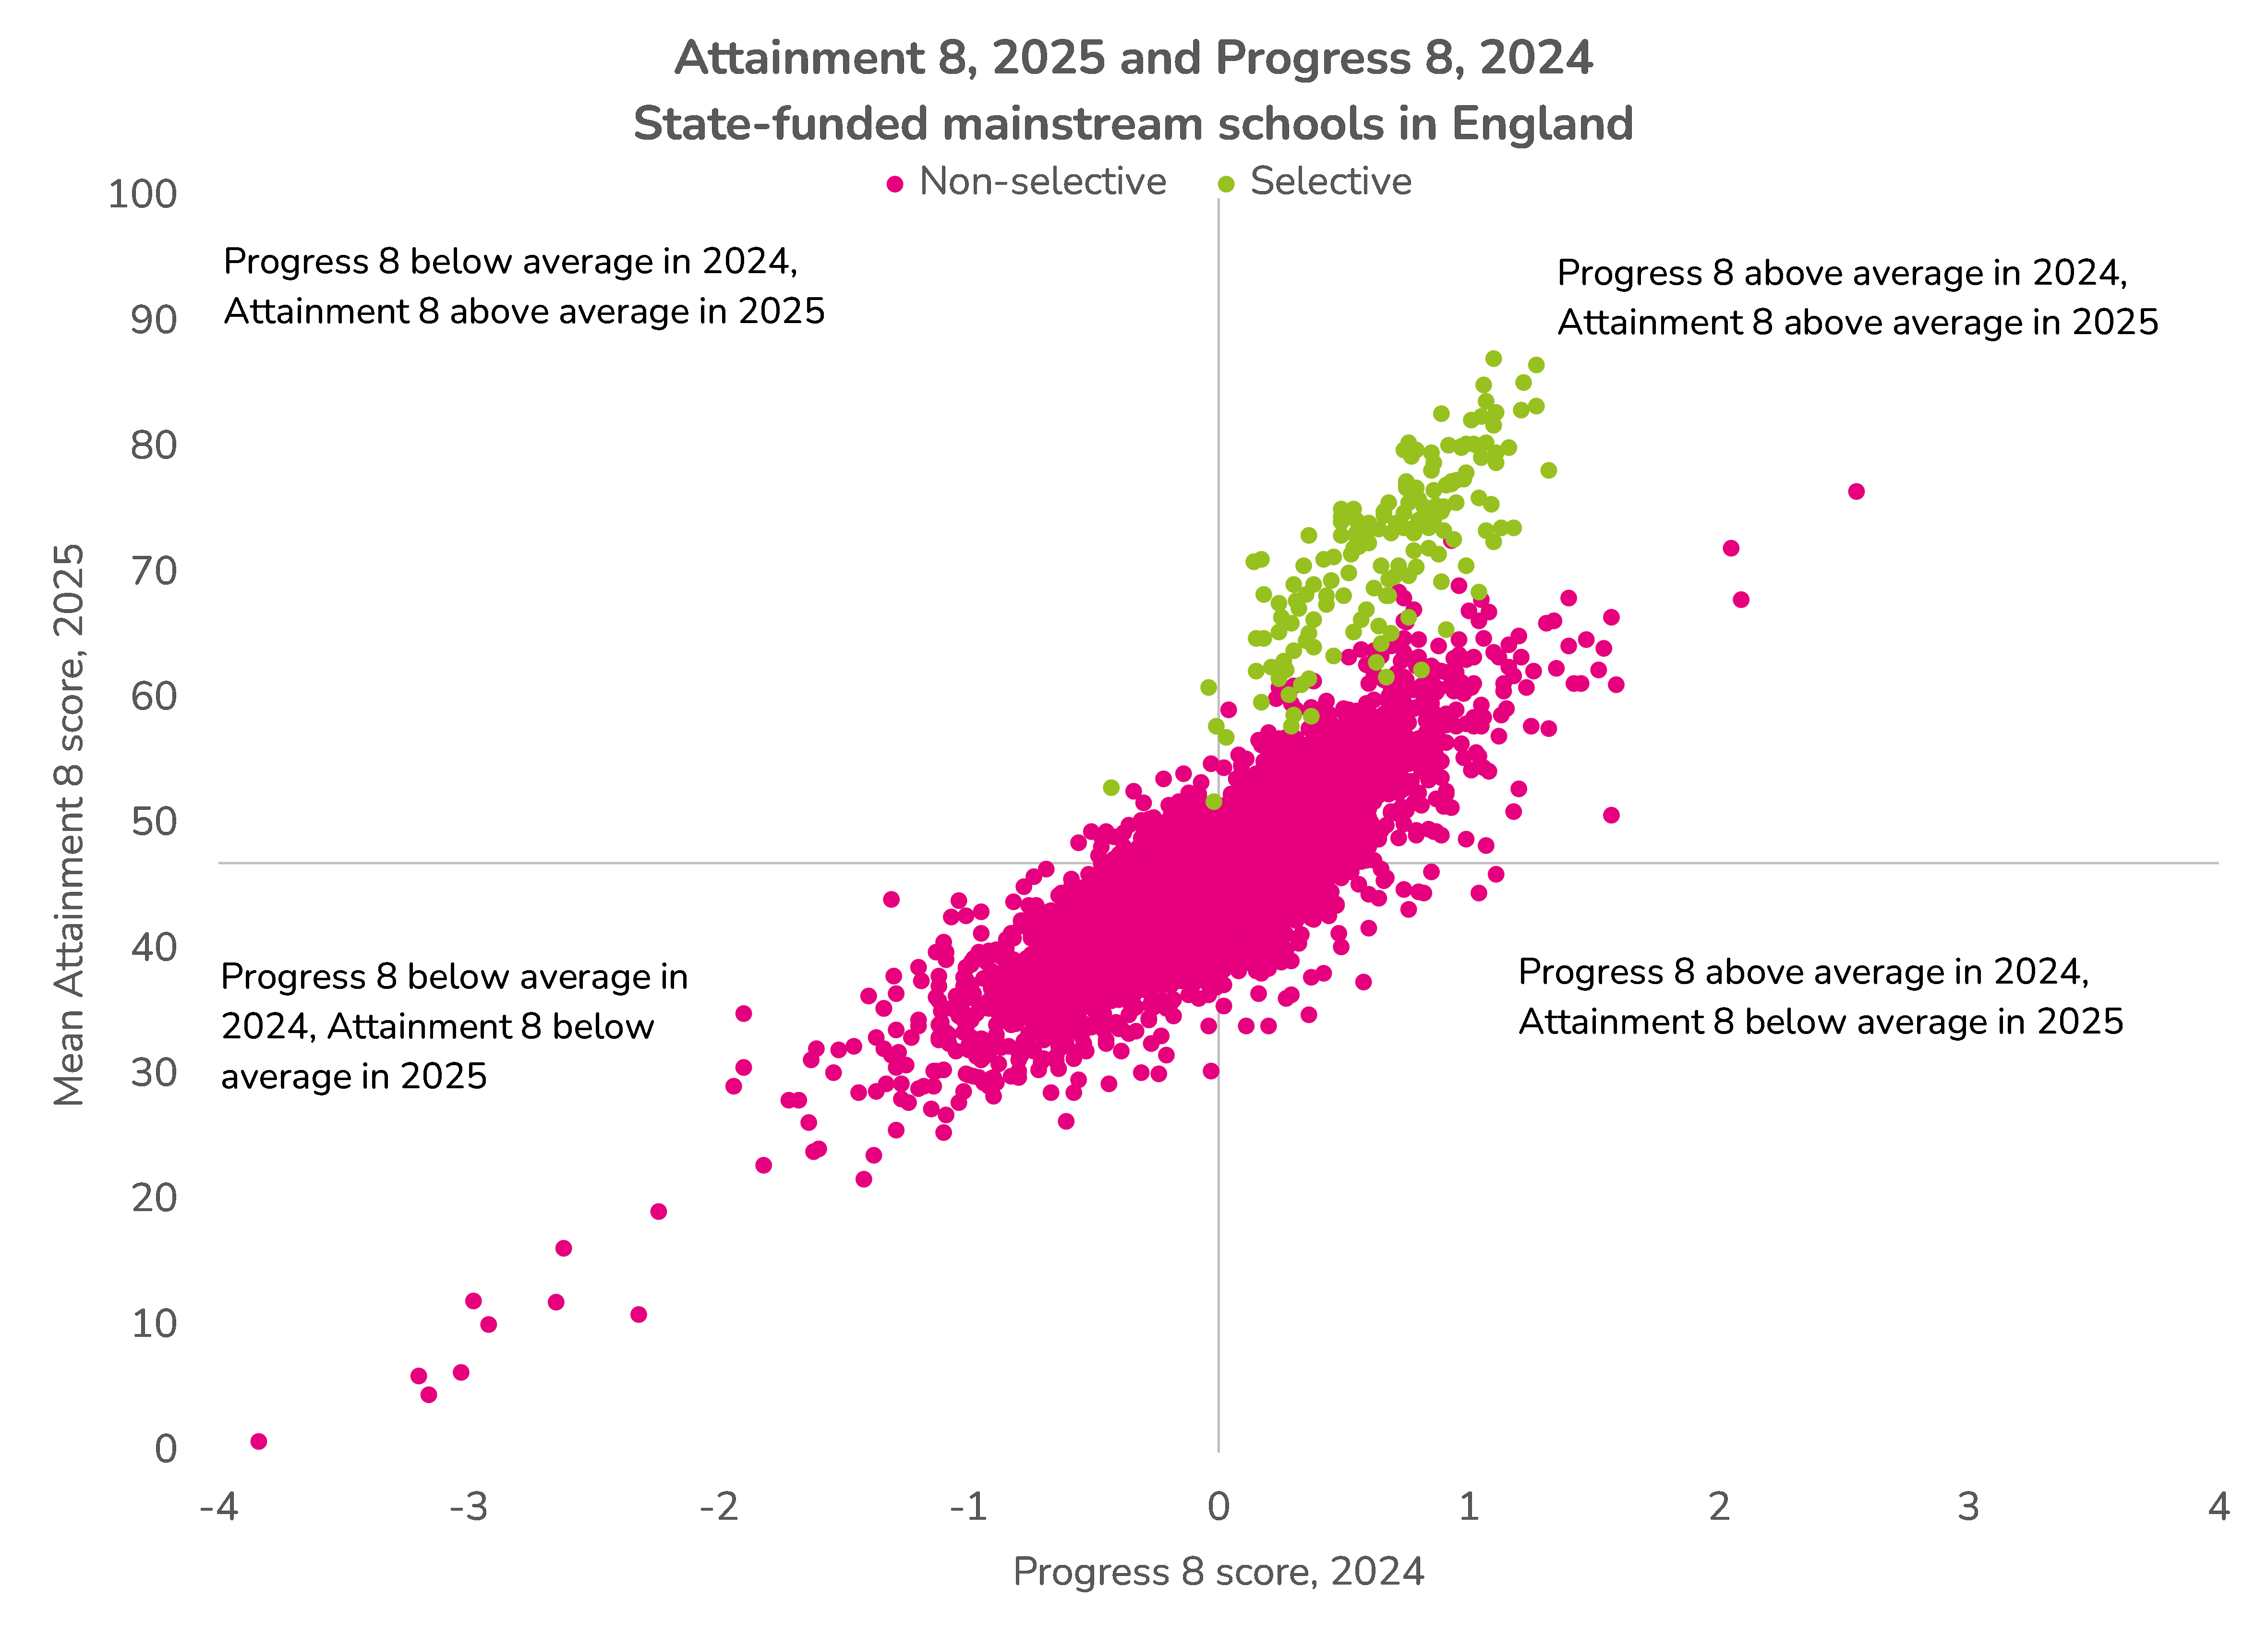
These two measures are also strongly correlated (r=0.81). In fact, the correlation is only slightly lower than when we correlate Progress 8 from 2024 with Attainment 8 from the same year (r=0.86).
This means that many schools occupy fairly similar rank positions on both measures.
However, there are some for whom differences between the measures lead to different (simplistic) inferences.
In the bottom right quadrant are a group of schools which had above average Progress 8 scores in 2024 but below average Attainment 8 scores in 2025.
Of course, the past is not necessarily a good guide to the future. Some of those schools might have achieved below average Progress 8 scores if the measure had been produced this year.
But that notwithstanding, there are around 400 schools for which 2025 data appears, on the surface at least, to give a different perspective on school performance than 2024.
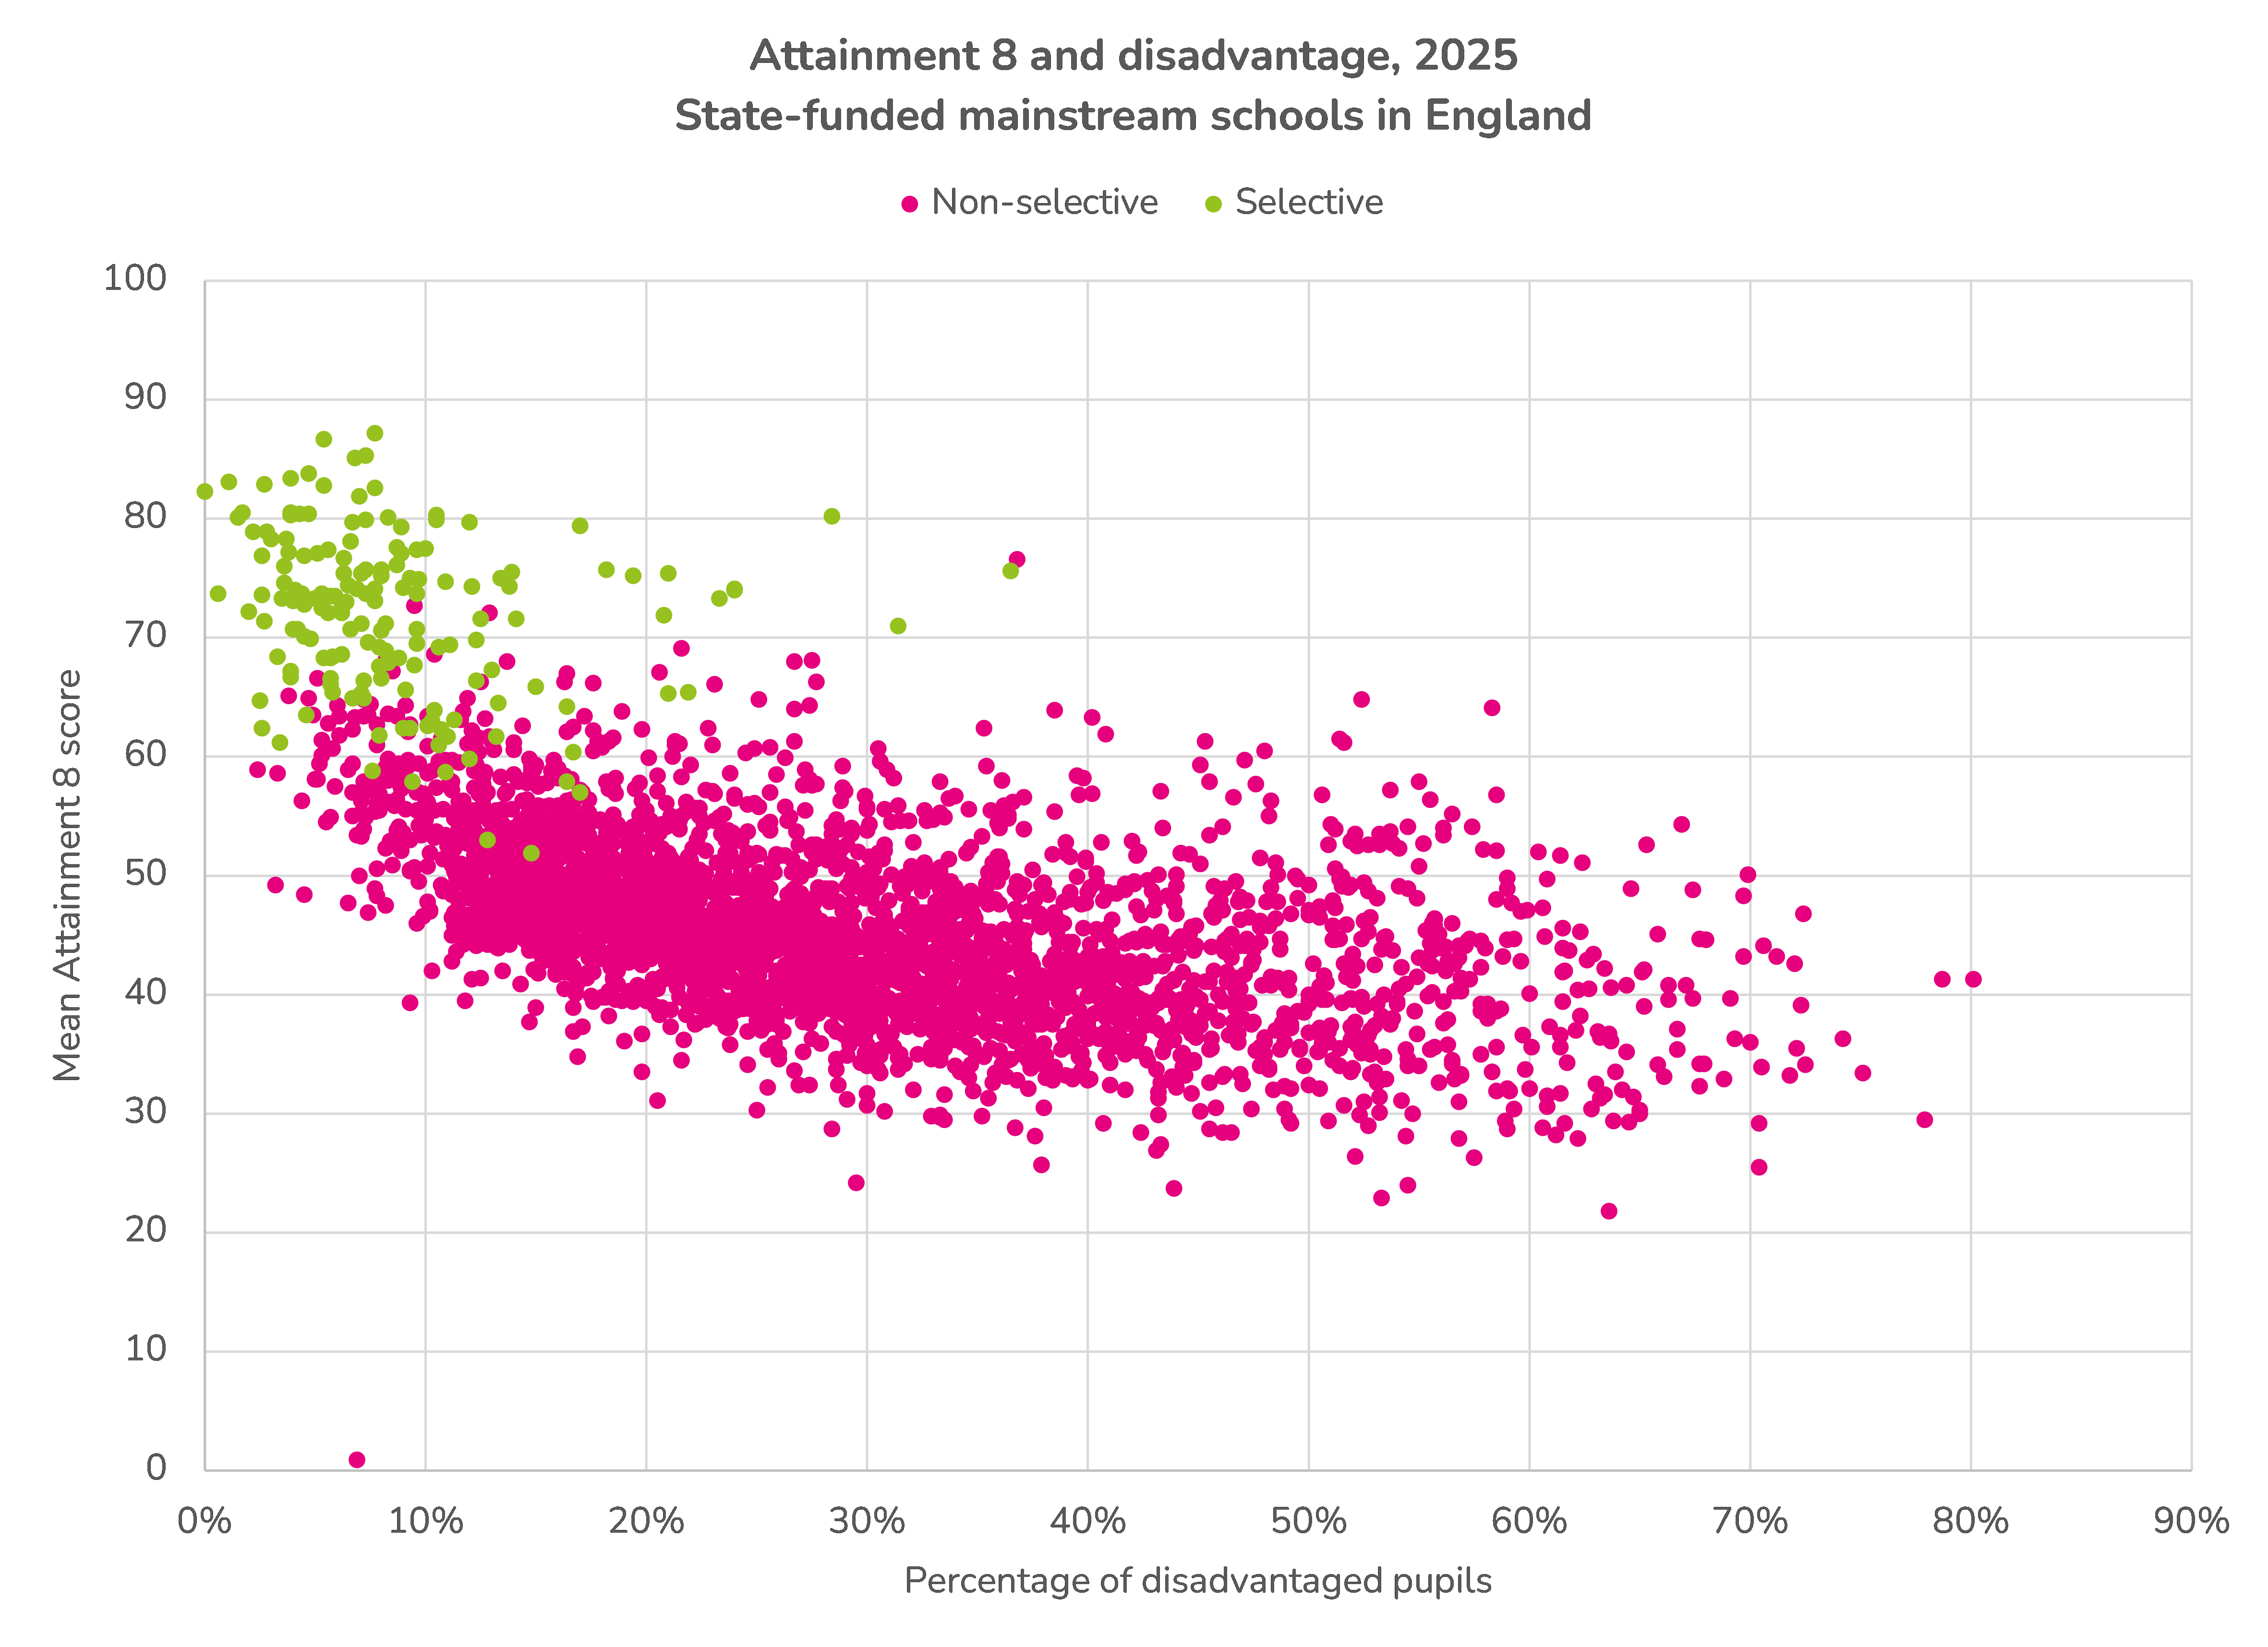
And, as is the case with Progress 8, it is schools in more disadvantaged areas that will tend to have lower Attainment 8 scores.
Fairer comparisons of school performance
In the absence of Progress 8 data (and in any event we would recommend doing this with Progress 8 data as well), the fairest comparison of performance of any school is with other schools with similar intakes.
That’s why we have created Schools Like Yours, a tool for comparing the performance of a school with similar schools, where you get to decide what similar means. This has now been updated with the 2025 Key Stage 4 data.
Want to stay up-to-date with the latest research from FFT Education Datalab? Sign up to Datalab’s mailing list to get notifications about new blogposts, or to receive the team’s half-termly newsletter.


Does this mean that Schools Like Yours has already been updated with the 2025 KS4 results data? If not, do you have a a rough idea when that will happen? Many thanks
Hi Mike. Yes it is. Should have made that clear in the text.