The first table in this post was updated at 17.42 on 25 January 2018 after we noticed – of all things – that percentages in the table did not add up to 100. We very much regret the error.
Key Stage 4 league tables – performance tables, to use their proper name – have been published this morning. With the publication of this data, schools are confirmed as being in one of the Department for Education’s two groups of concern – being below the floor standard, and being judged to be coasting.
So what can we say about the schools in these two groups?
Schools below the floor standard
Schools with a Progress 8 score of below -0.5[1] are considered to be below the government’s floor standard.
There were 365 such schools (12% of all those eligible – but with considerable regional variation [PDF]) this year, compared to 282 (9.3% of eligible schools) last year.
As we noted when provisional KS4 data was released in October, this is largely driven by changes to GCSE point scores last summer – not that that will provide much consolation to those now finding themselves carrying the floor standard label (on the contrary, in fact).
It’s also worth noting that 56 of those below the floor standard are university technical colleges or studio schools – special types of academy, providing a more vocational offering – or FE colleges that admit at 14. We’ll leave the wisdom of judging them in the same manner as mainstream secondary schools for another day (or read what we’ve written previously).
Looking at those judged to be below the floor, there are schools in this group with each of the four Ofsted ratings – including six with outstanding ratings (though this a smaller share than we found to be the case with primary schools)[2].
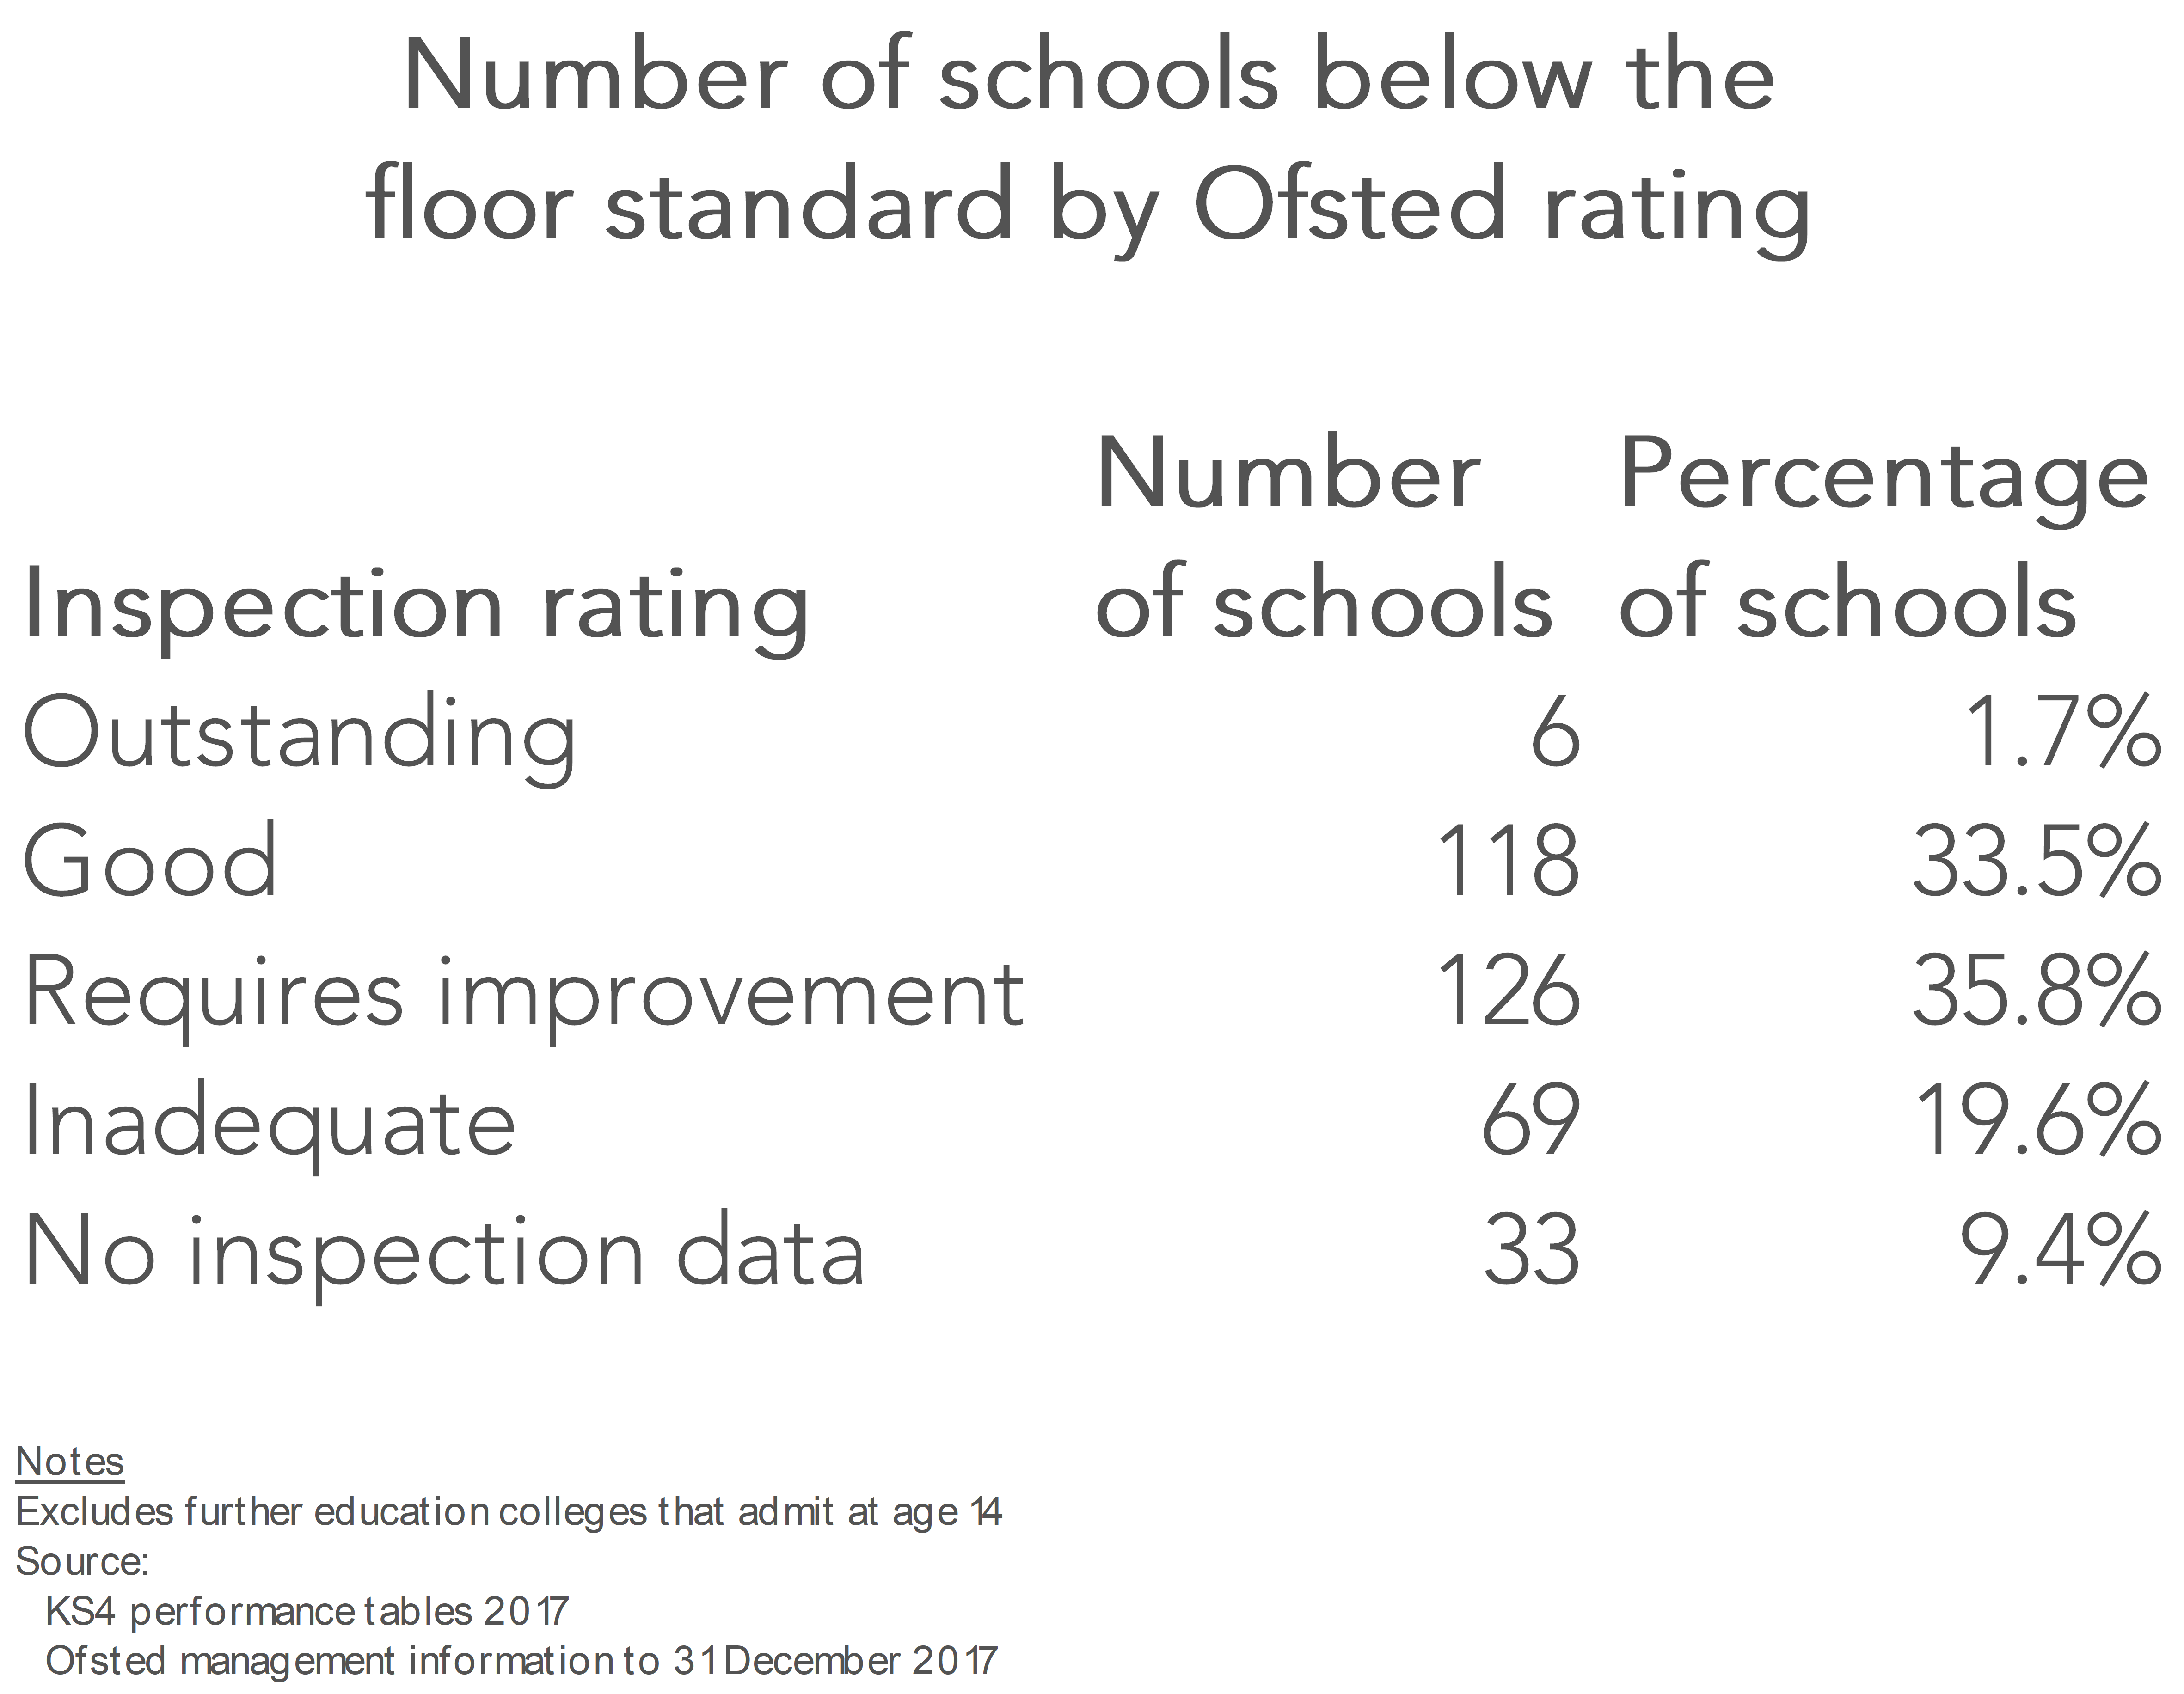
(We have excluded the 13 FE colleges judged to be below the floor standard from this analysis, due to the fact that at least one has not been inspected since Ofsted’s common inspection framework – unifying school and post-16 inspections – was introduced in September 2015. Of those that have not been inspected, studio schools and university technical colleges are over-represented.)
Three of the six below the floor standard are grammar schools. Looking further into their data, it looks like this is due to their English results – most likely a result of them entering pupils for IGCSEs, neglecting to take into account the fact that from 2017 these did not count in league tables.
Coasting schools
The government defines another group of schools as coasting – those it considers not to be doing enough to achieve good results. The definition looks across the last three years of a school’s results, with the 2017 part of the definition requiring a school to record a P8 score of less than -0.25[3].
There were 271 schools (9.6% of all eligible schools) classed as coasting this year, compared to 319 coasting (11.3% of eligible schools) last year.
A total of 169 schools fell into both the coasting and floor standards group, compared to 152 last year.
Movement between the two groups
Of the 282 schools below the floor standard last year, and the 167 that were above the floor but judged to be coasting, how many were in one of these groups again this year?
As the table below shows, of the 282 schools below the floor in 2016, 148 remained so in 2017. A group of 42 schools closed – some a technical closure, with a change to sponsored academy status – and 34 met the coasting definition this year.
A group of 207 schools newly fell below the floor in 2017, including 38 that met the 2016 coasting threshold.
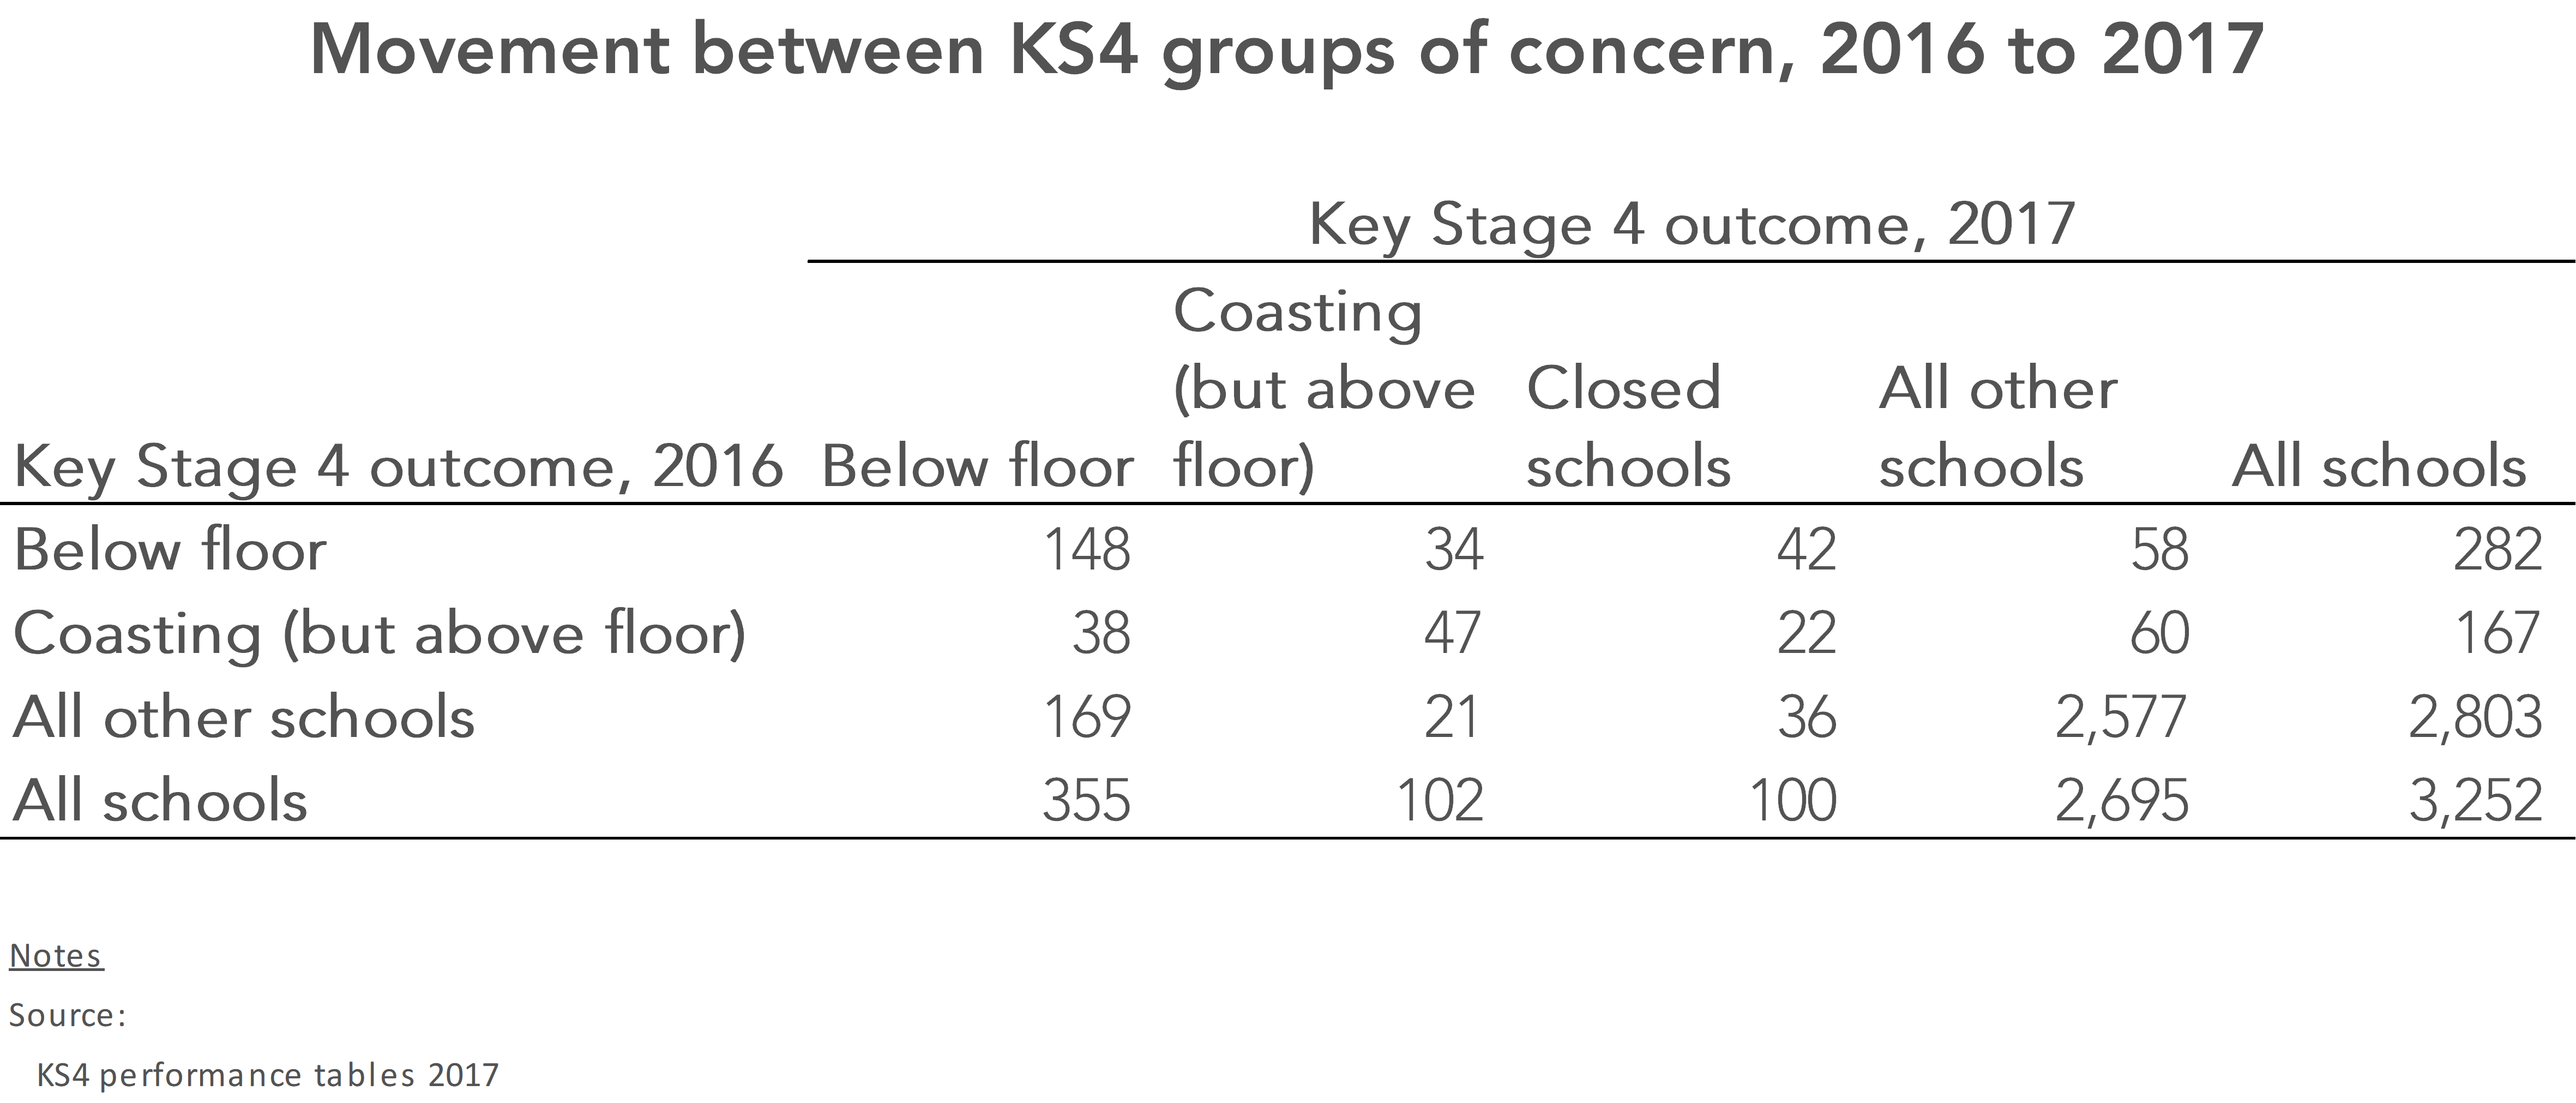
In total, 639 schools of the 3,252 schools open in 2016 have been deemed to be below the floor or coasting in either 2016 or 2017 – almost one-in-five[4].
Want to stay up-to-date with the latest research from Education Datalab? Sign up to our mailing list to get notifications about new blogposts, or to receive our half-termly newsletter.
1. A school is below the floor [PDF] if:
- its Progress 8 score is below -0.5
- the upper band of its 95% confidence interval is below zero
Certain groups – such as special schools and alternative providers, and those with very small numbers at the end of Key Stage 4 – are excluded from the definition.
2. Data used is Ofsted management information as of 31 December 2017.
3. In 2017, a school is judged to be coasting [PDF] if all of the following criteria were met:
- 2015
- 2016
- Progress 8 score of less than -0.25
- 2017
- Progress 8 score of less than -0.25
Certain groups – such as special schools and alternative providers, and those with very small numbers at the end of Key Stage 4 – are excluded from the definition.
4. Added to that can be 10 schools that newly featured in KS4 performance tables in 2017 that are below the floor standard.


Leave A Comment