The inverse intervention law (IIL) is a concept from social care research that states that, when comparing children living in neighbourhoods with similar levels of economic disadvantage, those living in less deprived local authorities will be more likely to receive an intervention (such as child protection) than those living in more deprived local authorities.
Sign up to our newsletter
If you enjoy our content, why not sign up now to get notified when we publish a new post, or to receive our half termly newsletter?
In this article I show how the IIL occurs in education with respect to education, health and care plans (EHCPs).
Data
I’ll be using School Census data from January 2025 relating to pupils aged 5 to 10 (Years 1 to 6) in state schools in England.
This indicates
- Whether a pupil has an EHCP
- Whether they are eligible for free school meals (FSM)
- The neighbourhood (lower super output area (LSOA) in which they live
- The Income Deprivation Affecting Children Index (IDACI) score of the neighbourhood in which they live
To this we append the local authority in which the LSOA of residence is located.
We also assign LSOAs to 10 evenly-sized groups (deciles) based on their IDACI score. There are 32,844 LSOAs[1] in England, hence there are 3,284 (or sometimes 3,285) in each decile.
Variation in EHC plans by Local Authority
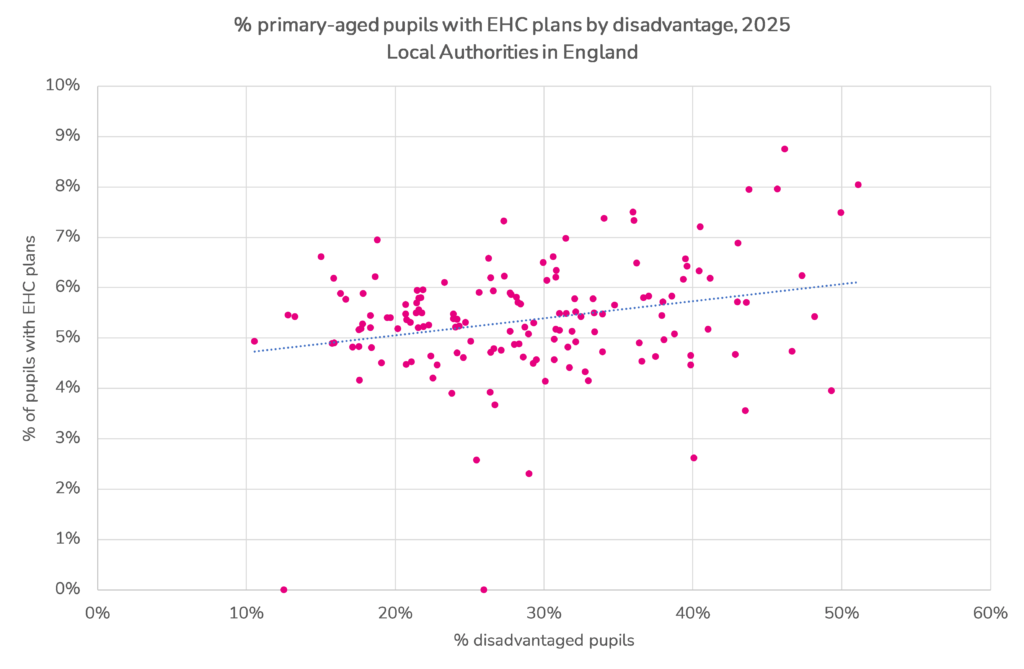
In the chart below, local authorities are plotted by level of disadvantage (% free school meals) and the percentage of pupils with an EHCP.
There is a weak correlation between the two measures. More disadvantaged local authorities will tend to have higher rates of EHC plans although there is considerable variation as is widely researched.
Variation in EHC plans by neighbourhood disadvantage
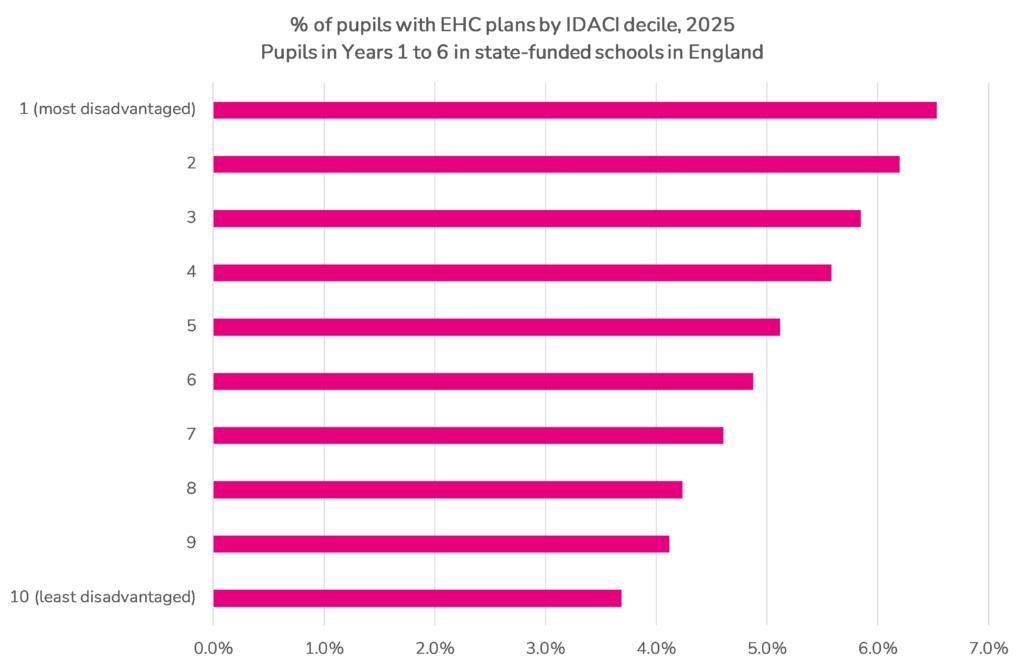
Now let’s show the rate of EHC plans by IDACI decile.
6.5% of pupils living in the most disadvantaged neighbourhoods had an EHC plan. This compares with 3.7% of those living in the least disadvantaged.
The inverse intervention law
We also assign local authorities to deciles based on the percentage of pupils eligible for free school meals.
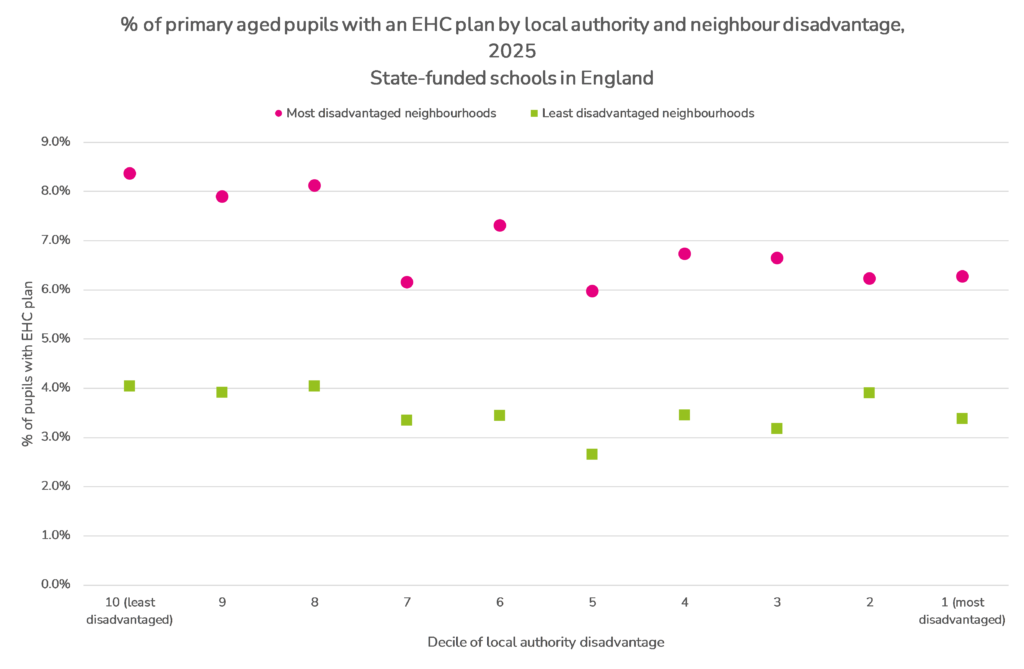
In the following chart, we compare the percentage of pupils with EHC plans in the most (and least) disadvantaged neighbourhoods across the deciles of local authority disadvantage.
For the most disadvantaged neighbourhoods, although we don’t see a smooth gradient declining consistently from left to right, we can nonetheless see that there are proportionally more pupils with EHC plans in the three least disadvantaged local authority deciles than the three most disadvantaged.
Of course, there are relatively few pupils living in the most disadvantaged neighbourhoods in less disadvantaged local authorities. Just 3% of pupils in local authorities in the three least disadvantaged deciles live in the most disadvantaged neighbourhoods. This compares to 14% of pupils in local authorities in the three most disadvantaged deciles.
We see a similar picture if we compare disadvantaged pupils (those eligible for FSM) and other pupils.
Disadvantaged pupils resident in the least deprived local authorities are 50% more likely to have an EHCP than disadvantaged pupils resident in the most deprived local authorities.
Summing up
Disadvantaged pupils are more likely to have an EHC plan if they live in a less disadvantaged local authority than in a more disadvantaged one.
This provides suggestive evidence of the inverse intervention law in education.
I use the word suggestive deliberately here. Perhaps the results we see can be explained by other confounding factors. The data we have used is based on where pupils currently live, and the reasons why families choose to live in particular places (or attend particular schools) may play a part.
But it could be the case that the results reflect greater resource constraints and higher thresholds for EHCP assessments in more disadvantaged local authorities.
Just as other researchers have done in social care, further research examining the potential causes of the Inverse Intervention Law would be helpful.
[1] Using the 2011 version of LSOAs
Want to stay up-to-date with the latest research from FFT Education Datalab? Sign up to Datalab’s mailing list to get notifications about new blogposts, or to receive the team’s half-termly newsletter.






Thanks, this is interesting!
This research by Tammy Campbell also looks at children identified as needing SEND support, but who do not receive an EHCP: https://sticerd.lse.ac.uk/dps/case/cp/casepaper231.pdf. The findings suggest that there are more unmet needs in deprived areas – which looks in line with the inverse intention law. Linking in case it’s of interest to anyone reading!