Amid a slew of consultations following the publication of the Schools White Paper earlier in the week was a proposal from the Department for Education (DfE) to stop using confidence intervals to communicate how progress in a school or college compares to the national average.
At present, the following bandings in are used in secondary performance tables:
- Well above average – the score is greater than 0.5, and the entire confidence interval is above 0.
- Above average – the score is greater than 0 but lower than 0.5, and the entire confidence interval is above 0.
- Average – the confidence interval for the progress score includes 0.
- Below average – the score is lower than 0 but greater than or equal to -0.5, and the entire confidence interval is below 0.
- Well below average – the score is lower than -0.5, and the entire confidence interval is below 0.
Bandings are not calculated for schools and colleges which do not cover the full 11-16 age range.
Progress 8 bandings in 2024
If we look at schools’ Progress 8 data from 2024, the last year for which it was calculated before its 2-year hiatus due to the Covid-19 pandemic, we can plot schools’ scores based on the number of pupils included in the measure and the five bandings.
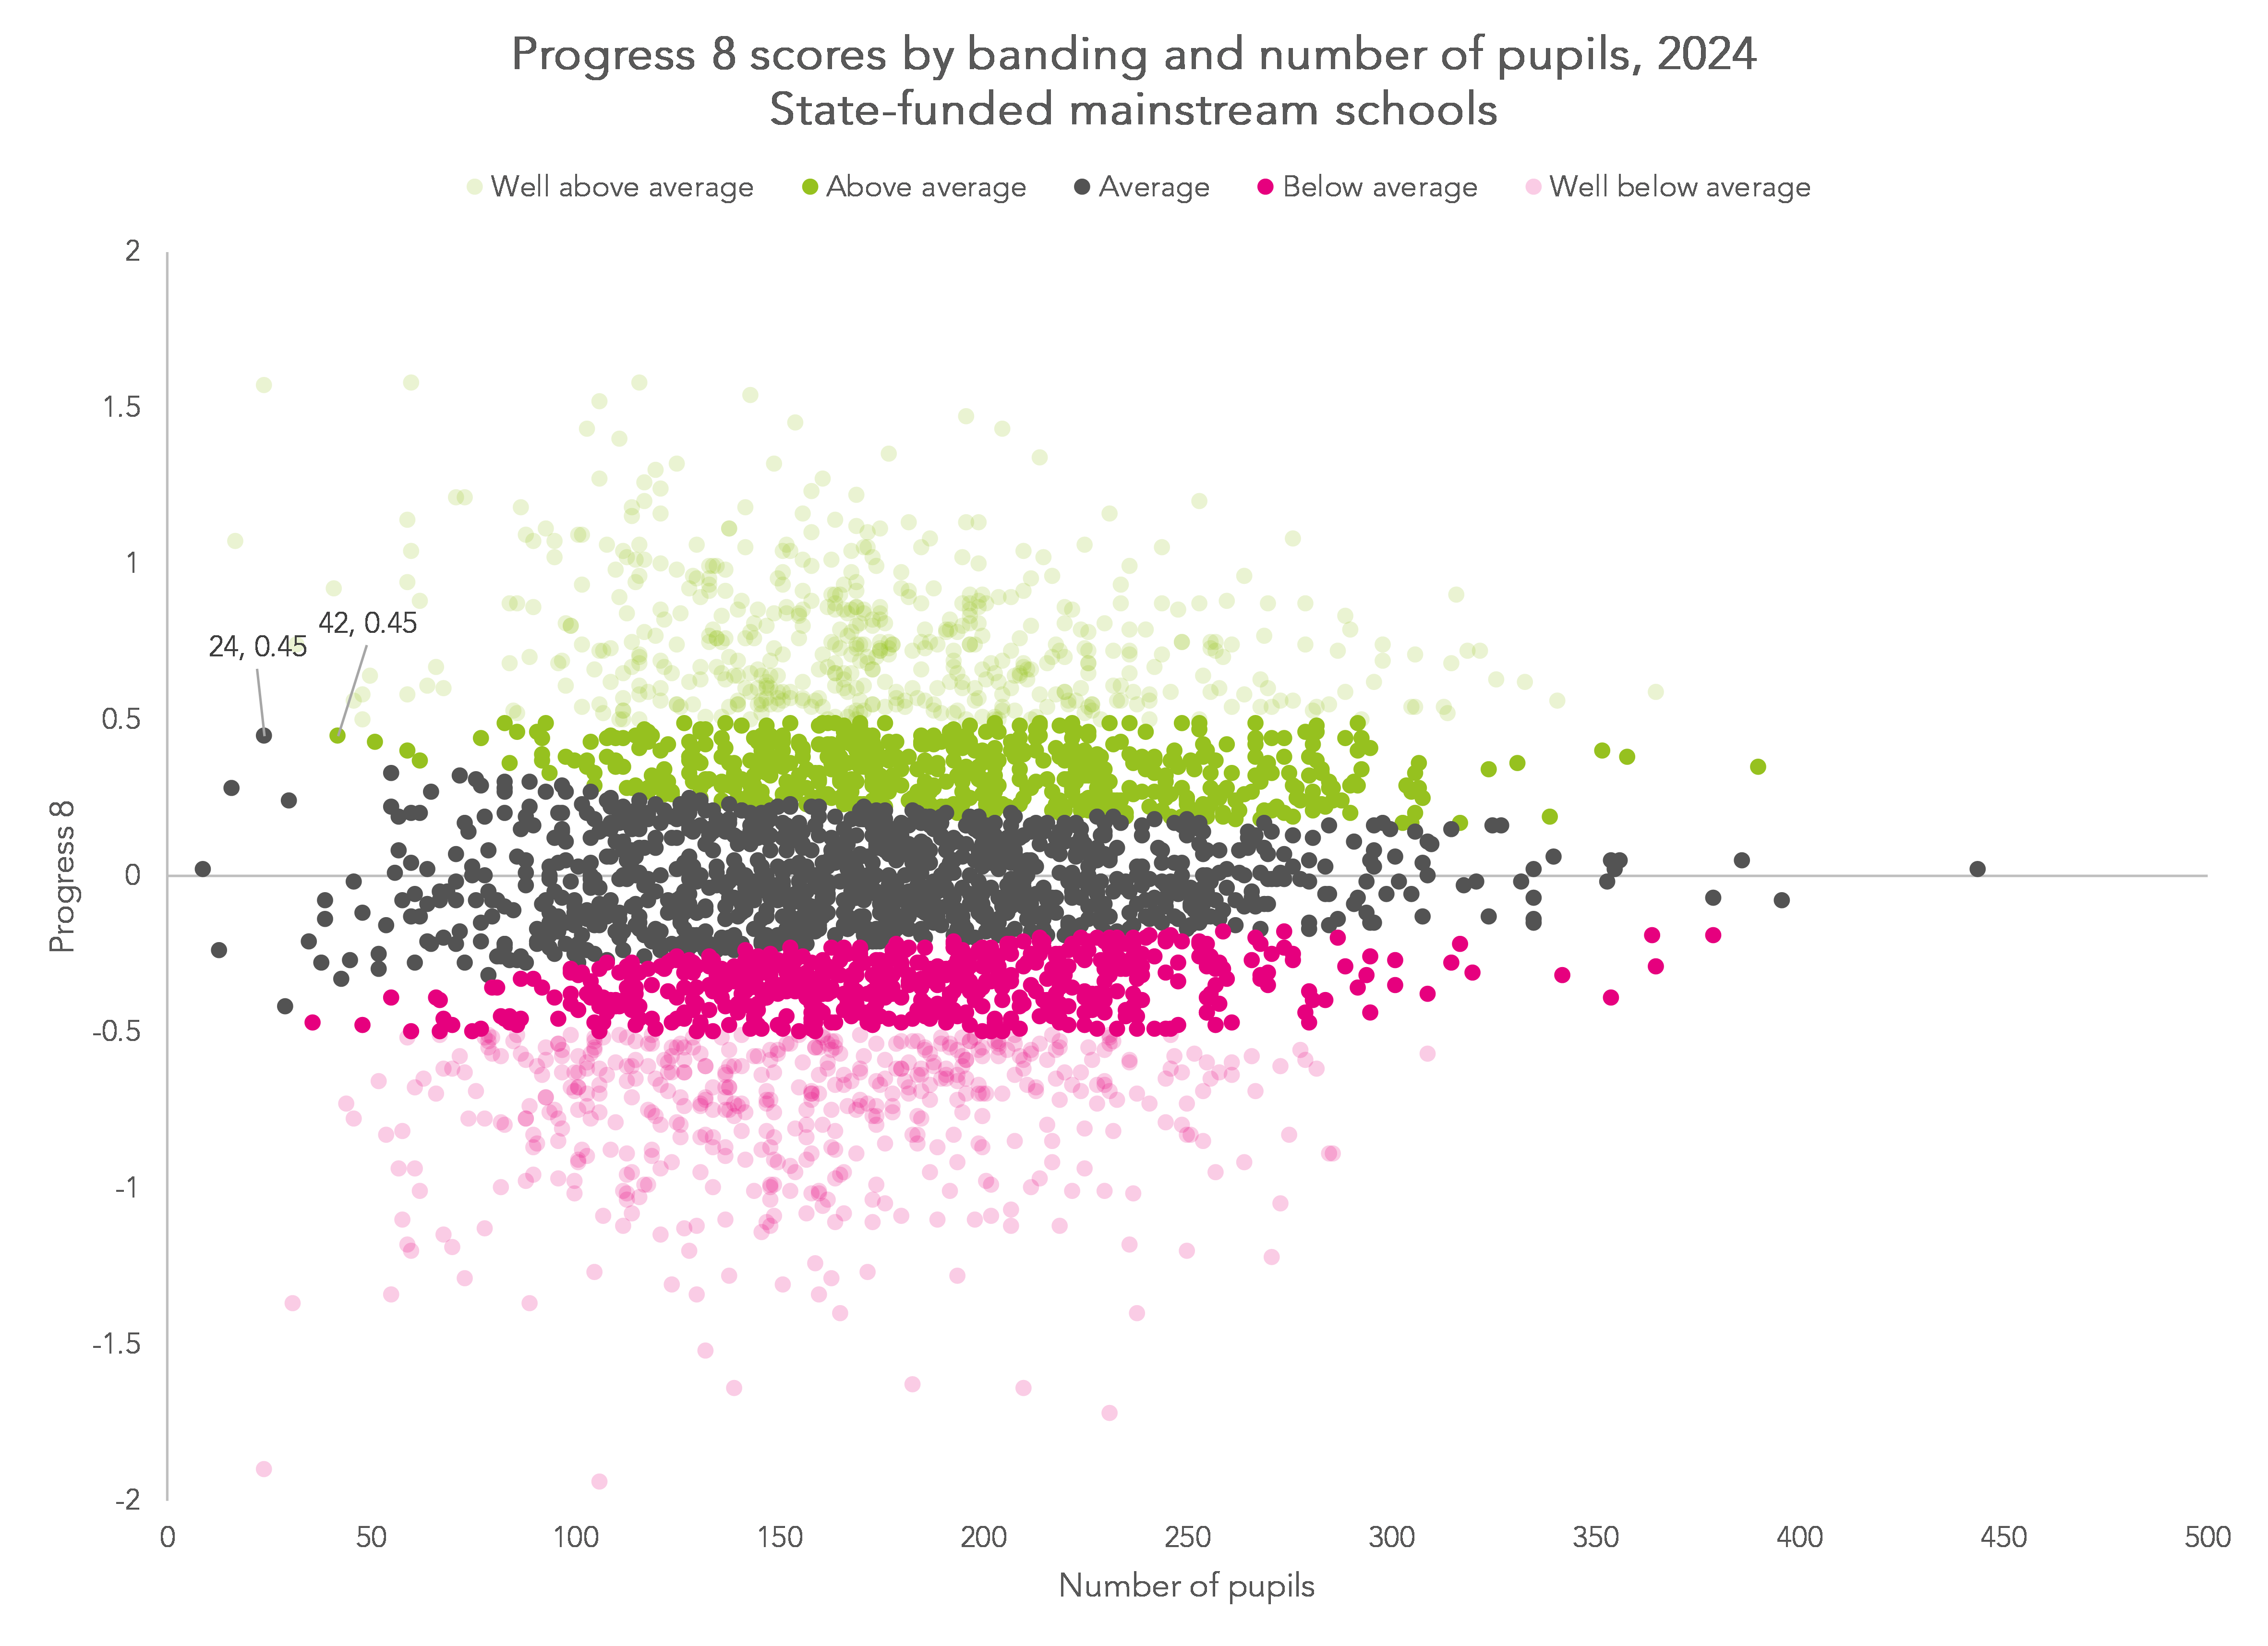
On the left hand side of the chart I have labelled two schools. Both schools achieved a Progress 8 score of 0.45. One school had 24 pupils and the other had 45. The former is banded “average” and the latter “above average”.
The reason for this is that the entire confidence interval for the larger school is greater than zero We can see this if we add the lines that show which schools have a confidence interval entirely above zero (significantly above average) and those with a confidence interval entirely below zero (significantly below average).
The red dashed lines form a funnel plot. They show that confidence intervals- and tests of statistical significance- are a function of the size of the a school’s Progress 8 score and the number of pupils.
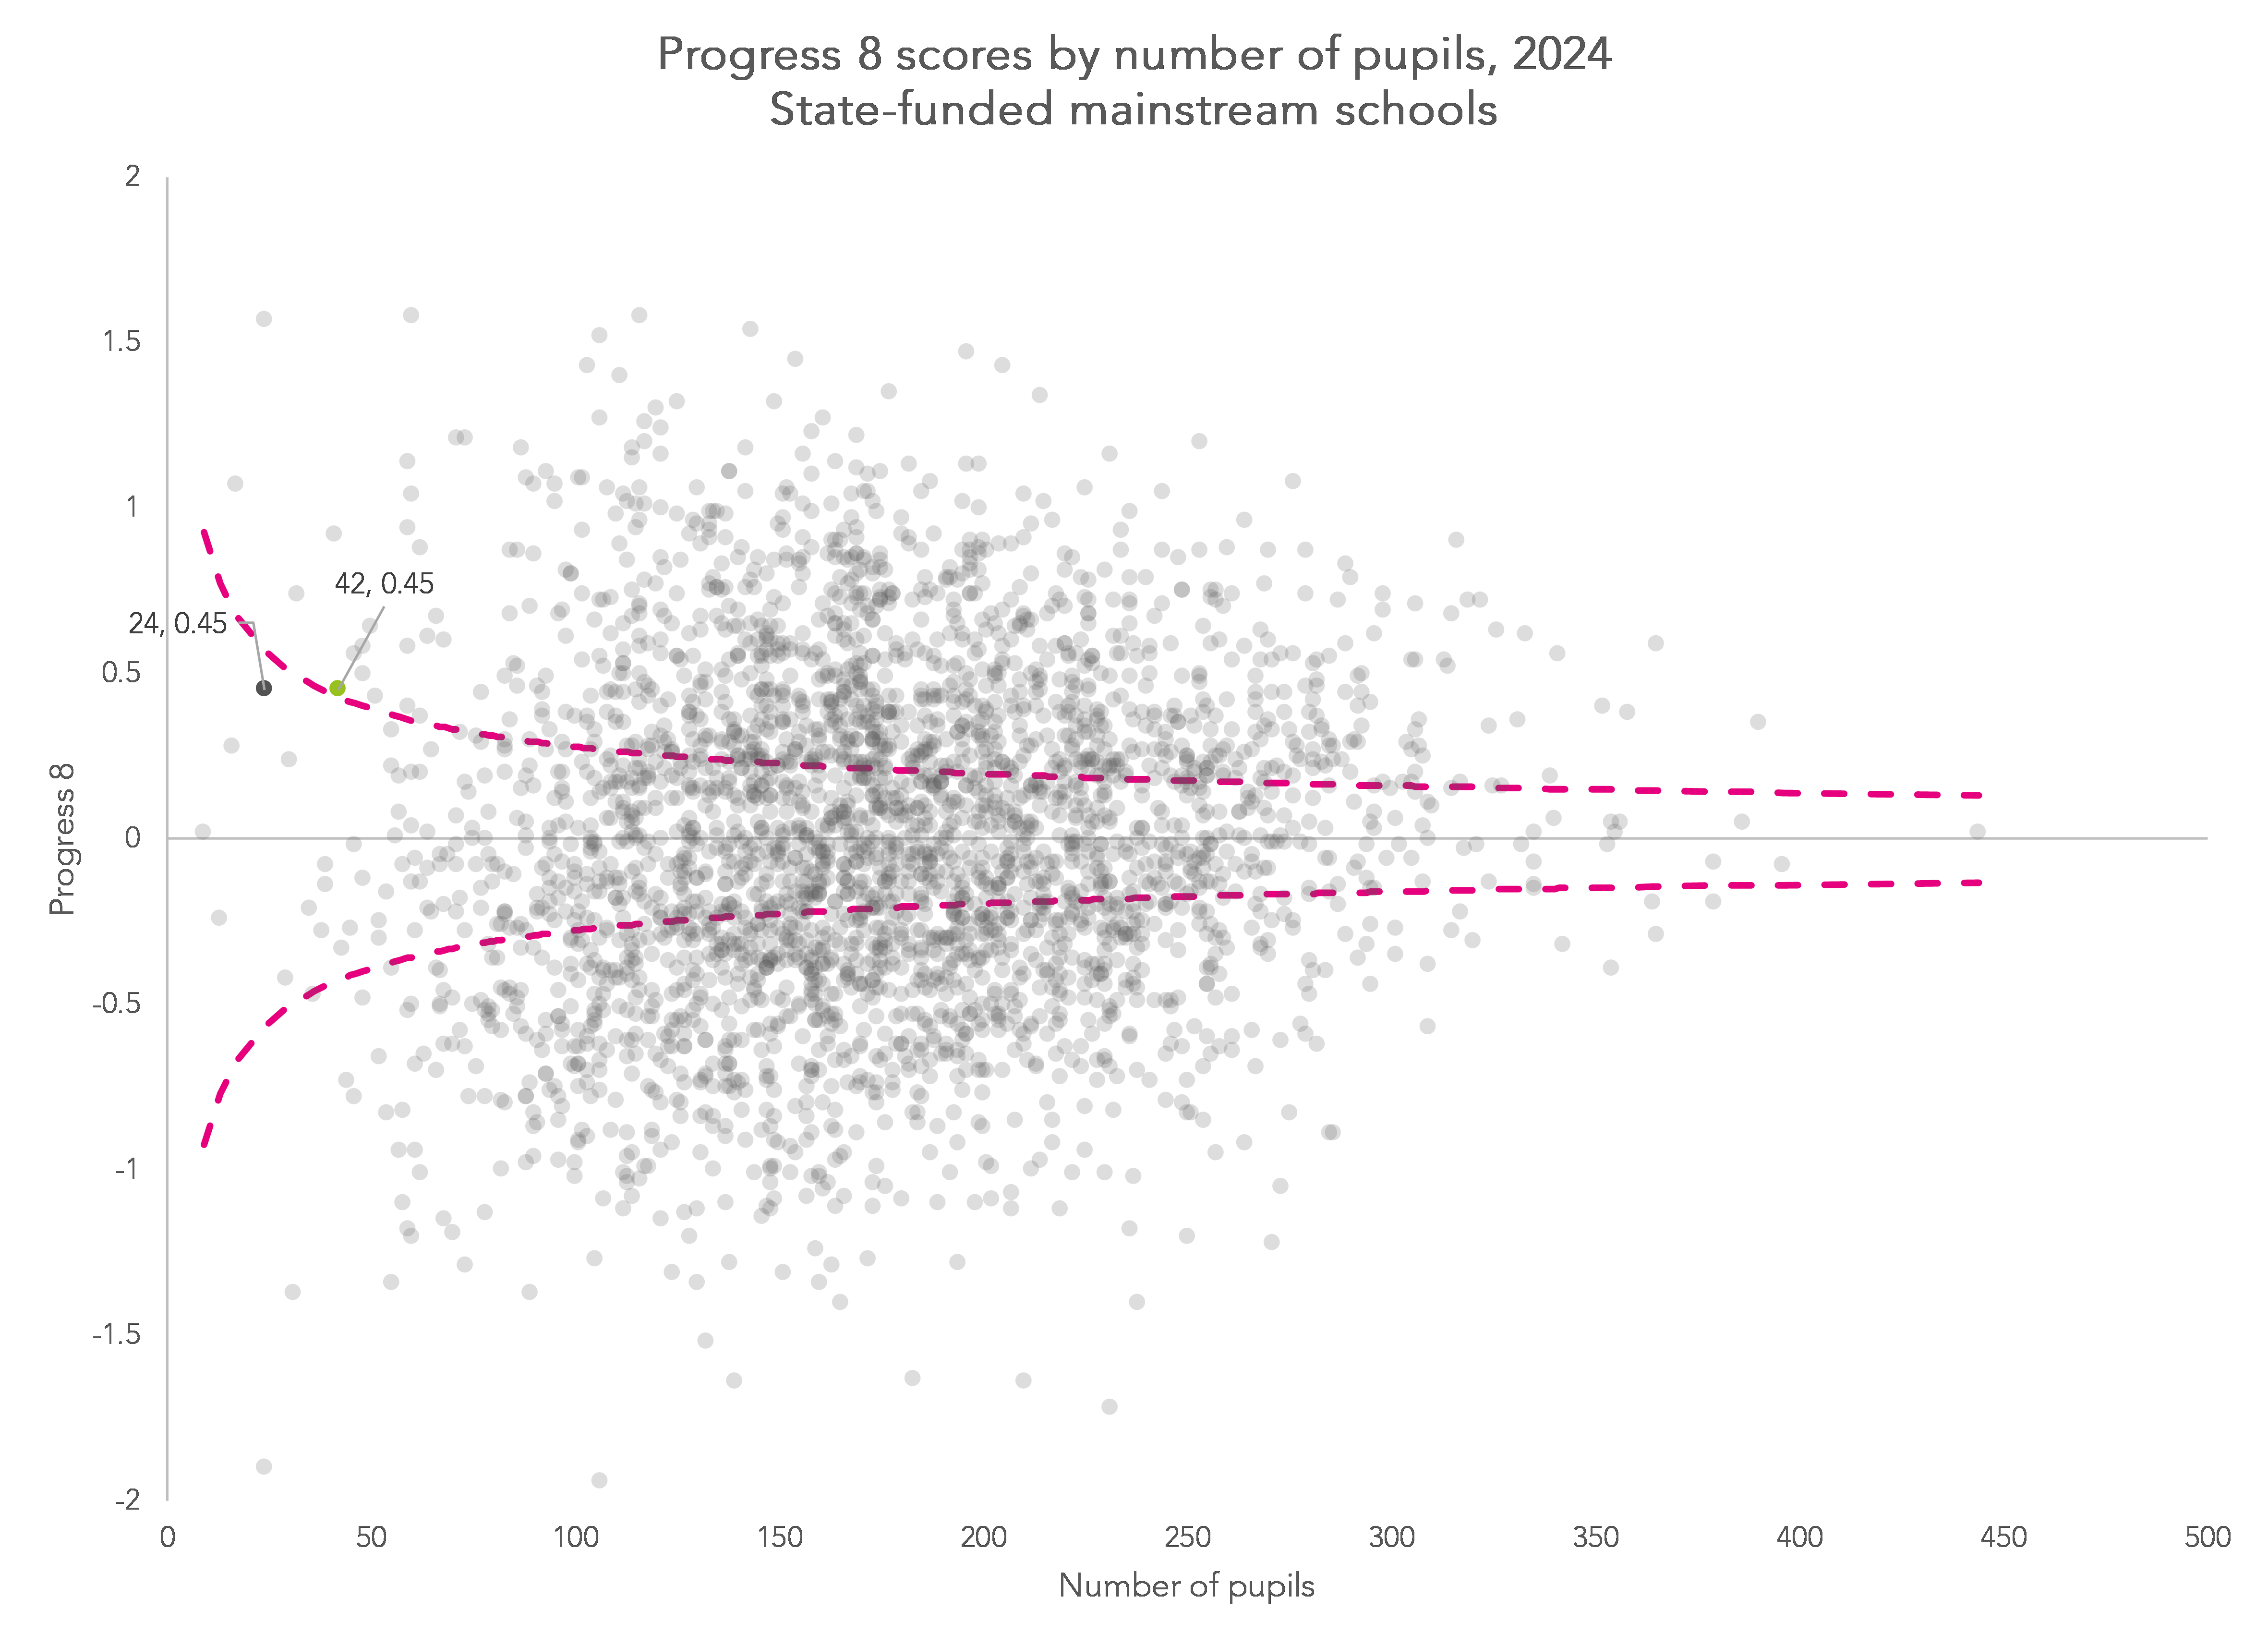
We can see here that the larger school lies just above the upper dashed line, hence the difference in banding compared to the smaller school.
With a large enough number of pupils, almost any difference becomes significantly different from average and, as a result, large schools are less likely to fall in the “average” band. Hence one-third (33%) of secondary schools were in the “average” band for Progress 8 in 2024, whereas two-thirds (67%) of primary schools were in the “average” band for Key Stage 2 progress in 2023.
The proposed change
As the consultation says: “Bandings can be impacted by school size. The smaller a school, the larger the confidence interval, meaning smaller schools need to achieve higher progress scores to be labelled “above average”. Therefore, a school can achieve a higher progress score than another but be assigned a lower banding.”
The solution proposed by DfE is to abandon confidence intervals and instead report percentile ranks. Both of the two example schools would have the same percentile rank.
The problem with this is that it is swapping one set of problems for another.
Smaller schools will tend to have more variable results, in other words, be less likely to fall in the “average” band.
In the chart below, we show the percentage of schools of different size that were in the top 20% and bottom 20% of all schools for Progress 8 in 2024.
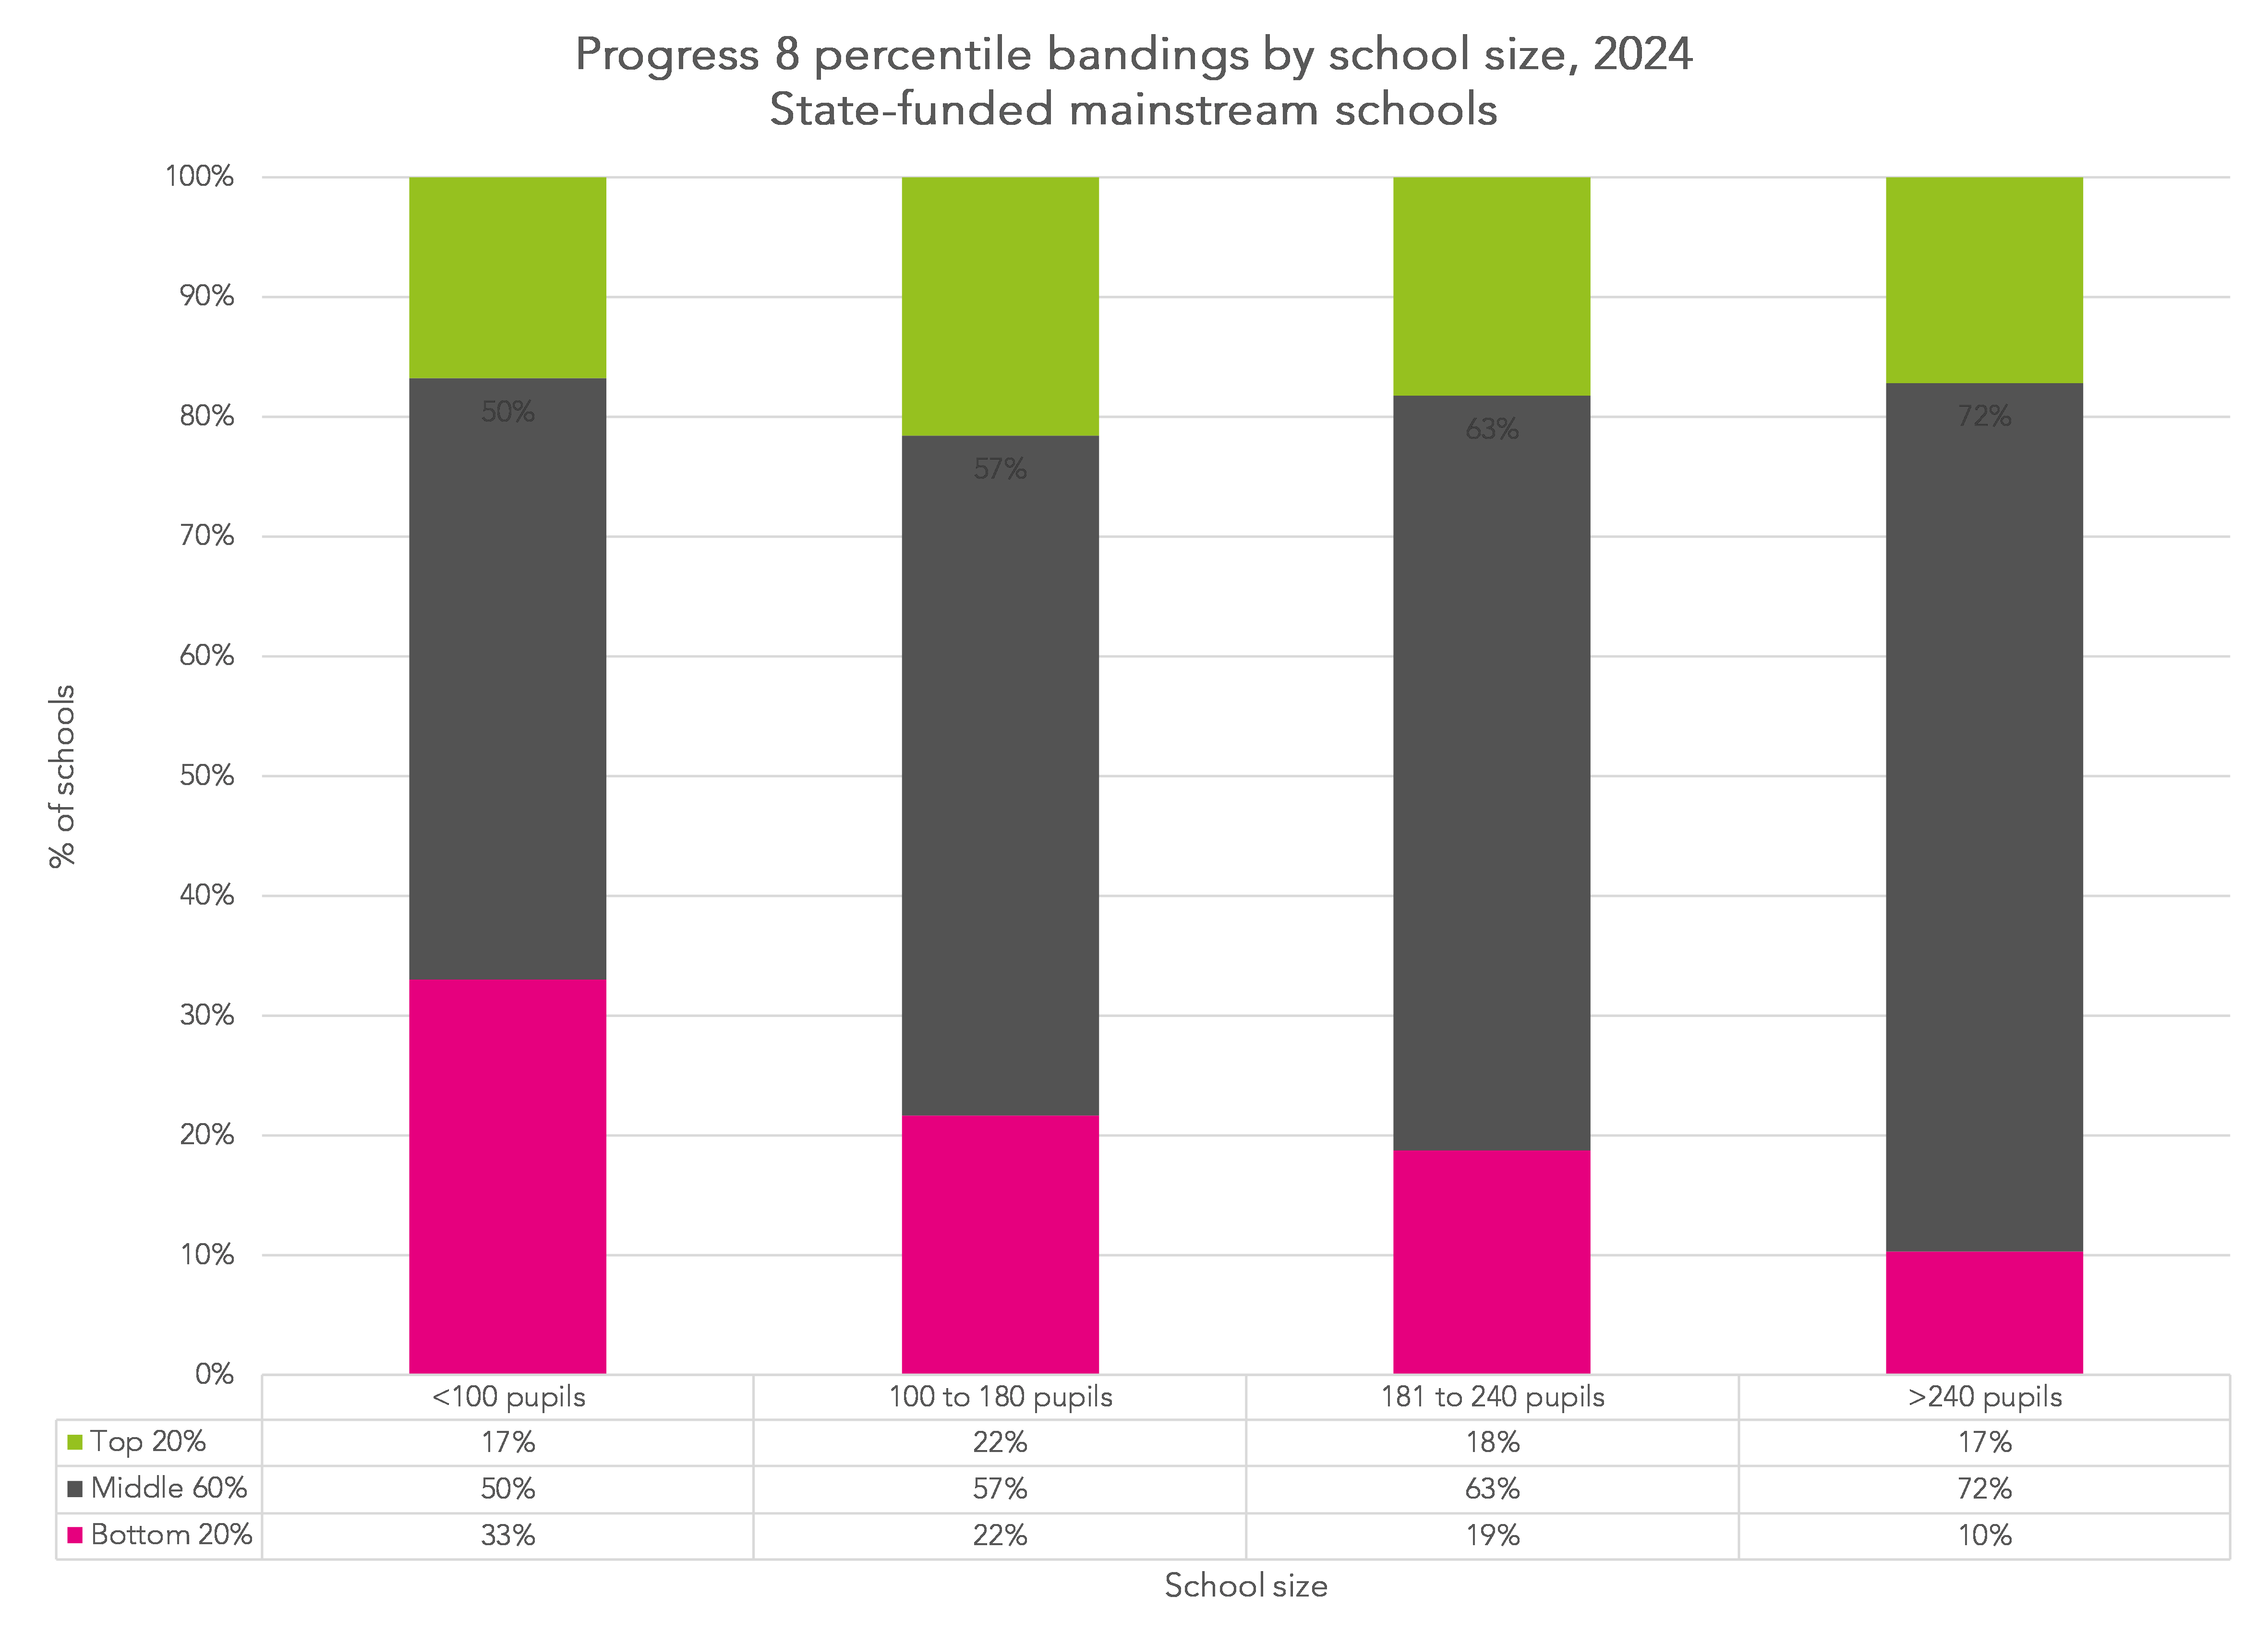
This shows that smaller schools (those with <100 pupils) are less likely to fall in the middle band (between the 20th and 80th percentiles). In other words, their results tend to be more variable.
The probability of falling in the middle band increases with school size. This is the opposite of the current position, where the probability of falling in the average band decreases with school size.
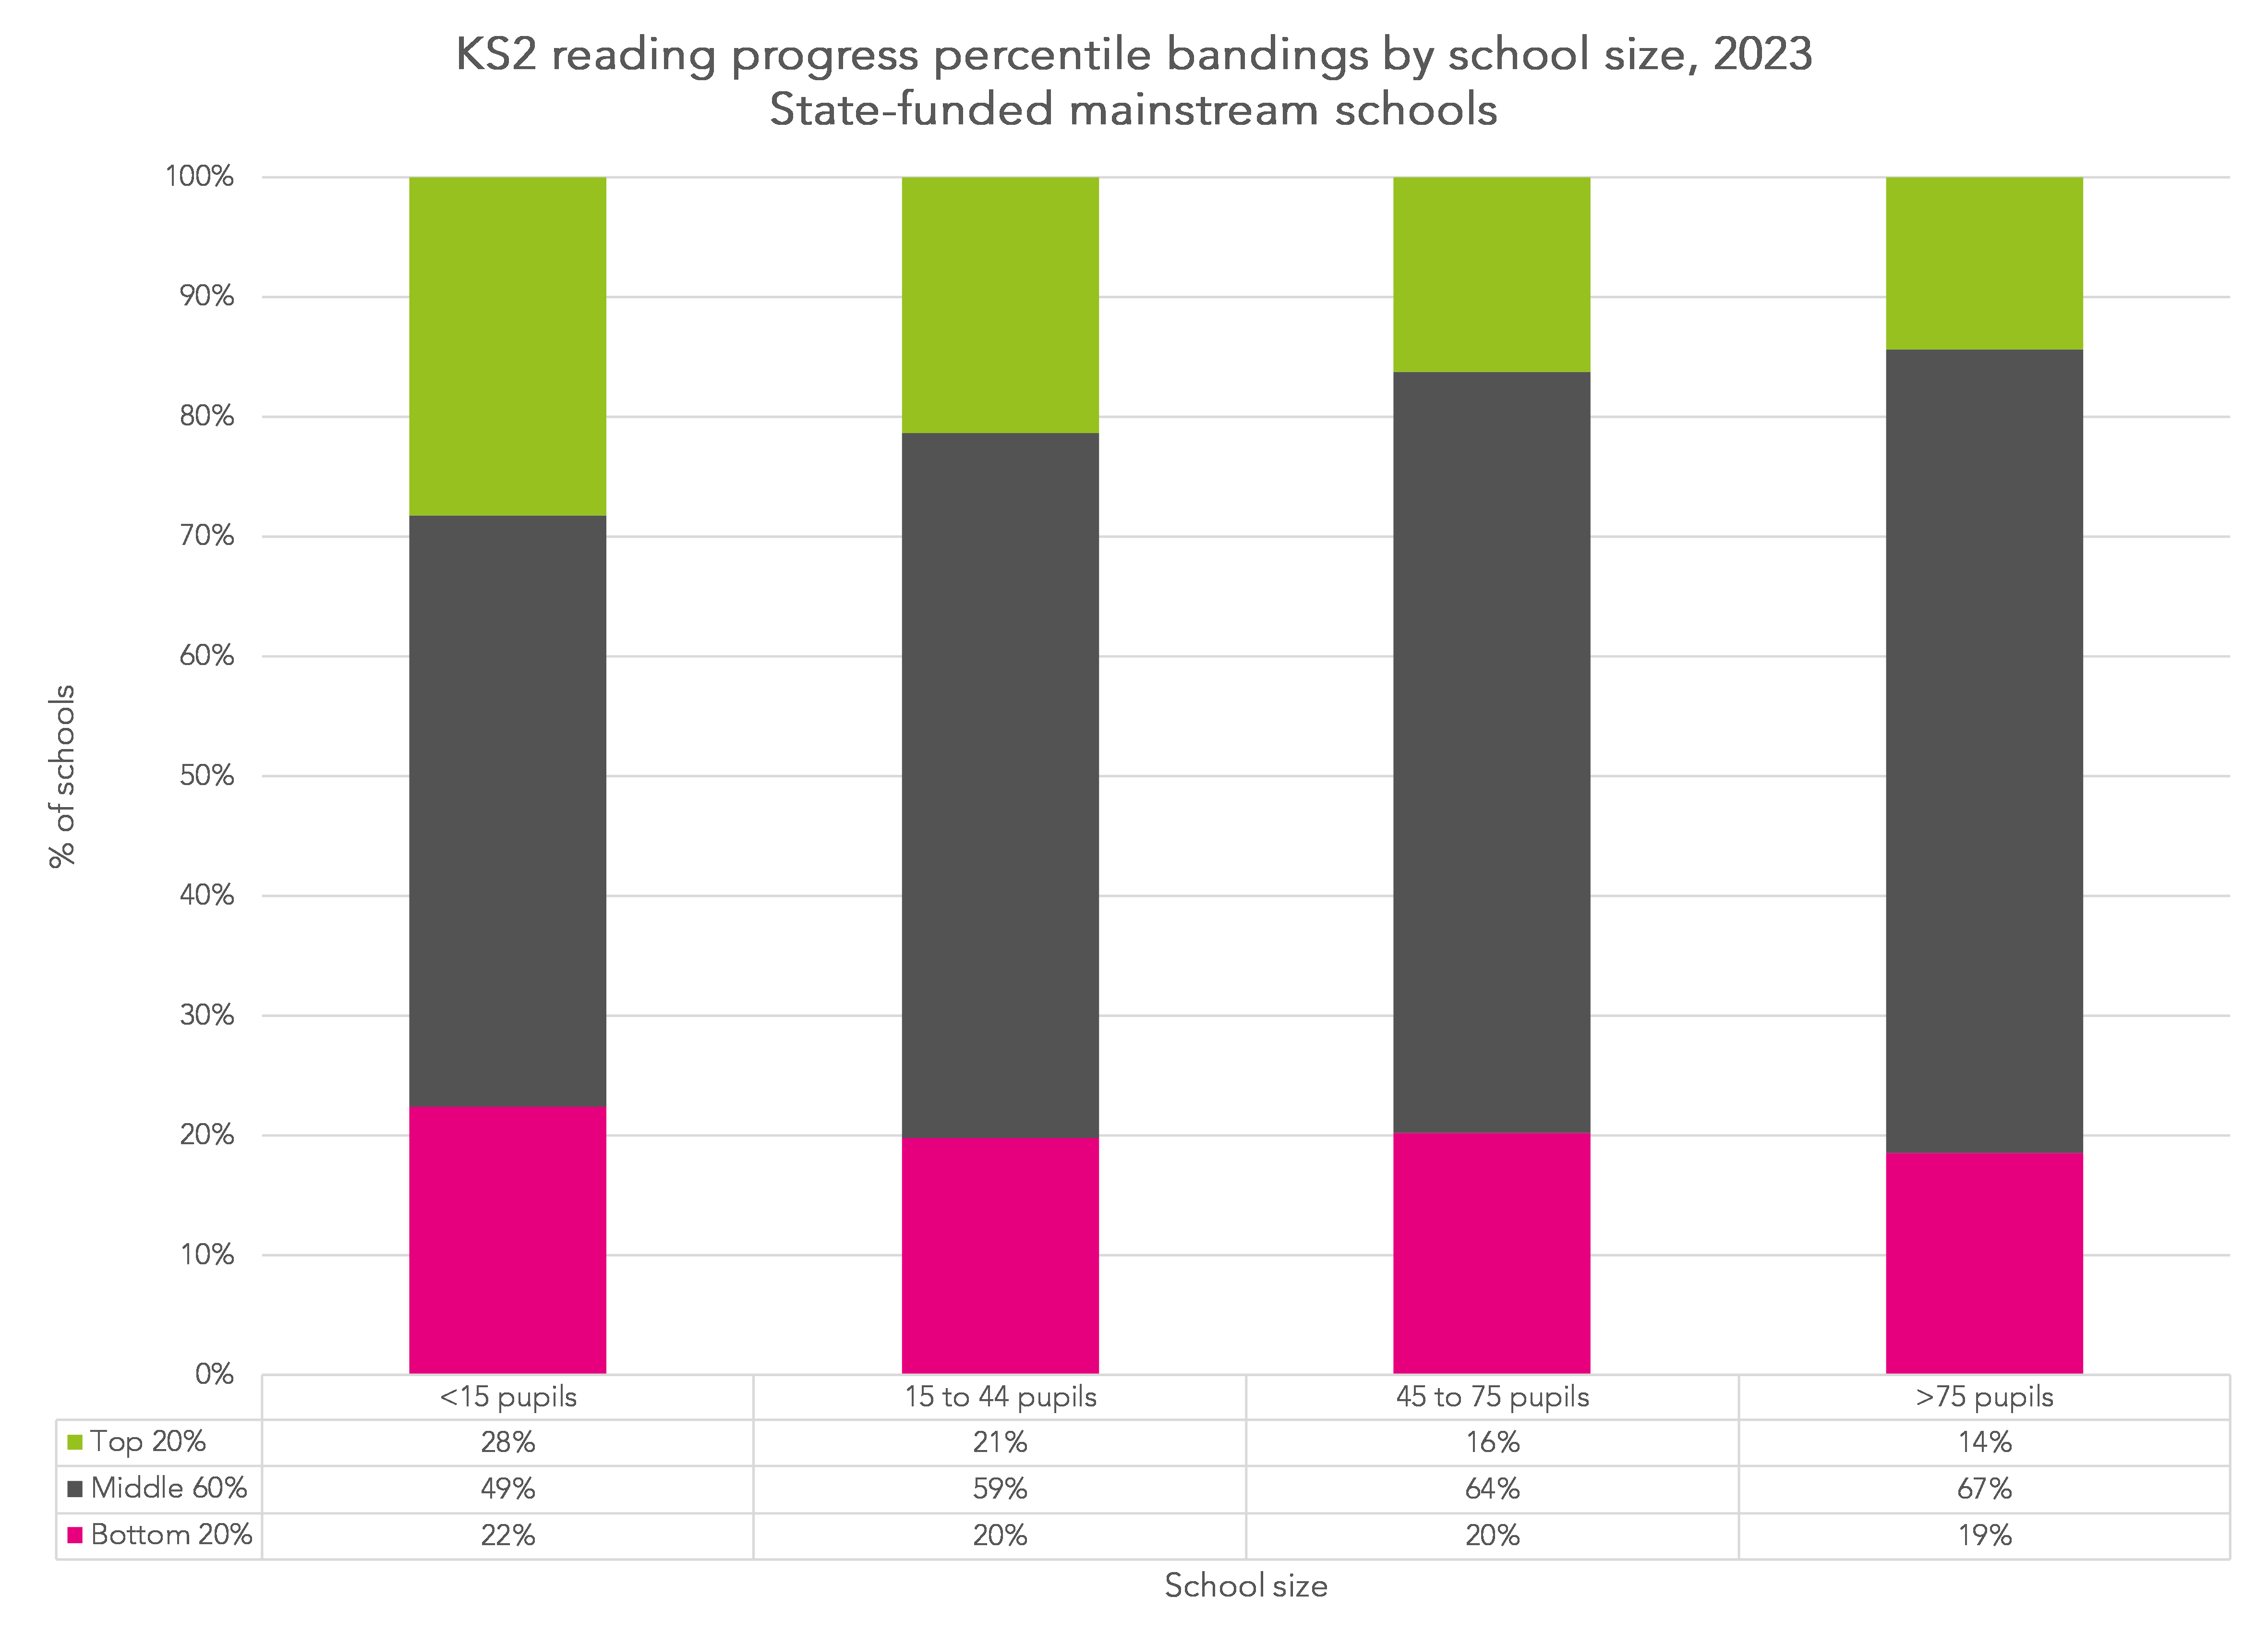
This is particularly apparent for primary schools. DfE could mitigate this to some extent by publishing three-year averages rather than results for three individual years.
Is it worth doing?
Ultimately, this is a problem of comparing statistical units (i.e. schools) of different size. If all schools had the same number of pupils this problem wouldn’t occur. The proposal is to ignore the increased variability in performance among smaller schools, albeit including a technical document about uncertainty alongside the new percentile-based bandings.
DfE’s proposal follows a diametrically-opposing decision by Ofsted to plaster their Inspection Data Summary Report (IDSR) with confidence intervals and significance tests. Perhaps the audiences of Performance Tables and IDSR are different and can handle the difference in approaches.
Either way, neither confidence intervals or percentile ranks alone can tell the whole story about a school’s performance. But they can be useful in interpretation. That’s why we use both alongside school performance measures in FFT Aspire.
Want to stay up-to-date with the latest research from FFT Education Datalab? Sign up to Datalab’s mailing list to get notifications about new blogposts, or to receive the team’s half-termly newsletter.


Leave A Comment