This is an updated version of this article originally published on 3rd March correcting an error
The long-awaited publication of the Schools White Paper last week coincided with publication of a range of consultations, including into secondary school performance measures.
One proposed new measure, which is the subject of this article, is a supplementary progress measure for pupils with low prior attainment (LPA) to be introduced in Summer 2027 when a modified version of Progress 8 will return.
The methodology of the new LPA measure is published here.
Progress 8 scores for the group of pupils with low prior attainment (those with an average score below 100 from KS2 reading and maths tests) are already published as part of School Performance Tables.
The proposed new measure appears to be additional to that measure. The purpose seems to be twofold:
- A recognition that not all pupils fill their Attainment 8/ Progress 8 slots[1]
- A recognition that Progress 8 scores are associated with pupil characteristics such as English as an additional language (EAL) and special educational needs (SEN), particularly among the LPA group
Data
We use Key Stage 4 data from the National Pupil Database for 2023/24. This is the most recent year for which Progress 8 data is available.
We restrict our analysis to pupils who complete Key Stage 4 in state-funded mainstream schools. We do not think Progress 8 is a suitable measure for most special schools and have proposed an alternative here.
We calculate the best-fit progress measure in line with the DfE consultation document. This means first working out versions of Progress 8 based on best 3 subjects, best 4 subjects, best 5 subjects, best 6 subjects, best 7 subjects and best 8 subjects. A pupil’s best-fit progress score is their highest progress score from any of those versions.
Note that the “best 8” version differs to Progress 8 as English and maths are not double-weighted (as they are in Progress 8), and, unlike Progress 8, is not presented as an average points per entry measure.
DfE also suggest recalculating prior attainment for EAL pupils. They suggest using KS2 maths score only where there is higher than their average in reading and maths.
Consequently, we reassign pupils to prior attainment groups (PAGs) using this revised prior attainment measure. We use the same cutpoints as those in the DfE technical guidance, hence there remain 34 PAGs in total, with PAGs 1-14 covering the LPA group. We refer to these as adjusted PAGs. We refer to the original PAGs used in the 2023/24 Progress 8 measure as unadjusted PAGs.
Pupils with EAL
First of all, let’s look at how pupils’ KS2 reading scores differ compared to their KS2 maths scores.
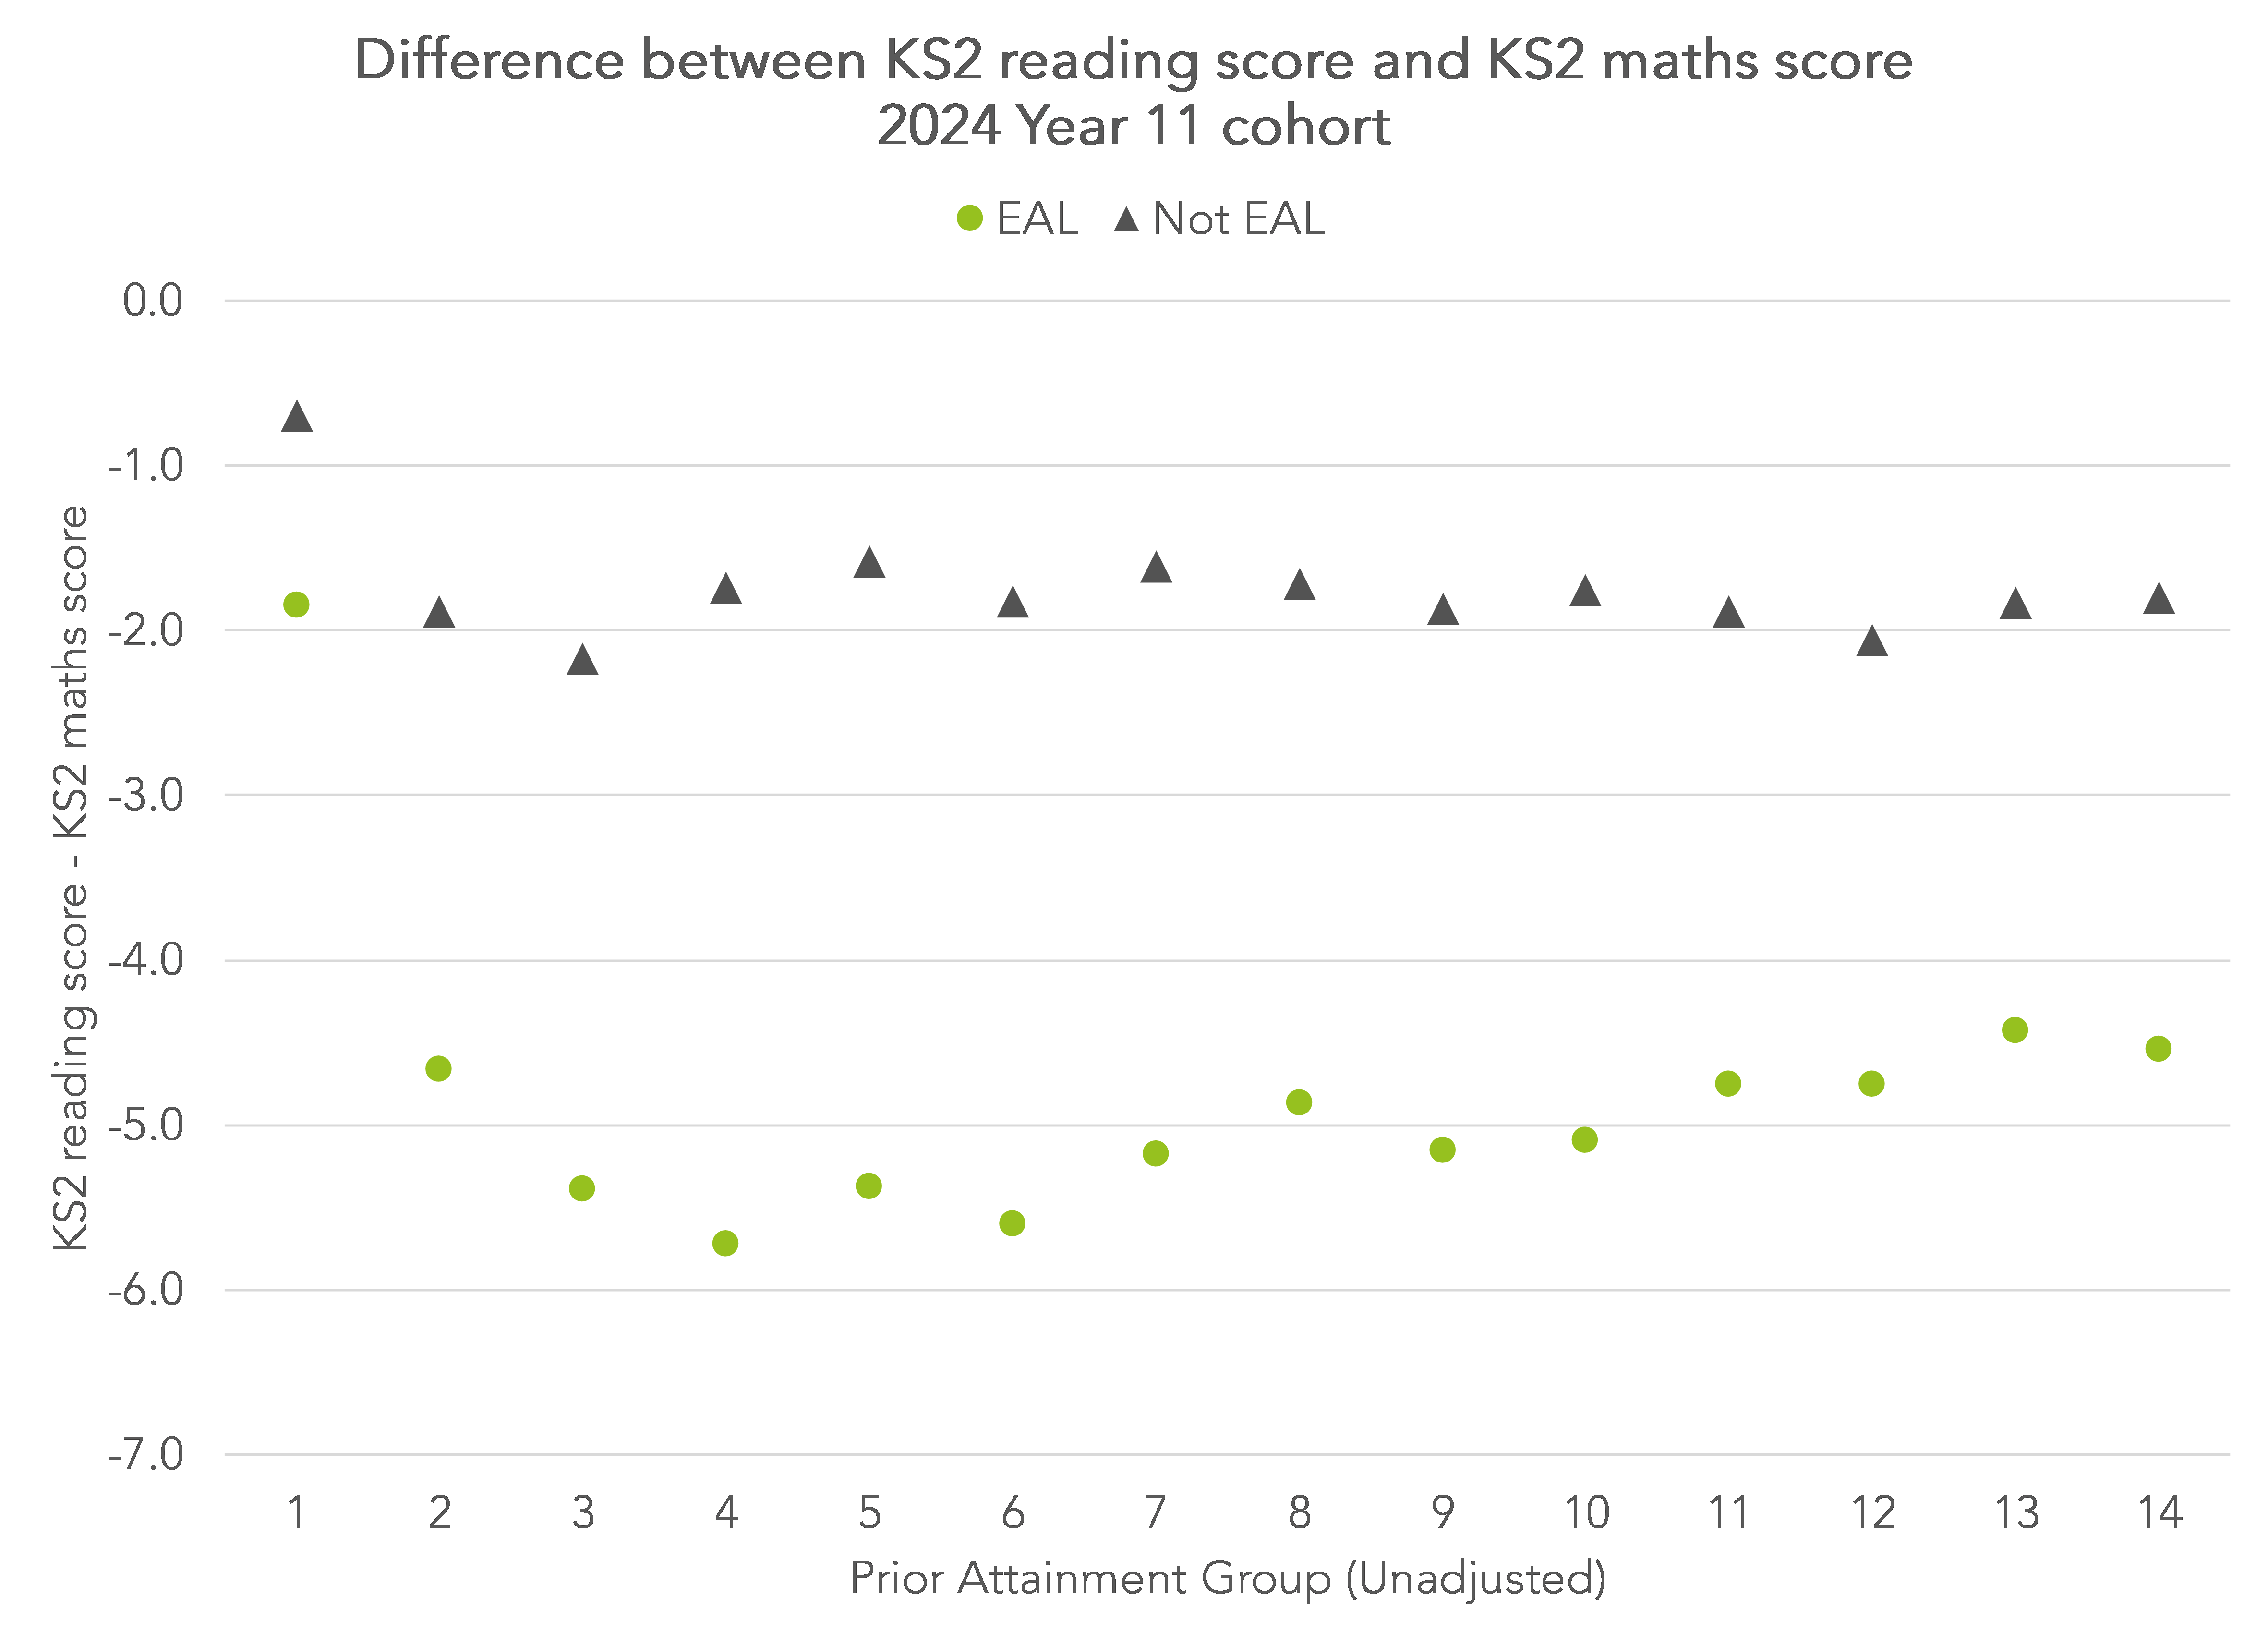
In general, reading scores are around 4-5 scaled score points lower compared to maths scores among EAL pupils, and 1-2 scaled score points lower among other pupils.
This would tend to suggest that using KS2 maths scores in place of the average of reading and maths for EAL pupils is slightly harsh, as maths scores tend to be slightly higher than reading for non-EAL pupils, at least for those scoring below 100 in maths at KS2. As a result, EAL pupils will tend to end up in higher prior attainment groups. Of 23,000 EAL pupils in the LPA group based on unadjusted PAGs, almost 6,000 (25%) are no longer in the LPA group based on the adjusted PAGs of the best-fit progress measure.
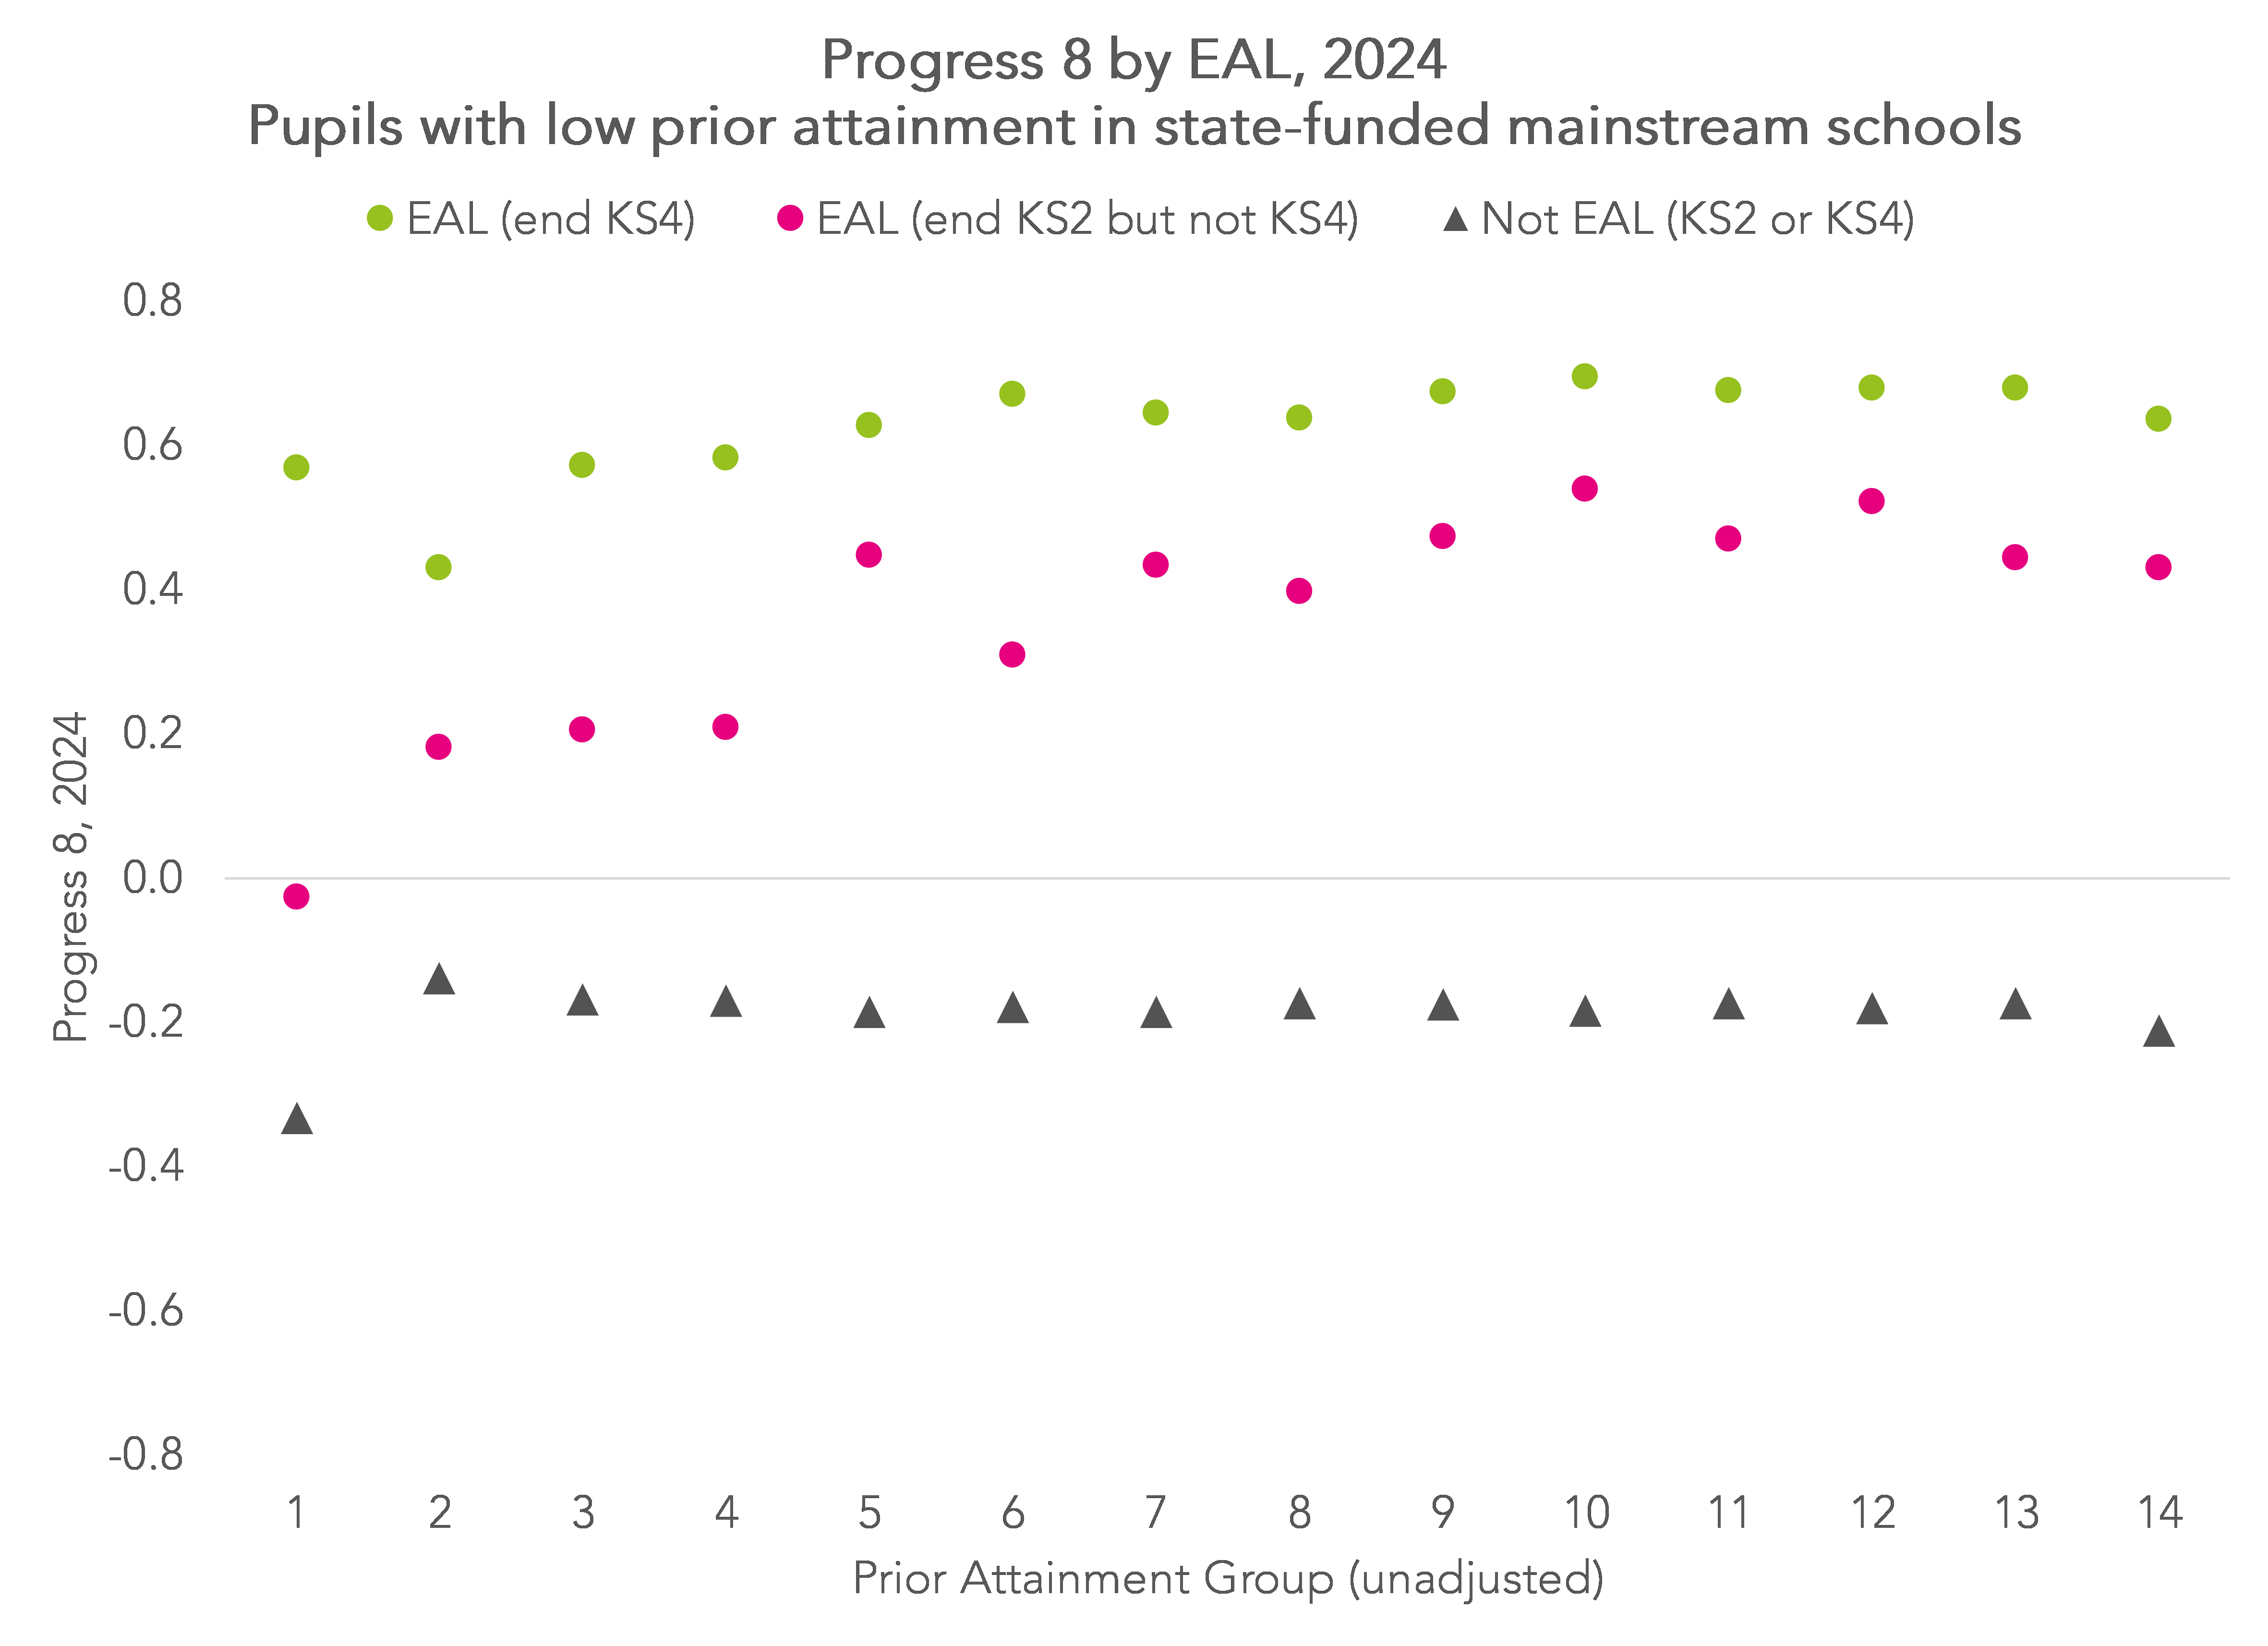
It is also worth remembering that EAL status is not a fixed characteristic, at least as far as NPD data is concerned. There are pupils whose EAL status changes between the end of Key Stage 2 and the end of Key Stage 4. Around 6% of LPA pupils who were not classified as EAL at the end of KS4 were classified as EAL at the end of KS2.
The Progress 8 scores of the group who were EAL at the end of KS2 but not KS4 was in-between the group of pupils who were EAL at the end of KS4 and the group who were not EAL at both KS2 and KS4. However, their scores were closer to those of the former group.
Attainment3 to Attainment8
Having made the adjustments to the prior attainment groups for EAL pupils, we now examine how attainment varies as successively more qualifications are counted, starting with up to 3 subjects and working up to 8 subjects.
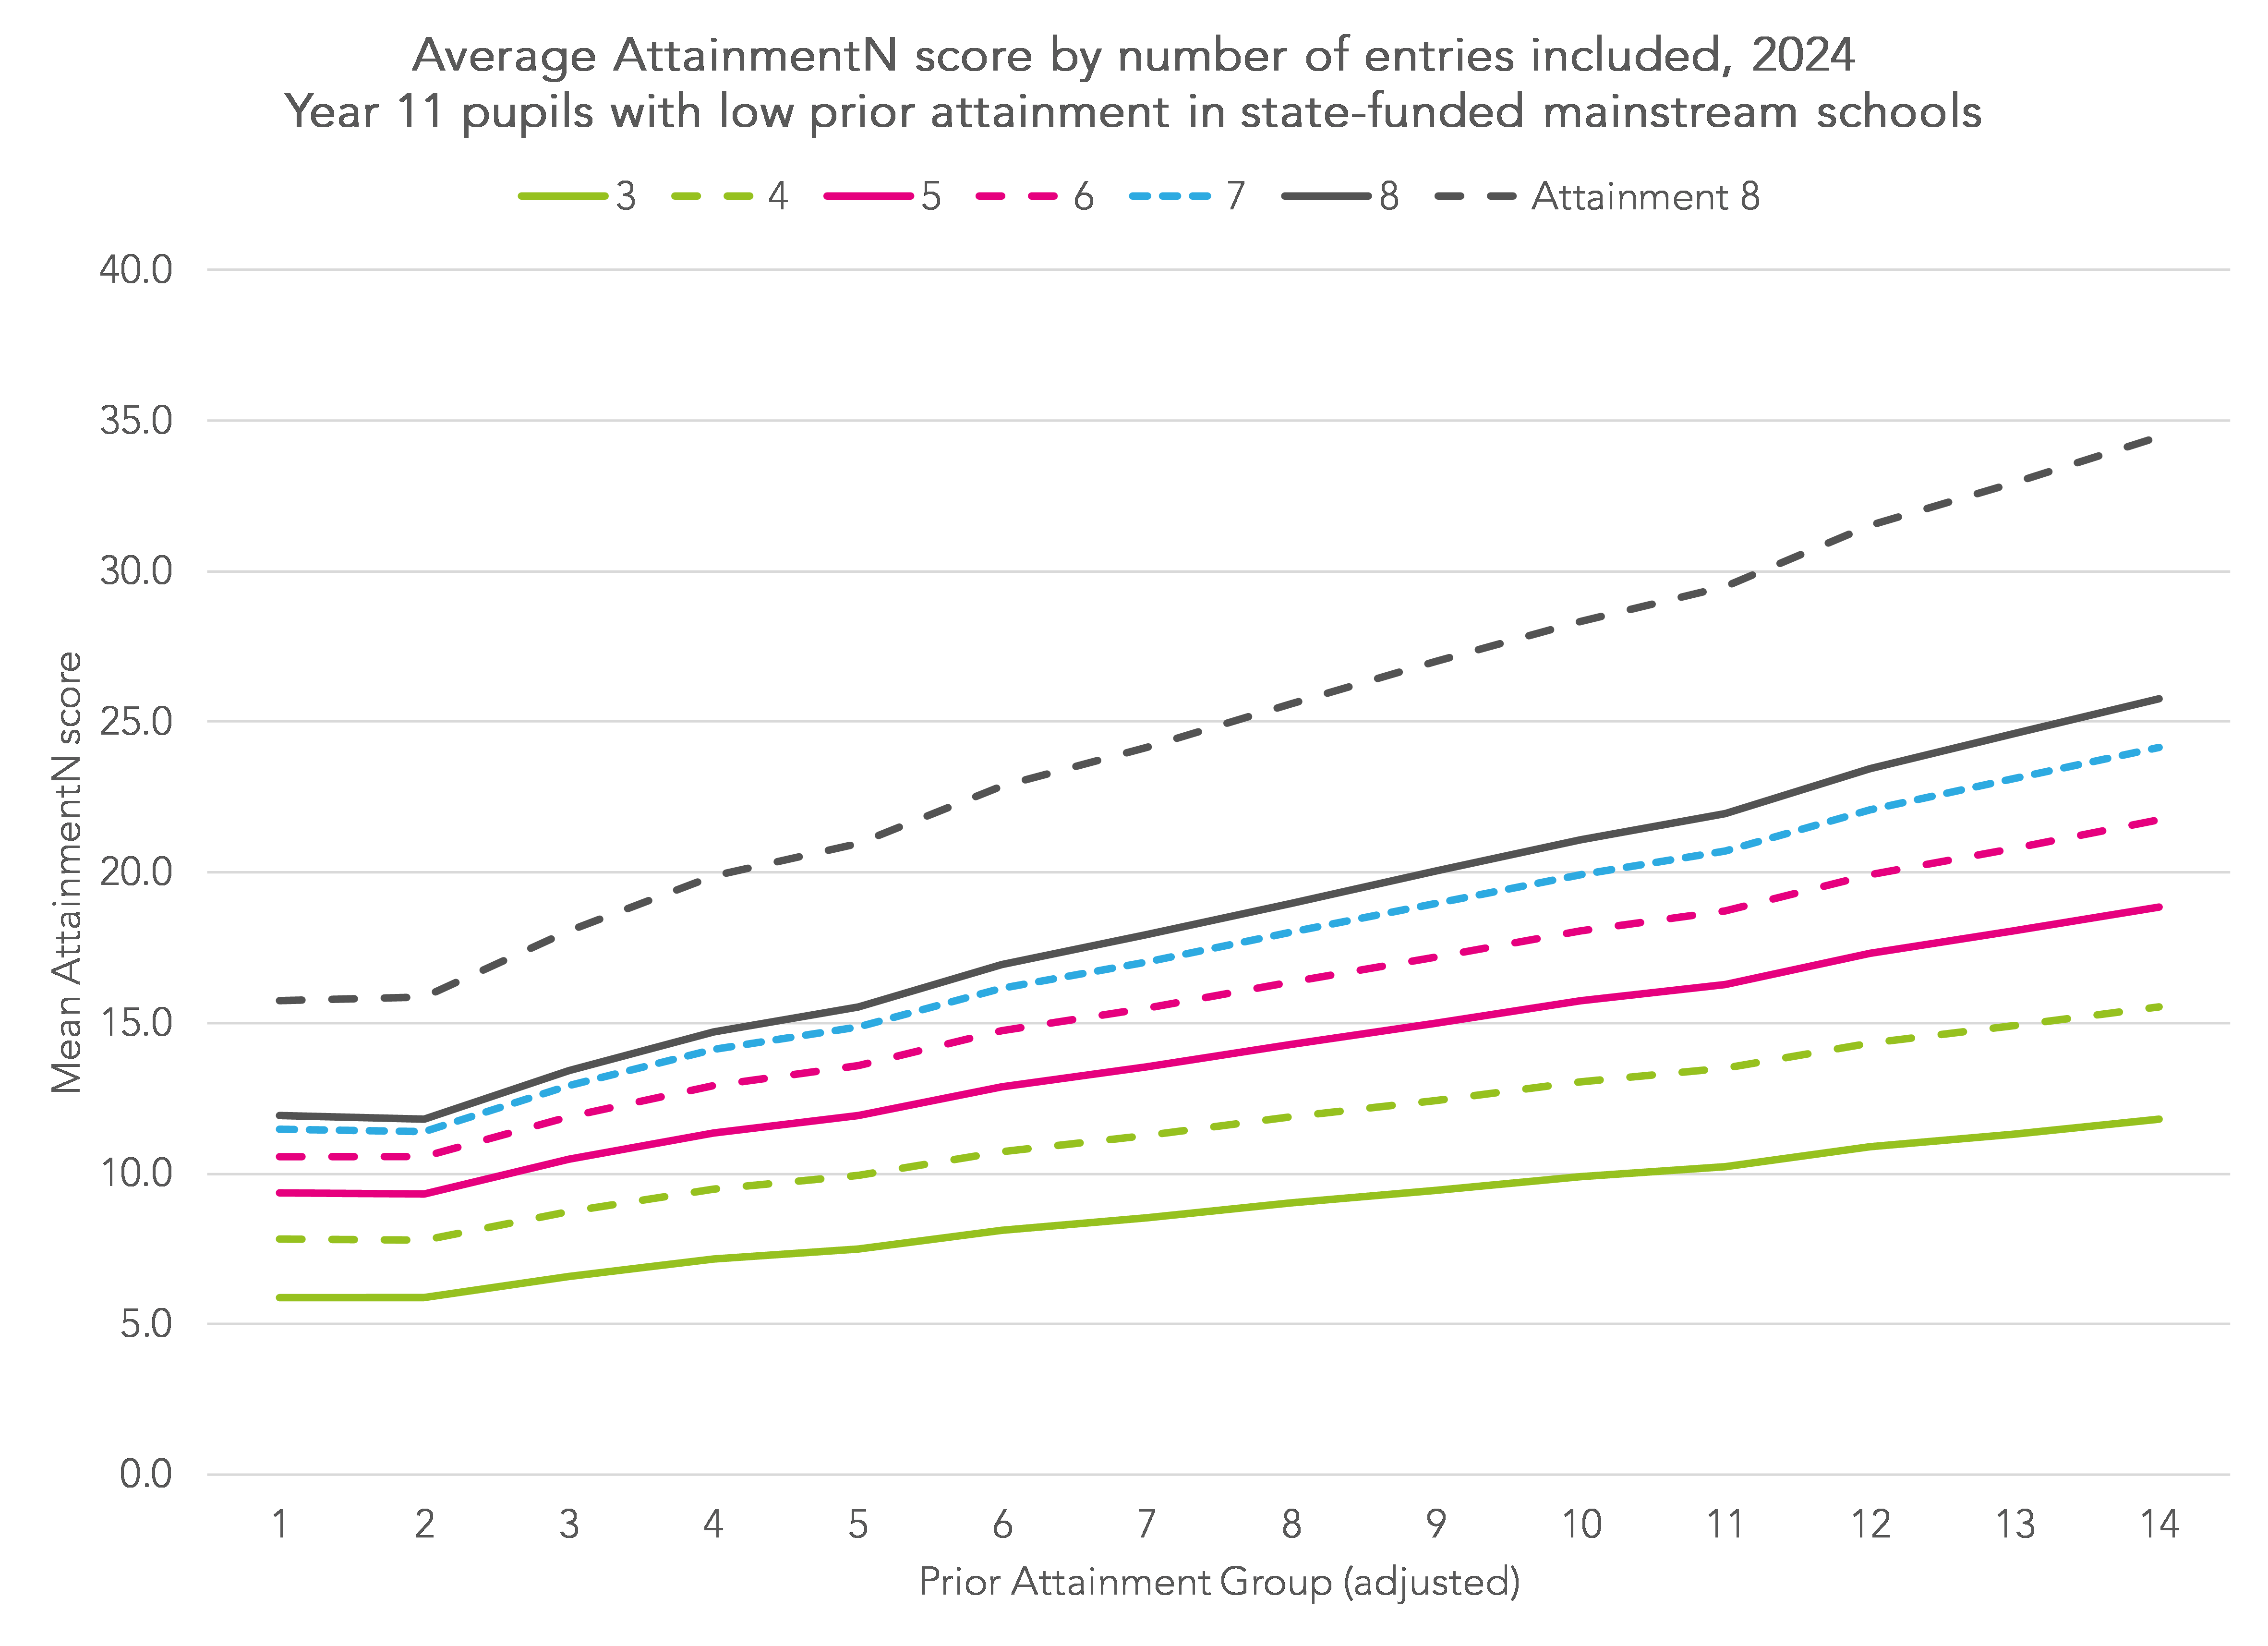
Clearly, as more entries are included, the mean total attainment score (which we label AttainmentN, where N is a number from 3 to 8) increases. We also show the current Attainment8 measure. Compared to AttainmentN based on 8 entries, this has English and maths double-weighted. This has an increasing impact as prior attainment increases.
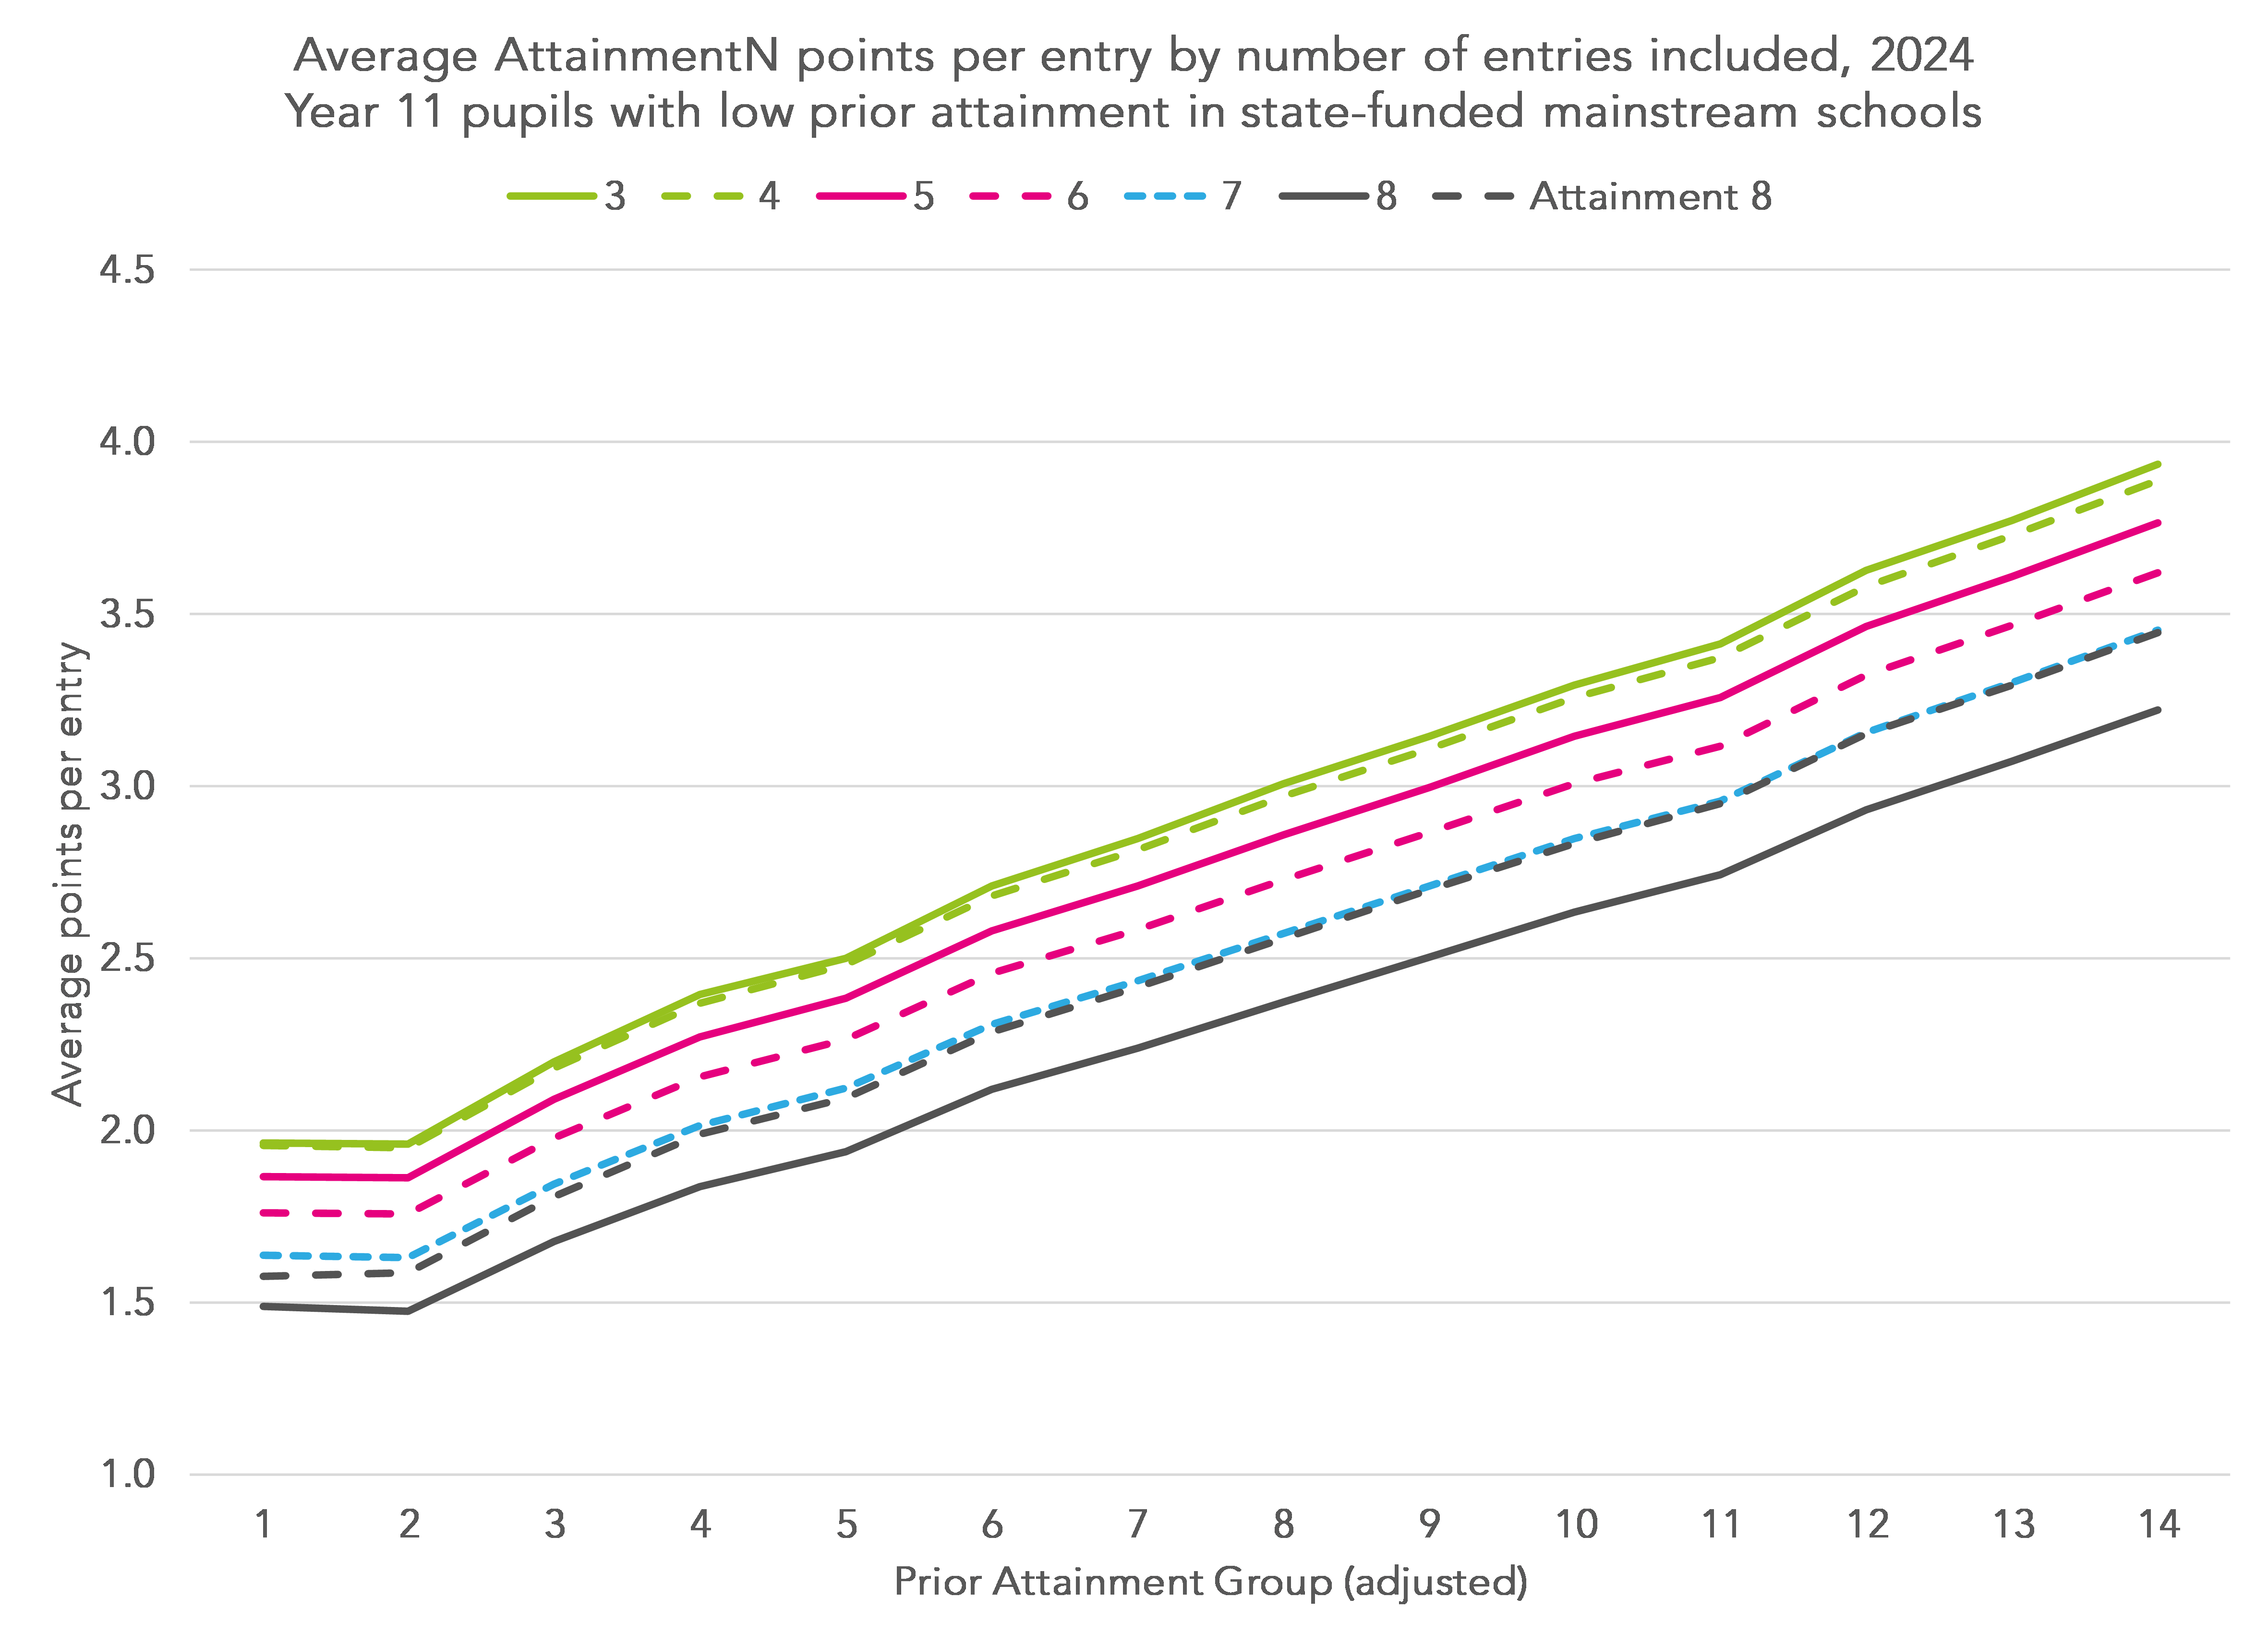
We can convert those scores into average points (APS) per entry by dividing by the number of entries counted. This reverses the ordering of the lines, the APS per entry is highest based on counting 3 subjects.
What difference does it make compared to Progress 8?
Let’s start off by looking at the current Progress 8 measure for the LPA group. In the following chart, we show Progress 8 scores split by EAL and SEN[2].
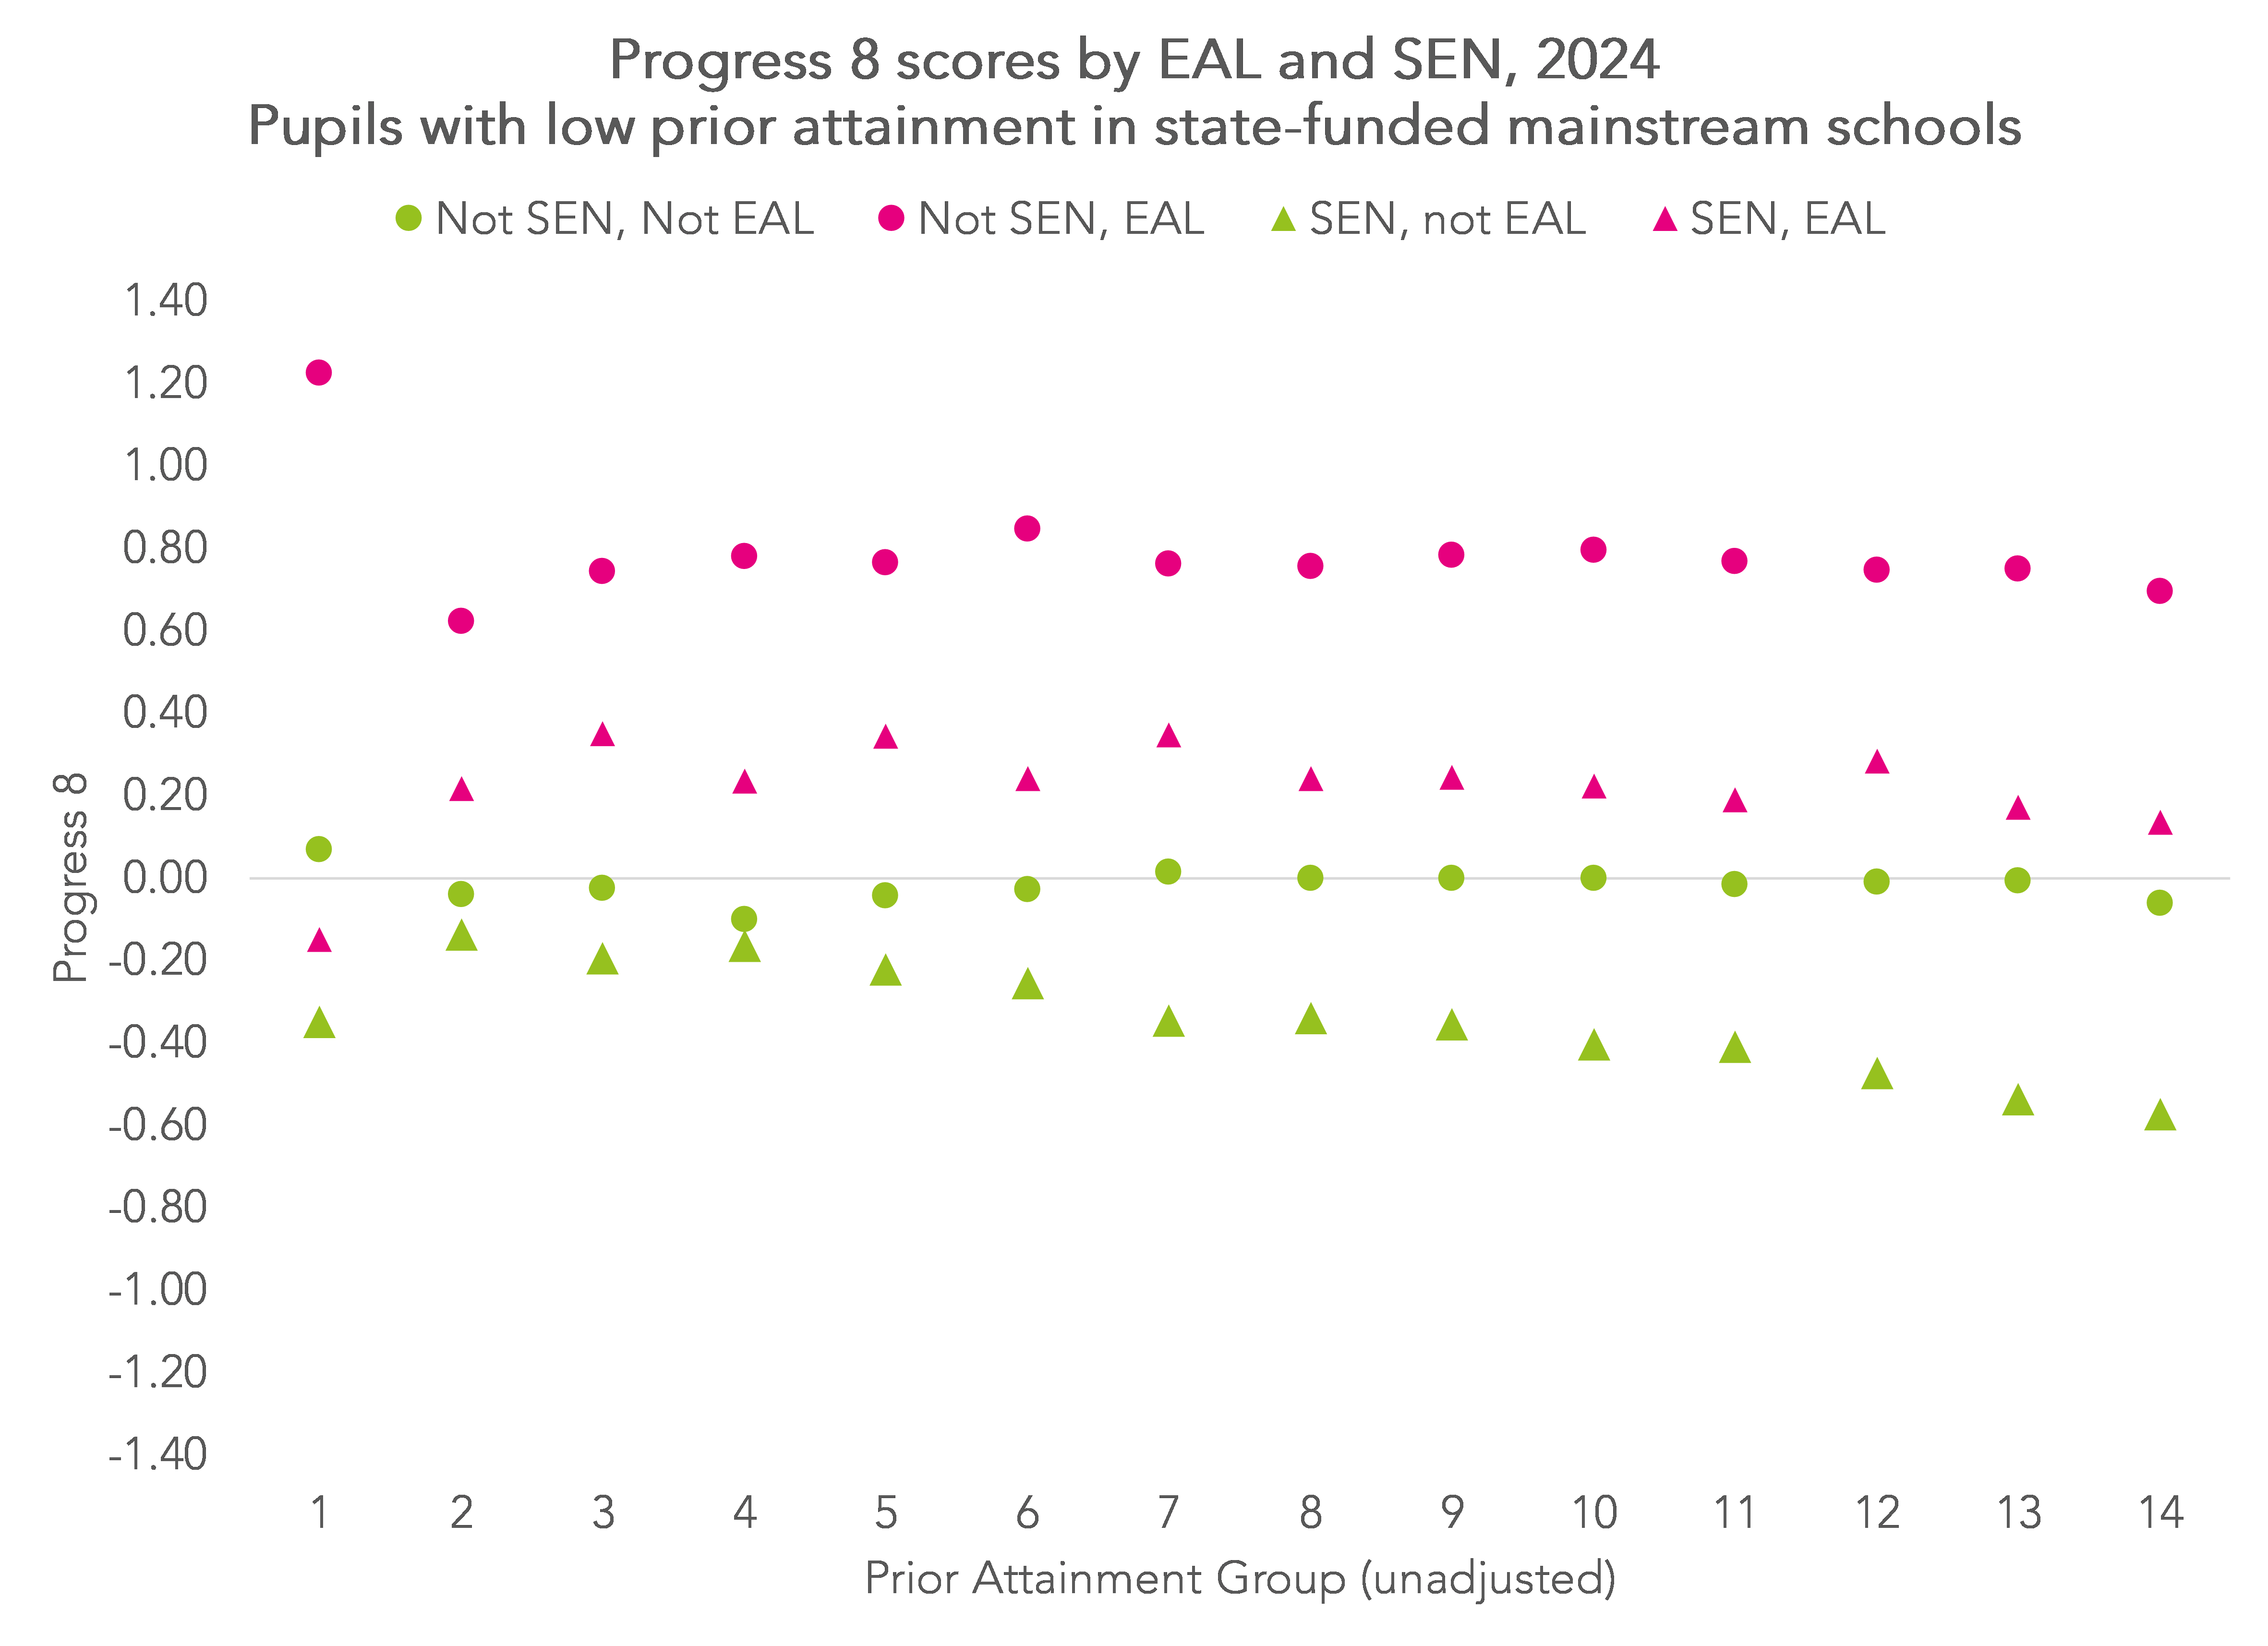
Across the PAGs, Progress 8 scores are highest among the “Not SEN, EAL” group and lowest among the “SEN, not EAL” group.
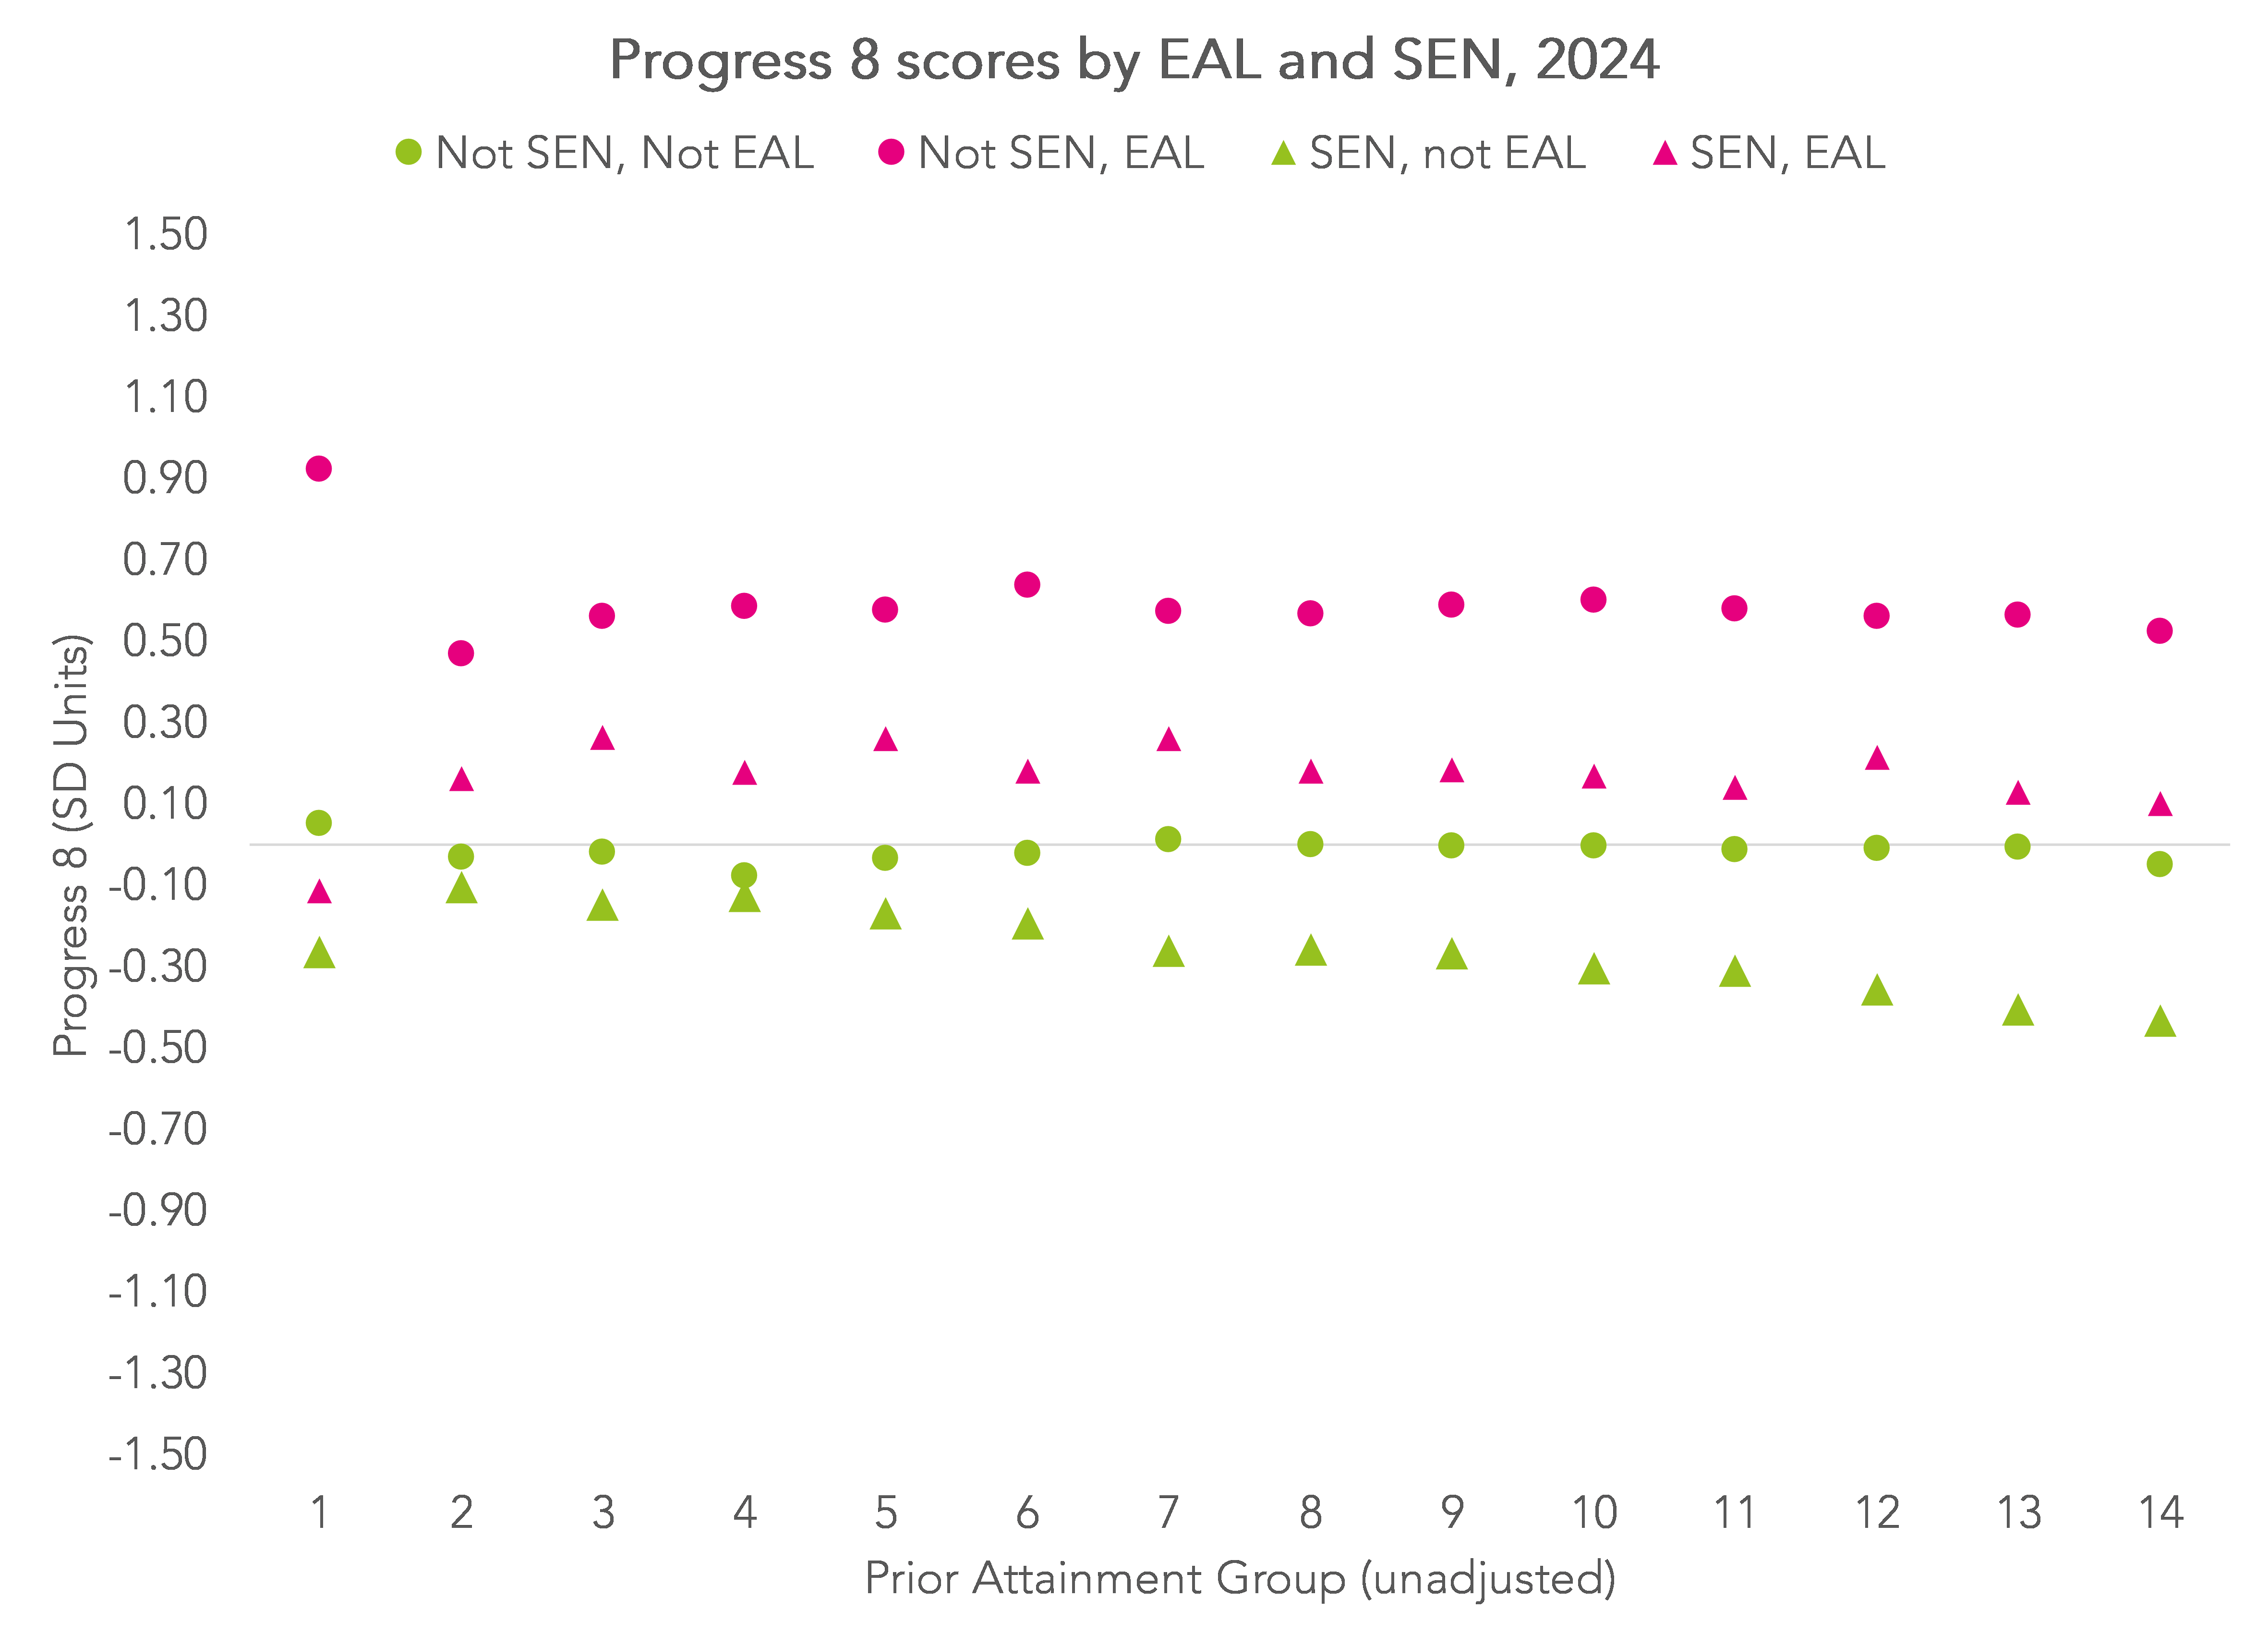
Because Progress 8 and “best-fit Progress” are measured on different scales, the results are not directly comparable. To produce a common scale we divide each measure by the standard deviation of each score for the LPA group.
Converting Progress 8 into standard deviation units produces the following chart.
Now let’s plot the “best-fit Progress” scores for those groups, again in standard deviation units. Note that here we are using adjusted prior attainment groups for EAL pupils.
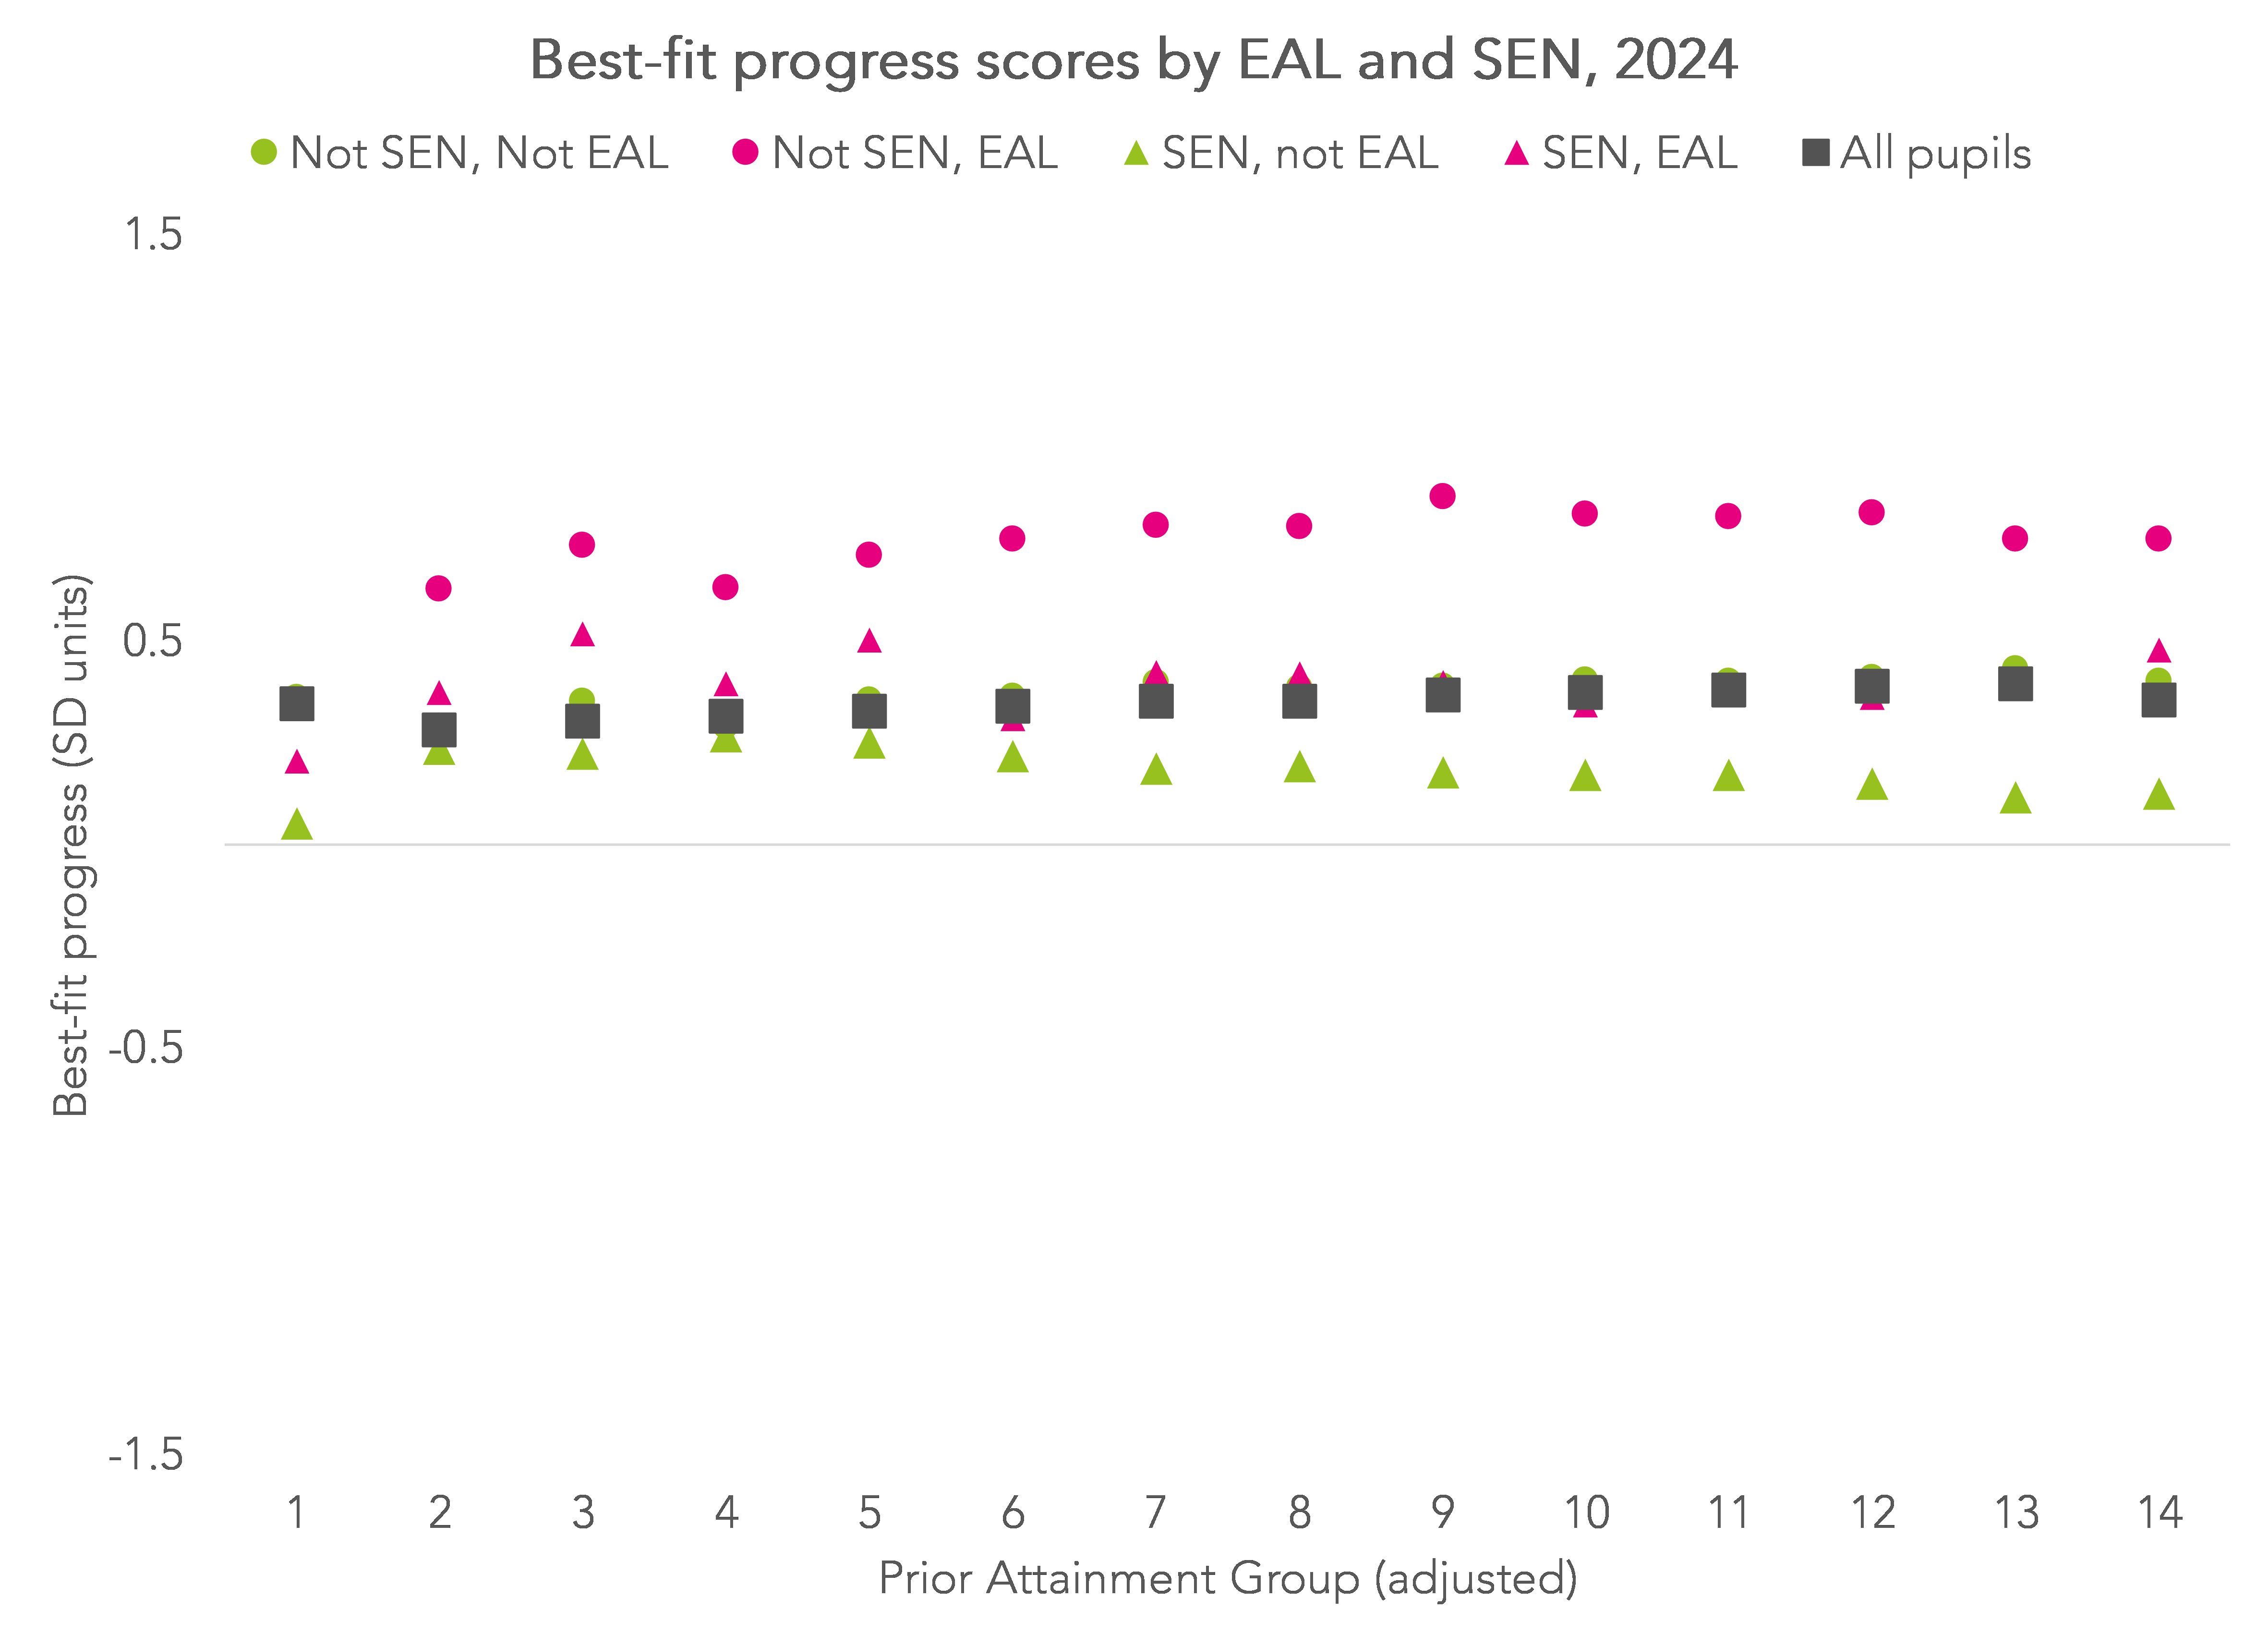
In general, the scores for the 4 groups come closer together but the progress scores for “Not SEN, EAL” pupils are still higher.
In addition, and unlike for Progress 8, the average progress score for each PAG does not equal zero. For each PAG, the average score is somewhere between 2 and 3 points.
At school level, we can compare the new measure to the existing Progress 8 score for LPA pupils. We do this just for schools with at least 5 pupils in the LPA group once we have made the adjustment to prior attainment groups for EAL pupils[3].
However, the correlation between the two school-level scores remains high (r=0.96). All that has happened is that the best-fit progress scores have tended to shift upwards.
This might be seen as producing little additional benefit given the additional complexity of the proposed best-fit measure compared to Progress 8.
Summing up
The proposed “best-fit” progress measure goes a little way to reducing differences in progress scores among pupils with low prior attainment but with different characteristics such as EAL and SEN. However, it does not eliminate differences completely.
There is also a slight risk that it might introduce a perverse incentive for schools to record EAL pupils as non-EAL pupils to avoid them being moved into a higher prior attainment group and therefore reducing their best-fit progress score. This could be alleviated by using EAL status from end of primary school rather than from Year 11. Note that this risk would not apply if no changes were made to how prior attainment groups were calculated for EAL pupils.
With their proposed measure, the DfE aim to better capture the progress of pupils for whom a Progress 8-aligned curriculum may not be suitable. Whether this can be achieved while P8 remains the main headline measure remains to be seen. In any case, it would seem that the best way of recognising differential rates of progress among pupils with different characteristics is to produce contextualised value added scores, such as those that we produce in FFT Aspire.
- Attainment 8 and Progress 8 are based on qualifications achieved in 8 subjects, with double weighting for English and maths
- We combine the SEN Support and EHC plan categories
- 5 pupils is the minimum threshold for publication in School Performance Tables
Want to stay up-to-date with the latest research from FFT Education Datalab? Sign up to Datalab’s mailing list to get notifications about new blogposts, or to receive the team’s half-termly newsletter.


Leave A Comment