Early analysis of 2018 Key Stage 4 results
Headline data from Aspire's KS4 Early Results Service.
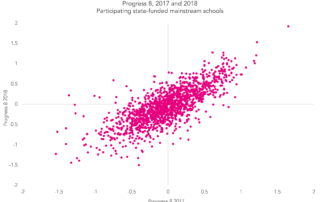
Headline data from Aspire's KS4 Early Results Service.

Looking in more detail at figures reported by the Times.

A look at the grades awarded at the top end of the scale.
The second of two preview posts ahead of this year's GCSE results day.
A detailed look at which pupils seem to have taken AS-Levels this year.
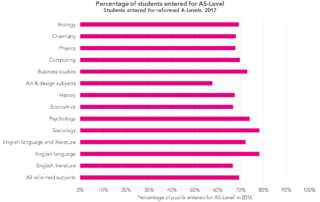
The second of two preview posts ahead of this year's A-Level results day.
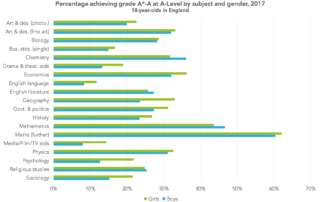
The first of two preview posts ahead of this year's A-Level results day.
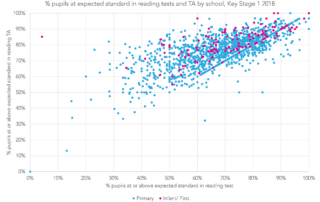
What we can learn from FFT's KS1 Early Results Service.

Looking at inspections since the introduction of Progress 8.