GCSE results 2018: How many grade 9s were awarded in the newly reformed subjects?
A look at the grades awarded at the top end of the scale.

A look at the grades awarded at the top end of the scale.
Our first look at this year’s data.
The second of two preview posts ahead of this year's GCSE results day.
The first of two preview posts ahead of this year's GCSE results day.
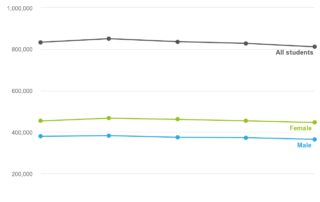
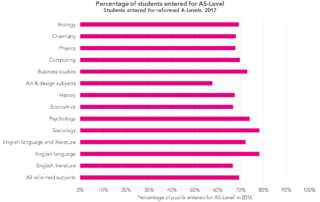
A detailed look at which pupils seem to have taken AS-Levels this year.
Our first look at this year’s data.
The second of two preview posts ahead of this year's A-Level results day.
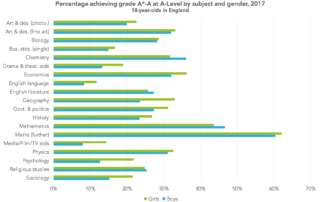
The first of two preview posts ahead of this year's A-Level results day.
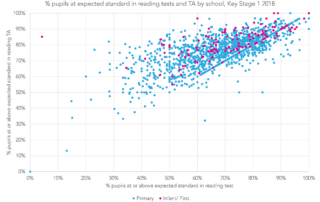
What we can learn from FFT's KS1 Early Results Service.