Why aren’t students choosing to study English and the arts at A-Level?: Part two
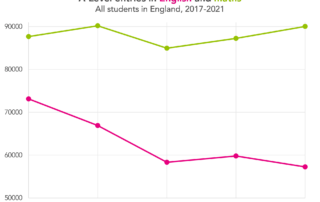
The second post in this series examining the fall in entries to A-Levels in English and the arts. This post focuses on the arts.

The second post in this series examining the fall in entries to A-Levels in English and the arts. This post focuses on the arts.
Part one of two posts examining the fall in entries to A-Levels in English and the arts. This post focuses on English.

Ofqual have decided on a stepped return to pre-pandemic grade distributions. We take a look at what that might mean in practice.
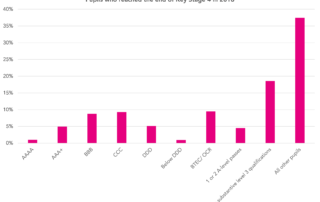
We present some data on achievement in A-levels and equivalent that might be useful to those thinking about a minimum entry threshold to higher education.

We explore trends in gender balance over the last five years.

Our analysis shows that combinations involving STEM subjects are enduringly popular
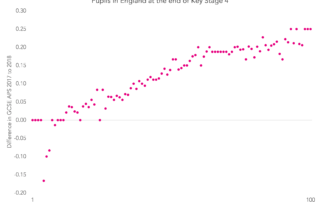
Be careful when using GCSE average point score to compare cohorts
What does equivalence look like following changes to vocational qualifications?

We looked at some of the main A-Level results trends this morning, and separately we have looked at how results changed in subjects that have been reformed (in brief: attainment fell slightly). But there are a couple of other interesting trends in grade distributions to be drawn out. Some specific subjects are seeing quite large [...]