Pupil absence in Autumn and Spring 2024/25
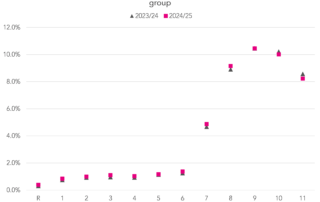
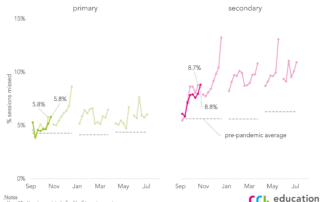
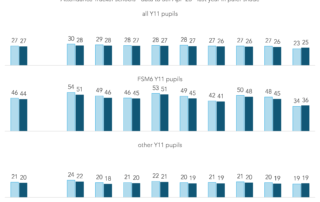
A summary of pupil attendance so far this year using data from our Attendance Tracker schools. Absence and persistent absence seem to have improved very slightly since last year, but remain above pre-pandemic levels.