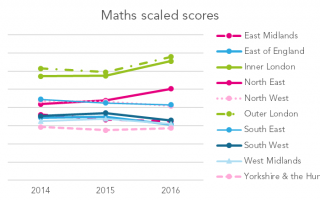
KS2 performance tables 2016: Primary schools in the North East are pulling away from the pack

A decade ago, the proportion of 11-year-olds reaching expected standards did not vary much across the regions - except for a little place with an unfixable education system called Inner London. The lines in blue on the chart below show that most regions had just over 70% of pupils meeting the expected standard at that [...]

By |2016-12-15T13:08:34+00:0015th December 2016|Exams and assessment, School accountability|

KS2 performance tables 2016: Do we need value added at Key Stage 2?

Value added data, calculated by a number of different methods over the years, has been a feature of school performance tables since 2003. In principle, the idea is sound. Comparisons of schools’ raw attainment measures often say more about schools’ intakes than they do about the quality of teaching and learning. So if the state [...]

KS2 performance tables 2016: What can we tell about the new floor standards?

Final Key Stage 2 data has been published this morning, with 665 primary schools identified as being below the floor standards, compared to 676 last year. In line with the move to scaled scores, the way floor standards are calculated changed this year. Schools were judged as being below the floor standard if they failed [...]

By |2018-09-27T17:51:43+01:0015th December 2016|Exams and assessment, School accountability|

Education Datalab’s view on primary assessment

We recently submitted evidence to the Education Select Committee, as part of their inquiry into primary assessment. What follows is the text of our submission. A PDF copy of the submission can be found here. The role of statutory assessment in primary schools Assessment plays numerous roles in primary education. Statutory assessment should, as a minimum, ensure [...]

By |2018-09-27T17:56:34+01:0013th December 2016|Exams and assessment|

Primary assessment inquiry – Education Datalab submission

Education Datalab recently contributed evidence to the Education Select Committee's inquiry into primary assessment. Among the points made by Datalab are that: using assessment for curriculum compliance must be done with care; we need a reliable age five baseline assessment; teacher assessment should not be used in statutory assessment; a simpler floor standard would be fairer and [...]

By |2017-10-23T13:09:58+01:0013th December 2016|Exams and assessment, Reports|

‘Schools that work for everyone’ consultation – Education Datalab response

Education Datalab has today submitted its response to the government’s Schools that work for everyone consultation. The green paper consulted on: the identification of those families who are ‘just about managing’; the contribution which independent schools can make to the state sector; conditions that should be met if existing selective schools are to be allowed [...]

By |2017-10-23T13:09:49+01:0012th December 2016|Pupil demographics, Reports, Structures|

Qualification neutral Progress 8

One criticism of the current Progress 8 measure is that the points awarded to some qualifications are more (or less) favourable than to others. There is a risk that any inequality in the way different qualifications are valued incentivises schools to pursue those treated more favourably at the expense of working to improve grades awarded [...]

By |2017-10-23T13:08:55+01:007th December 2016|Exams and assessment, School accountability|

The 10 key findings from PISA 2015

Today, the Organisation for Economic Co-Operation and Development releases results from the 2015 round of the Programme for International Student Assessment (PISA). Despite the ‘country rankings’ taking the headlines, there are many other - and often more interesting - findings once you scratch below the surface. In this blogpost, I provide a crash-course in 10 [...]

By |2018-11-09T16:53:37+00:006th December 2016|Exams and assessment|

Social and ethnic inequalities in choice available and choices made at age 16

This morning the Social Mobility Commission published our research examining the choice of courses and institution made by students at age 16. We could see there were differences in the choices made by social background, ethnicity and gender of the student and wanted to measure the extent to which these arose through differences in: GCSE [...]

By |2017-04-21T22:27:17+01:005th December 2016|Admissions, Post-16 provision, Pupil demographics, Reports|
Go to Top