Over the last few weeks, there has been much debate about whether Ofsted inspection judgments are biased against schools with large proportions of disadvantaged white British pupils. This has included a blogpost by Stephen Tierney, a response from Ofsted, and a further blogpost from Jason Bradbury and Sean Harford at Ofsted.
In short, schools with such intakes are less likely to be judged good or outstanding. Ofsted argues that this is because the quality of education in such schools tends to be poorer, pointing to various bits of research that shows, among other things, that schools in less affluent areas struggle to recruit and retain suitably qualified staff.
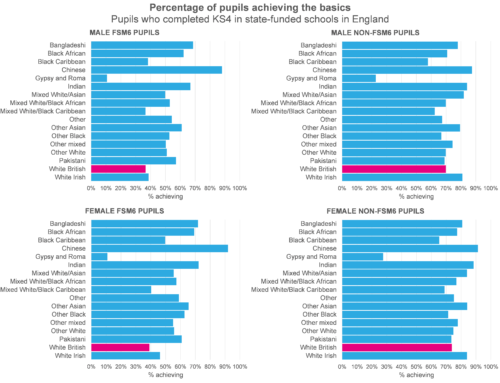
This argument seems to ignore the fact that, as we showed in this blogpost, some groups of pupils tend to achieve lower Progress 8 scores than others, regardless of the type of school they go to. A pupil’s attainment at Key Stage 4 is more than a function of prior attainment and secondary school quality. What happens at home matters too and I am not sure if I have ever seen Ofsted address if (and indeed how) they take account of less supportive home environments when inspecting schools.
In addition, school leaders are concerned that the current “headline” metric of performance, Progress 8, is also biased against schools serving disadvantaged intakes, particularly those with relatively few pupils speaking English as an additional language. This measure has been available for use in inspections since around October 2016.
In its blogpost, Ofsted attempts to break the link between Progress 8, inspection judgments and disadvantage by showing that outstanding schools with disadvantaged intakes tend to have lower Progress 8 scores than outstanding schools with more advantaged intakes. They claim that this shows that inspectors are able to look beyond Progress 8 when making judgments.
However, the analysis uses the most recent inspection judgment for a school, which may have taken place many years ago in some cases, well before Progress 8 was introduced.
What about if we just look at inspections since Progress 8 was introduced in Autumn 2016?
I’ve pulled together a dataset of secondary school inspections from September 2016 to April 2018 using published Ofsted inspection outcome data. In theory, Progress 8 data would be available for these inspections (barring some of those prior to November 2016). I have not included inspection data for any schools which did not have any previous KS4 performance data due to being new schools.
As we know, the probability that a school will be inspected is not random. Some schools (such as those judged outstanding) are very unlikely to be inspected unless Ofsted’s risk assessment process identifies concerns about performance. Those already in a category are certain to be re-inspected.
I’m going to focus just on those schools inspected under Section 5 or which received a short inspection so we can see more clearly the relationship between Progress 8 scores and recent inspection judgments, specifically being classified as requires improvement or inadequate. I also leave to one side the fact that 2016 and 2017 Progress 8 scores are not directly comparable as a result of the introduction of 9-1 grades.
Between September 2016 and April 2018 there were 1405 Section 5 or short inspections of secondary schools with a Progress 8 score at the time of inspection. Over a third of the inspections resulted in an overall judgment of requires improvement or inadequate. 232 schools had achieved a Progress 8 score below -0.41 (below or close to the floor standard) in the year prior to inspection, and 90% of those were classified as RI/I.

Progress 8 doesn’t predict inspection outcomes with certainty, of course, a small proportion of schools with P8 scores of -0.05 or higher at the time of inspection were classified as requires improvement or inadequate. But a score below -0.41, with a few exceptions, results in going into RI/I.
The risk of achieving such a low P8 score is higher among the most disadvantaged schools with lower proportions of pupils with English as an additional language (EAL).
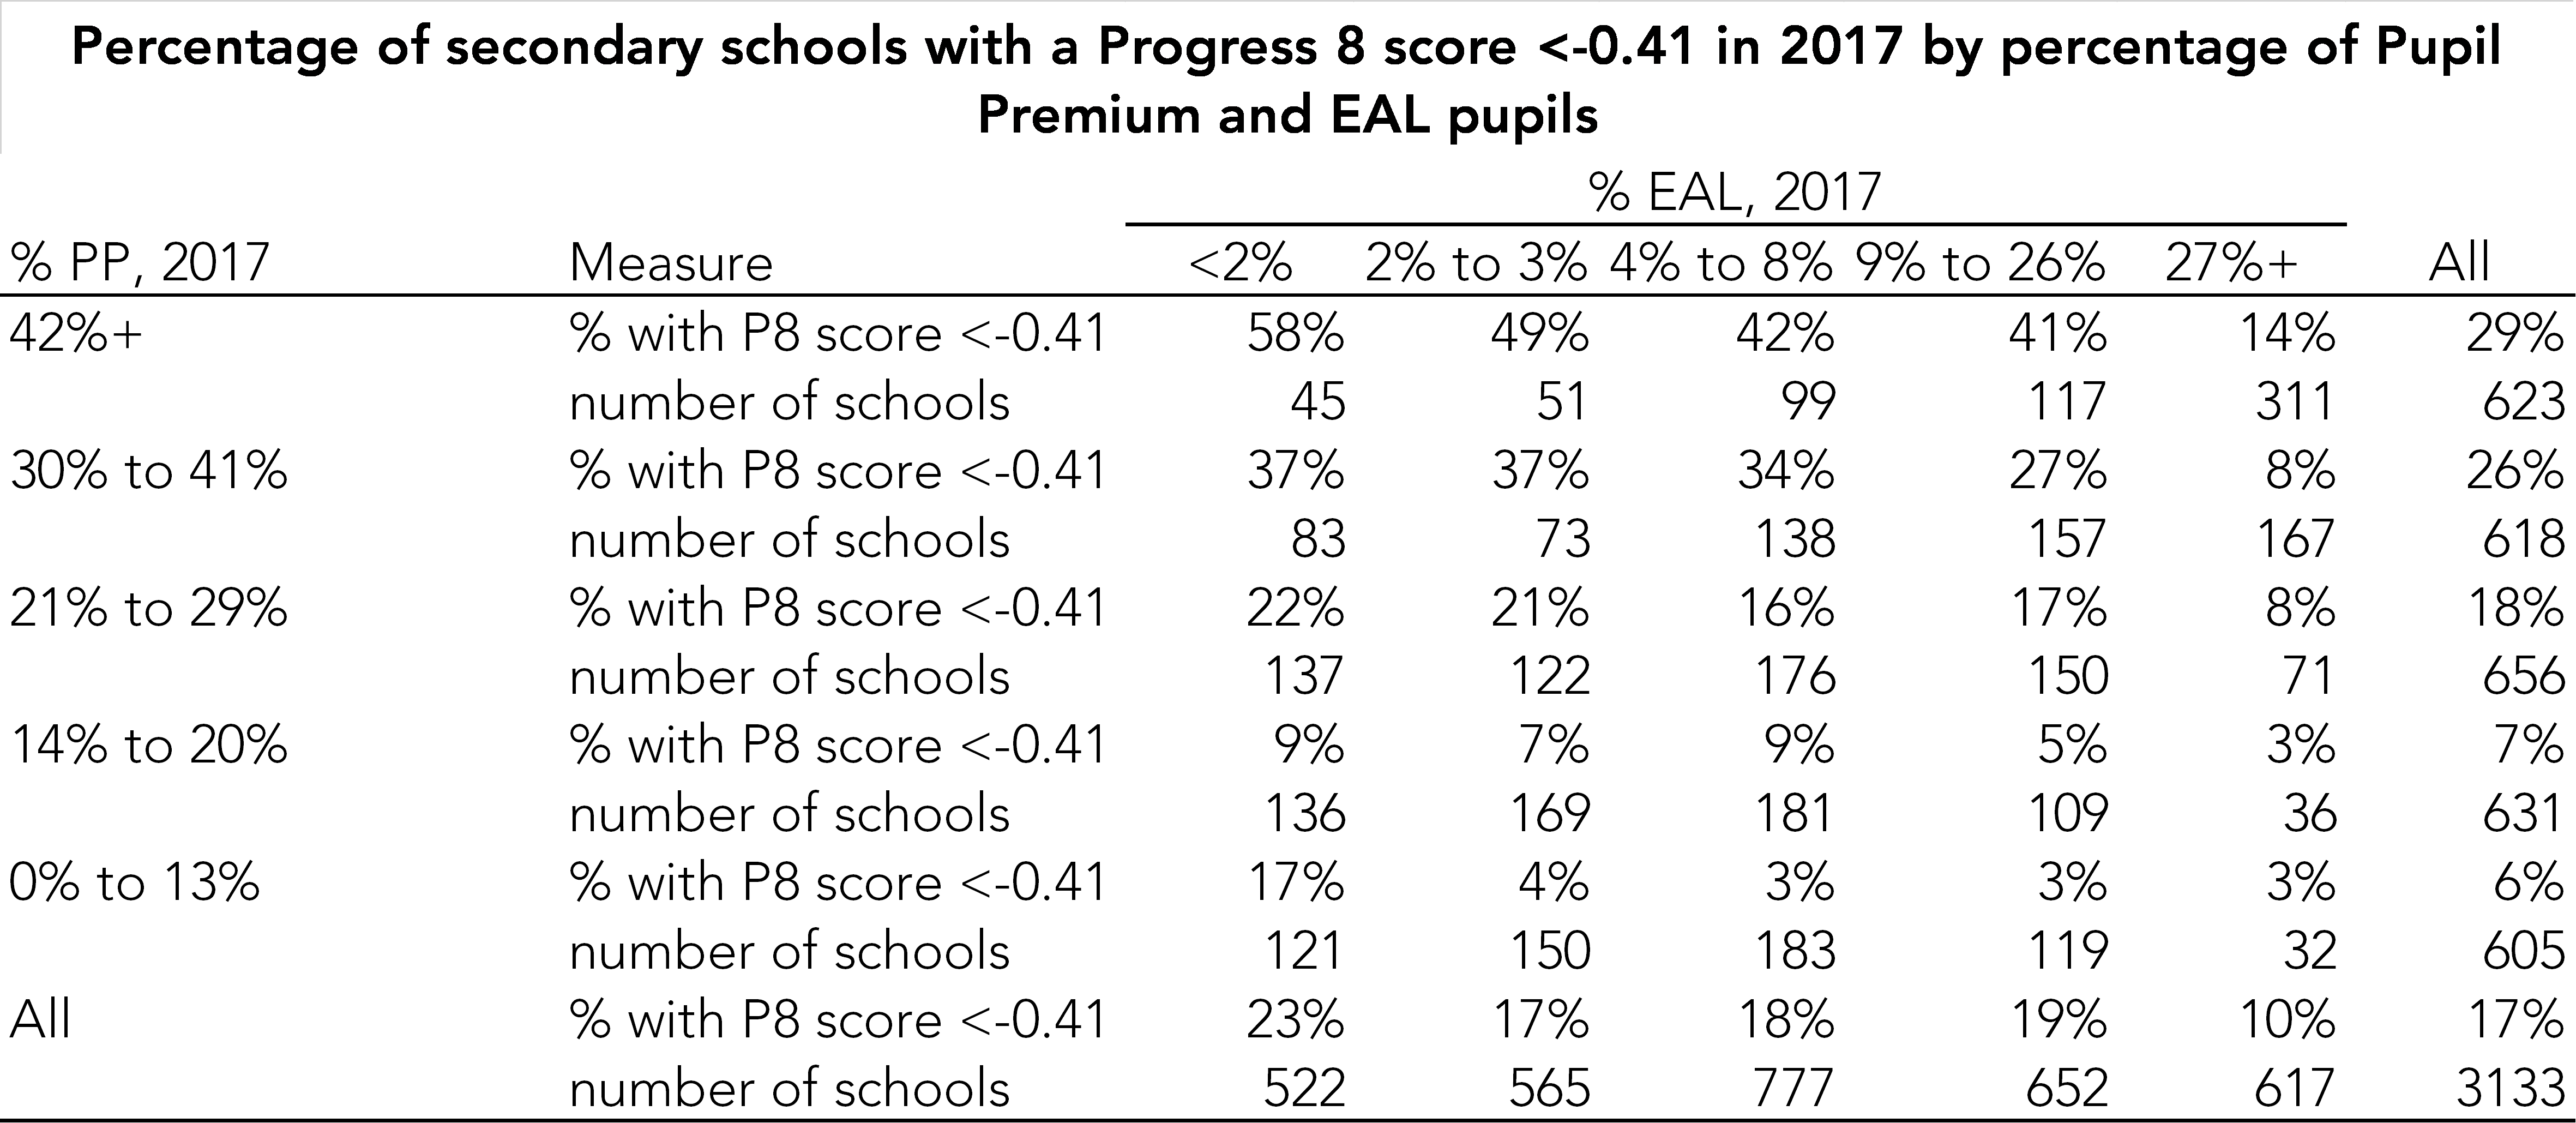
So on the surface, it looks like Progress 8 is systematically biased against schools with disadvantaged intakes and this in turn leads (in some part at least) to poor Ofsted outcomes.
But what if we take a longer view?
Surely schools with disadvantaged intakes have always tended to receive poorer Ofsted outcomes than other schools? (Though this may have been less the case in the days of contextualised value added).
Let’s take a longer view by looking at inspections in each academic year from 2014/15 onwards. I only include schools that can be linked to Key Stage 4 performance data from the previous academic year, i.e. not including new schools and secondary-deemed middle schools.
The current inspection framework was introduced in 2015/16, so the analysis covers two frameworks. For inspections under the current framework I again only include Section 5 inspections and short inspections that do not convert.
The table below shows the percentage of schools inspected in each academic year judged as requiring improvement or inadequate. Schools have been banded into quintiles based on the percentage of disadvantaged pupils in Year 11 in the previous academic year. The first table shows how things have changed for all schools that have been inspected, the second just shows those schools with fewer than 6% EAL pupils.
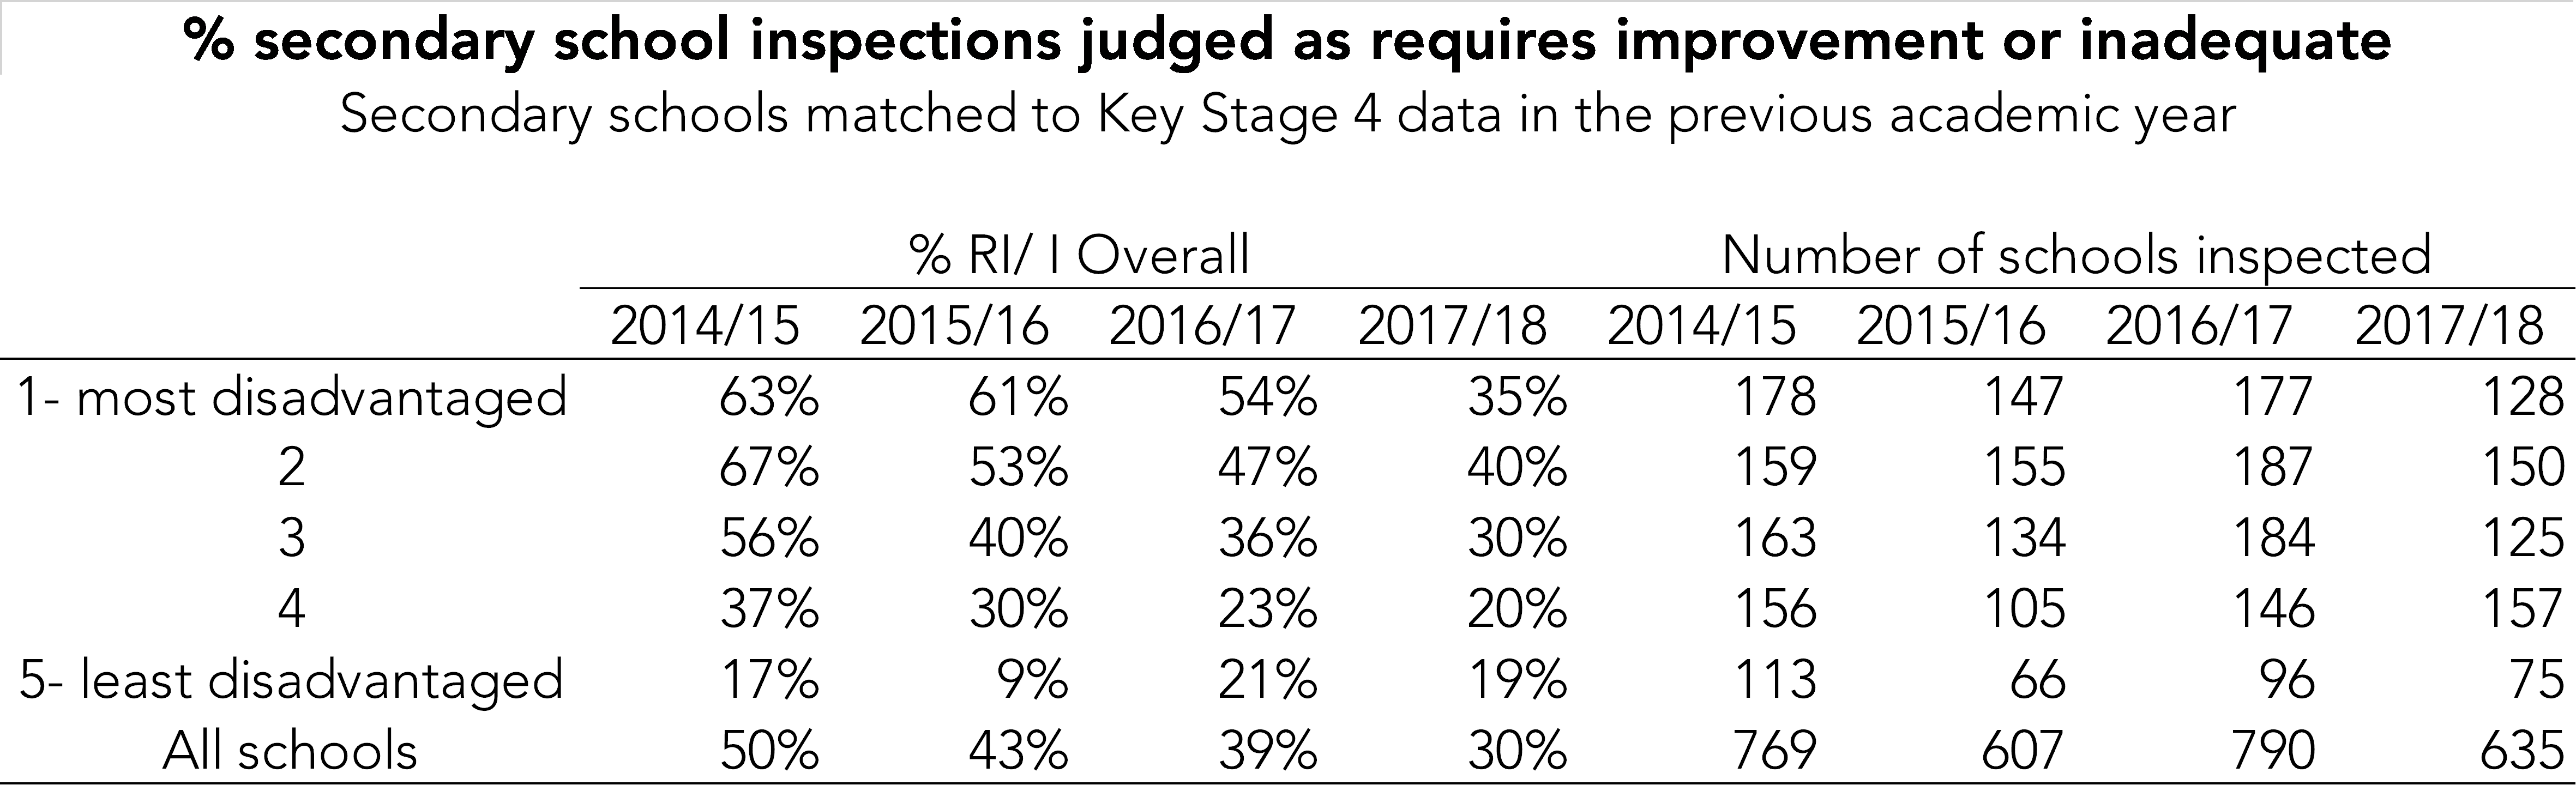
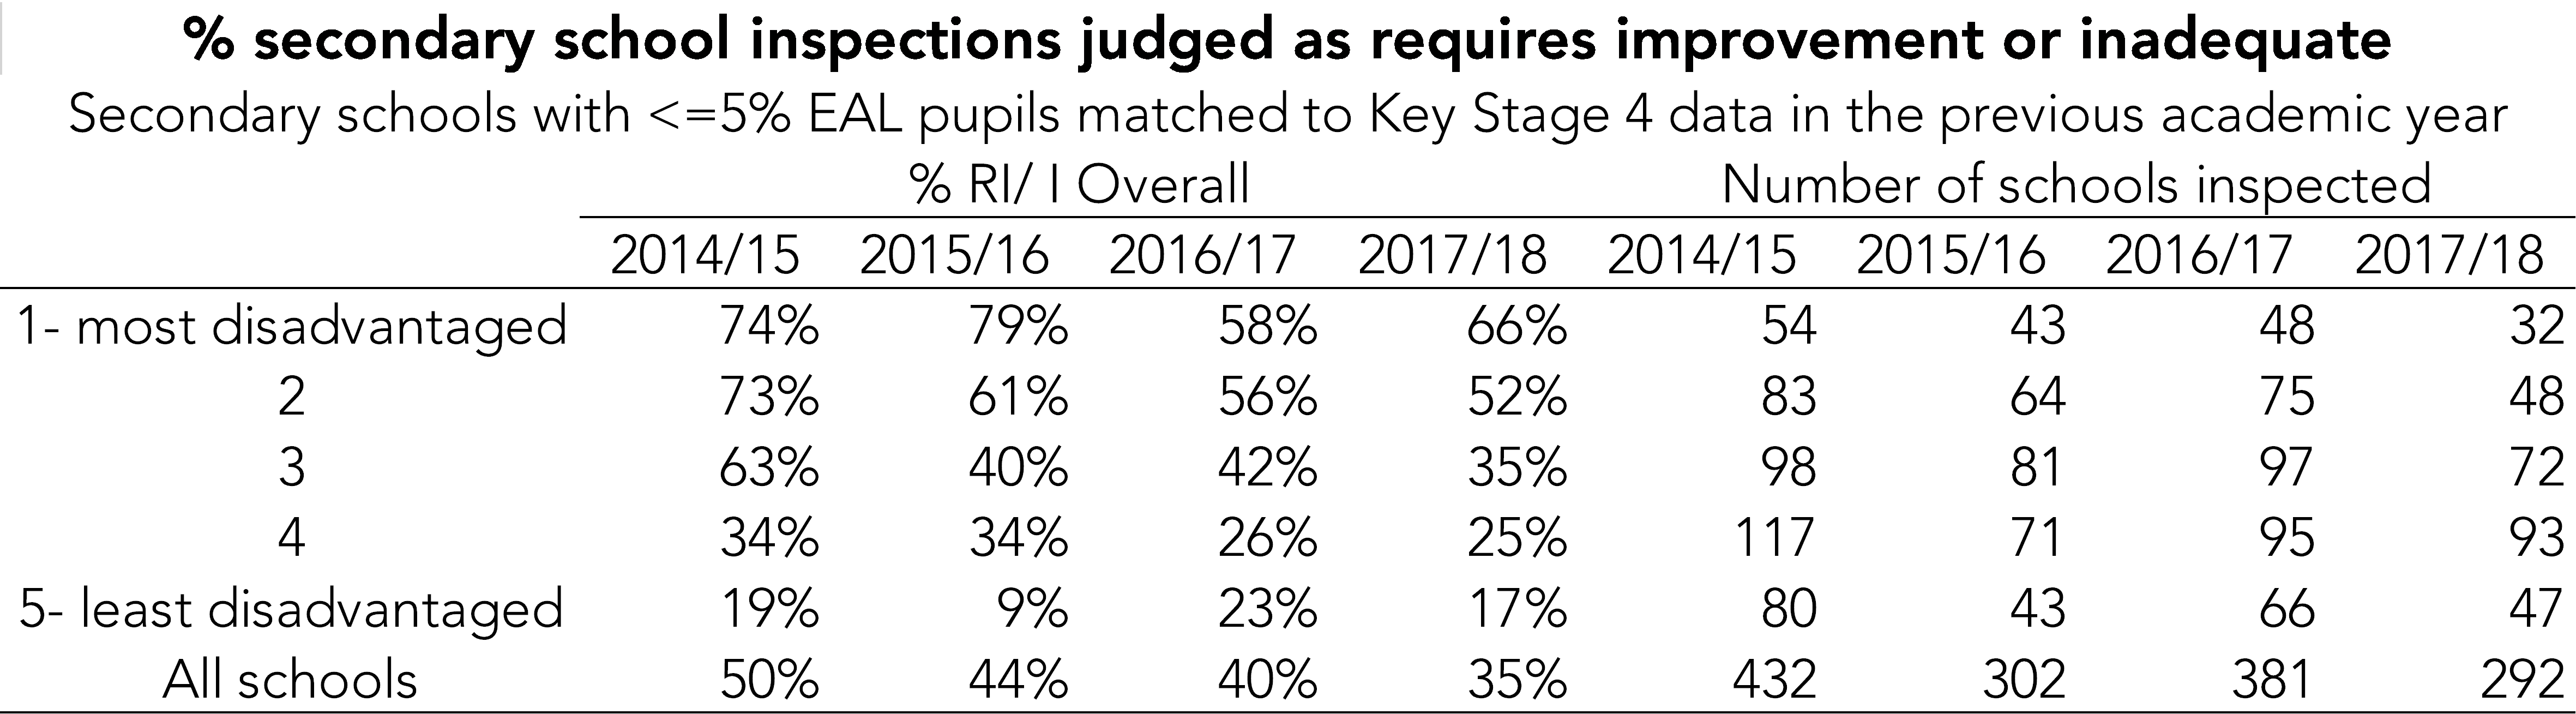
Proportionately fewer inspections now result in schools receiving judgments of requires improvement or inadequate. The most disadvantaged schools are now more likely than in the recent past to be judged good or better if they are inspected, although the difference if much less pronounced for disadvantaged schools with low proportions of EAL pupils.
So Progress 8 is a bit of a red herring here. Even prior to its introduction, disadvantaged schools with low proportions of EAL pupils tended to get worse inspection outcomes. These schools will need to be reassured that the inspection framework, including the new one due in September 2019, recognises the system-wide issue that some demographic groups of pupils do not achieve as well as others.
Want to stay up-to-date with the latest research from FFT Education Datalab? Sign up to Datalab’s mailing list to get notifications about new blogposts, or to receive the team’s half-termly newsletter.
Leave A Comment