Almost four years ago, I wrote a blogpost about whether disadvantaged pupils in coastal schools really did make less progress than similar pupils in similar schools away from the coast.
The answer seemed to be no: the low progress scores for schools in coastal areas were probably due to demography rather than geography.
Unusually, I jumped off the fence and ventured a prediction at the end:
How did that prediction turn out?
In order to find out, we have to do some data crunching. This is because the calculation of Progress 8 has changed since 2016.[1] This analysis recalculates P8 for 2016 using the 2017 rules, and uses the same rules to calculate P8 scores for 2014 and 2015.
Coastal schools
Coastal schools are defined here as in the previous post – those located within 5.5km of the coast. There were 510 with published KS4 data each year from 2014 to 2016, increasing to 518 in 2017 and then 523 in 2018.
However, the number of pupils included in the P8 measure at a coastal school fell from 89,000 in 2014 to 79,000 in 2018. Expressed as a percentage of all P8 pupils in state-funded mainstream schools these figures represent 17.0% and 16.2% respectively.
Between 26% and 27% of pupils at coastal schools are classified as disadvantaged, i.e. eligible for free school meals at some point between Year 6 and Year 11; the same percentage as at other schools.
Progress 8 scores
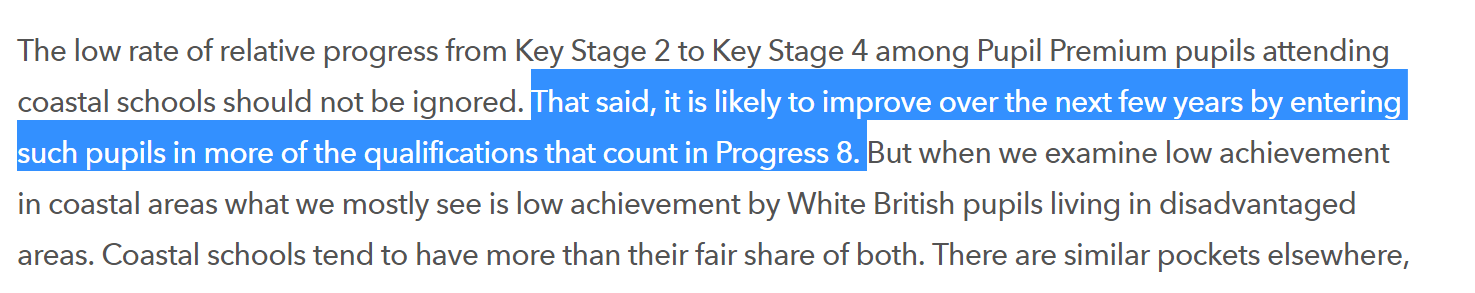
Progress 8 among coastal schools improved (but remained negative overall) between 2014 and 2016 as entries in qualifications that count in Attainment 8 increased.
However, since the introduction of reformed GCSEs, P8 scores have started to decline, as the chart below shows.
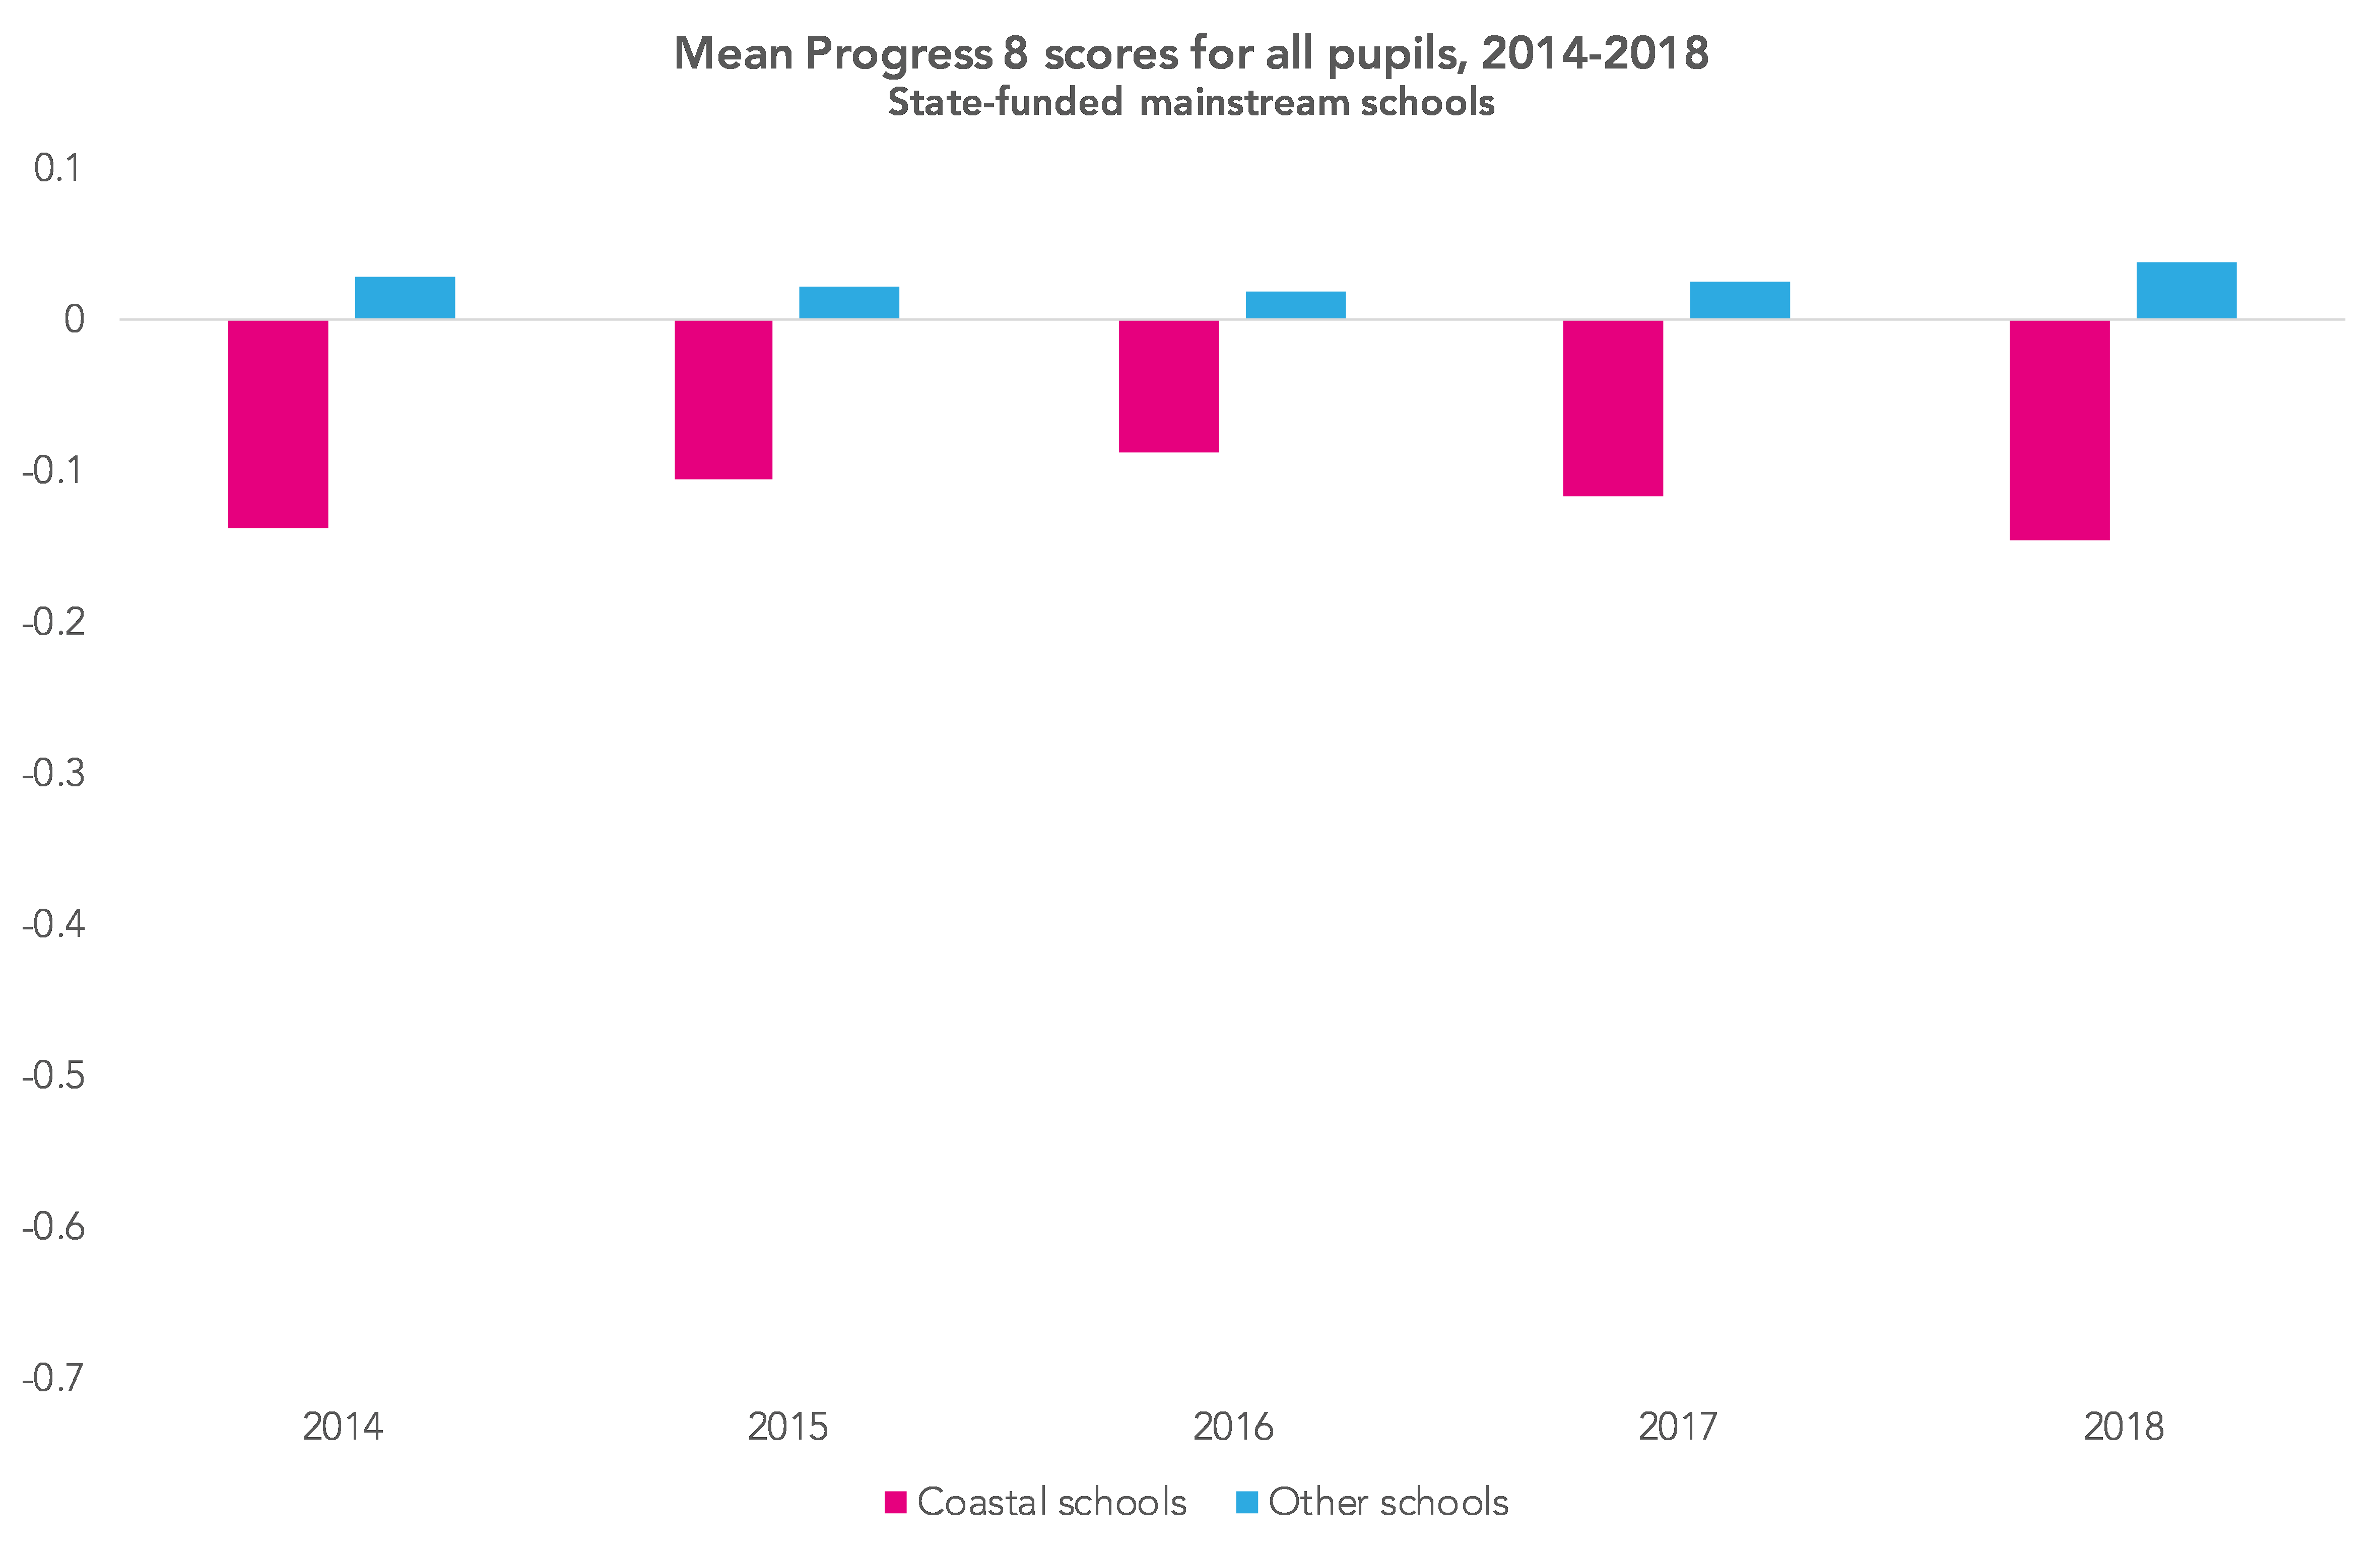
The pattern for disadvantaged pupils is similar to that for all pupils.
Between 2014 and 2016, P8 scores improved by a greater margin in coastal schools than in other schools. The number of filled P8 ‘slots’ increased from 8.4 to 9.2 in coastal schools (an increase of 0.8) compared to an increase from 8.7 to 9.3 in other schools (an increase of 0.6).
However, from 2016, P8 then deteriorated at a faster rate in coastal schools, as can be seen below. We’re not talking a huge difference: a change of 0.1 is equivalent to one grade lower per pupil in one of the ten slots of Attainment 8 (including double-counted English and maths).
In particular, disadvantaged pupils in coastal schools have been disproportionately affected by a) reforms to GCSE English and b) the removal of the European Computer Driving Licence (ECDL) from the open slots.
First of all, English. Between 2016 and 2018, the P8 score for disadvantaged pupils in coastal schools fell by more than 0.2, equivalent to a fifth of a grade. Disadvantaged pupils in other schools appear, on the surface, to have been less affected.

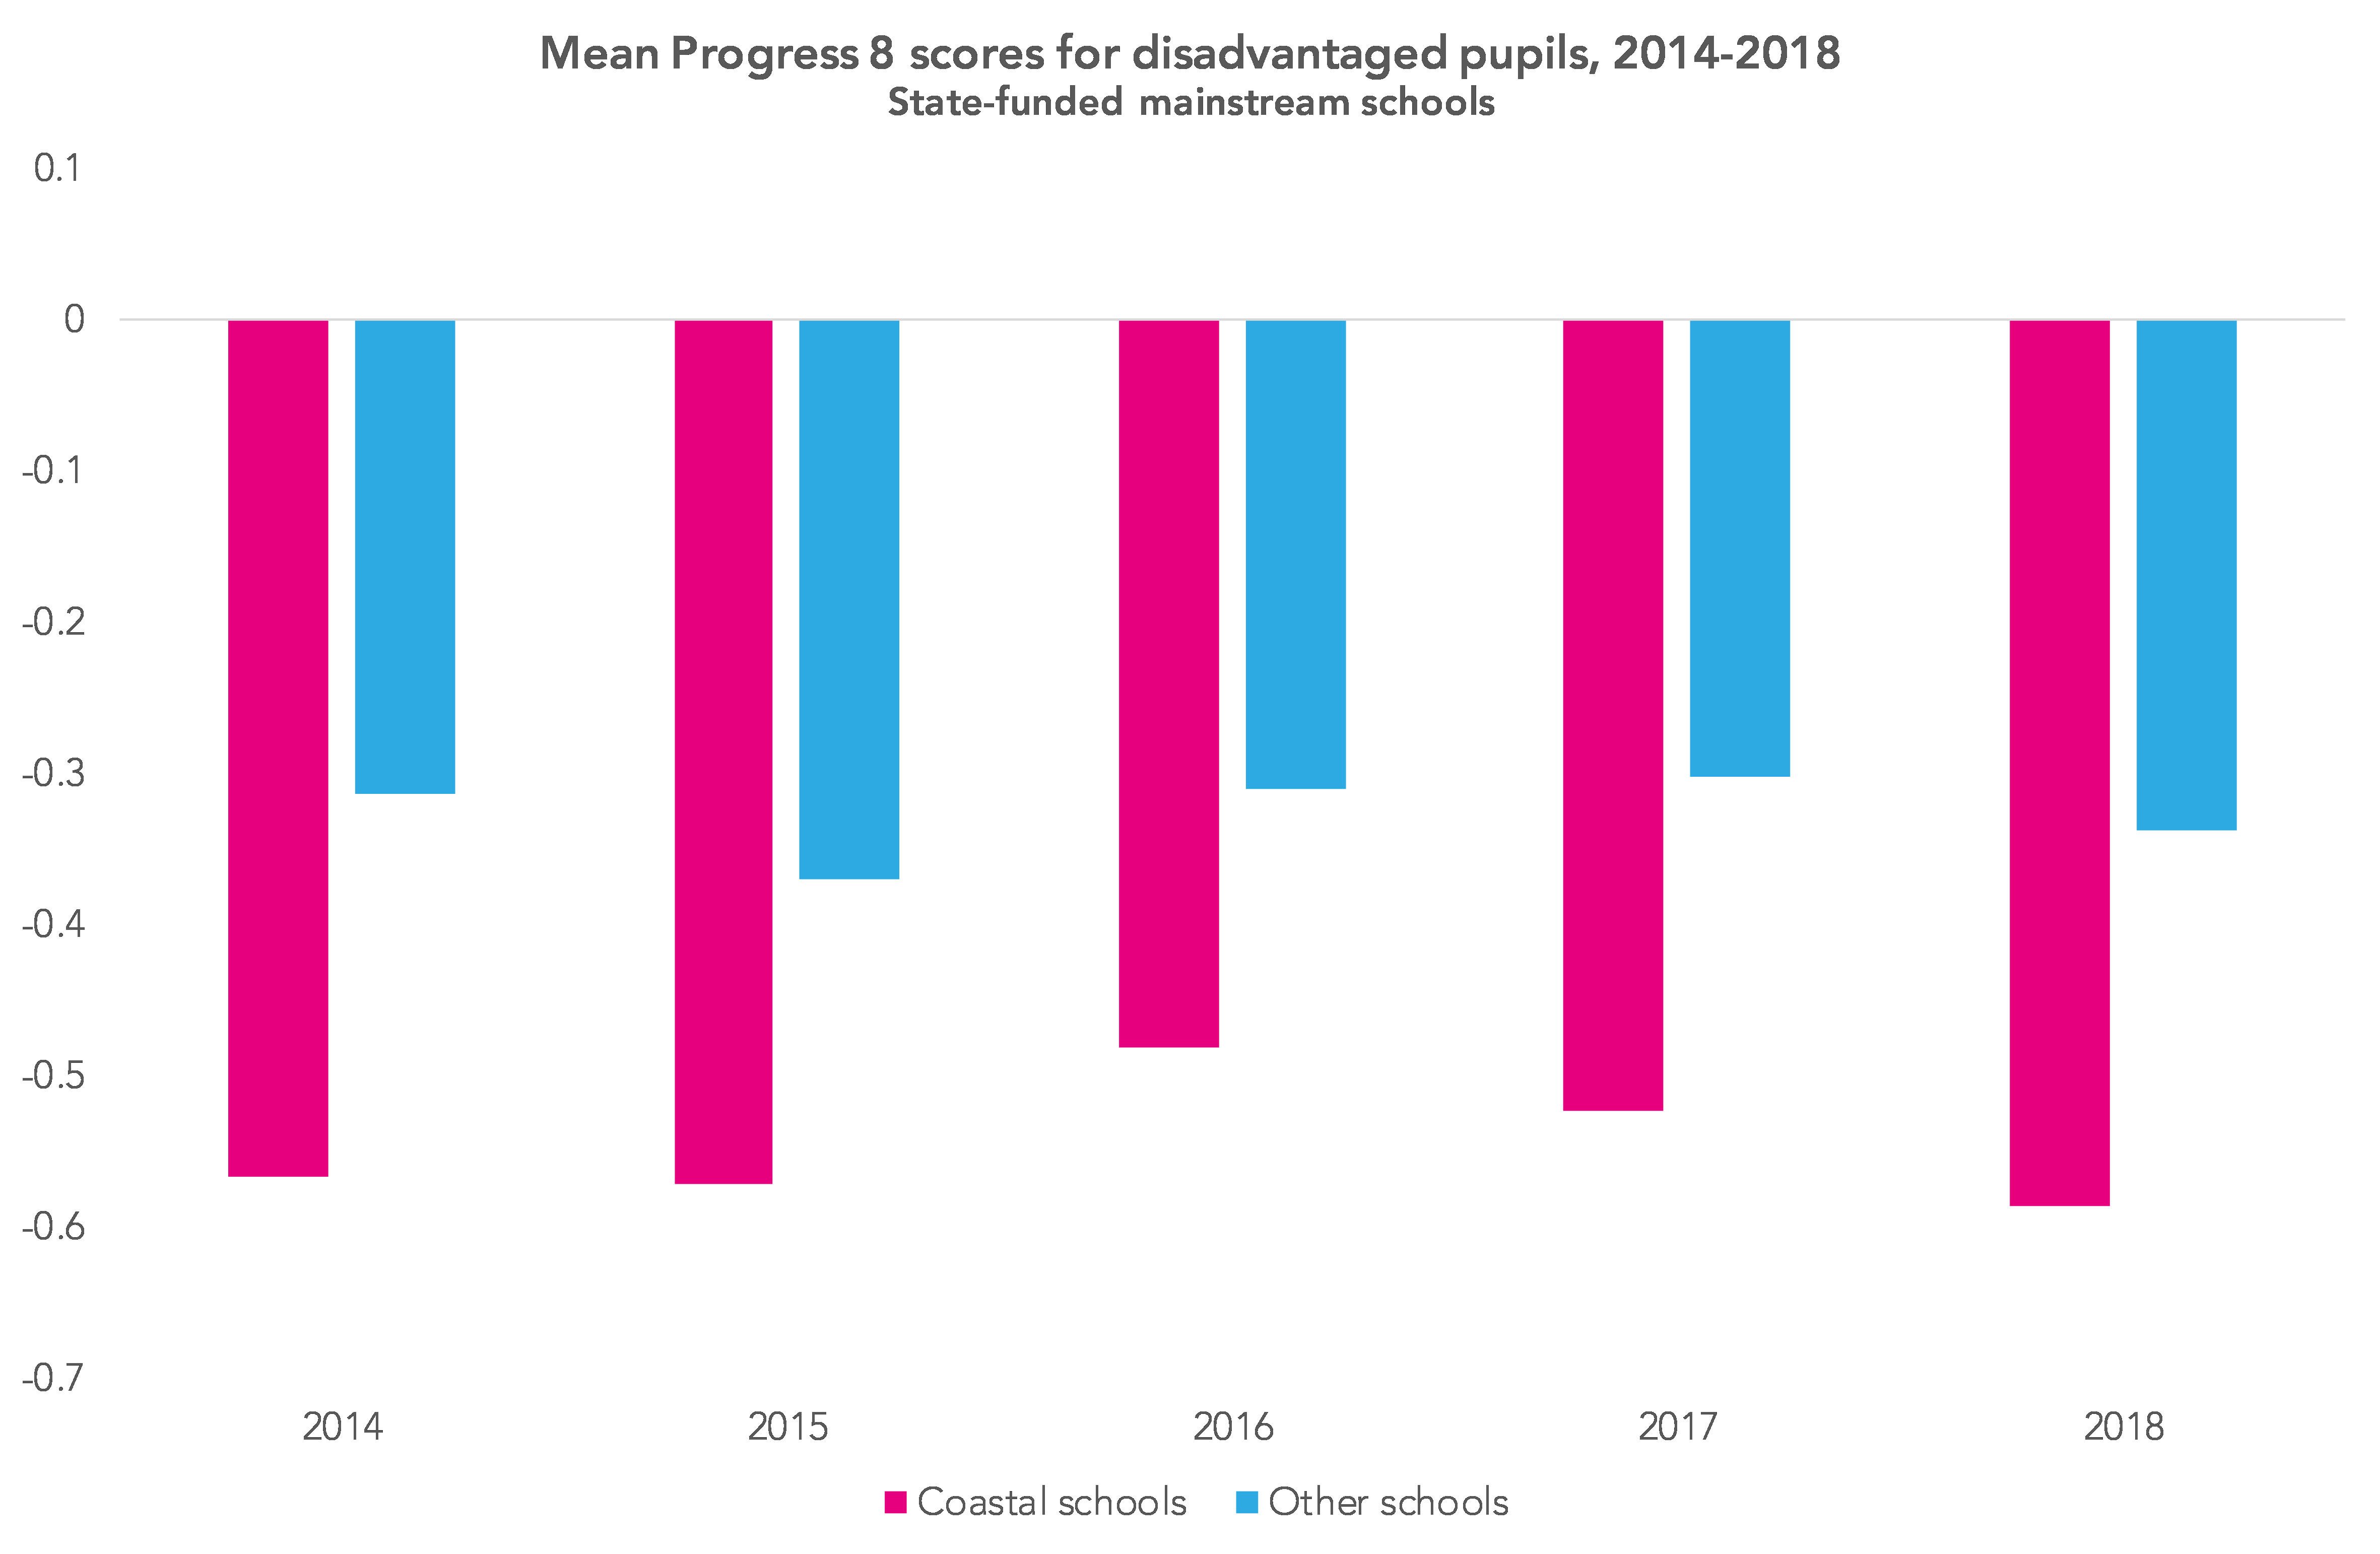
Secondly, ECDL. Like in English, P8 in the ‘open’ slots for disadvantaged pupils in coastal schools also fell by more than 0.2 between 2016 and 2018, although in this case all the decline took place between 2017 and 2018. In total, 43% of disadvantaged pupils in coastal schools were entered for ECDL in 2017 compared to 32% of those in other schools.
P8 scores for the maths and EBacc slots fell only marginally (around -0.05) between 2016 and 2018 for disadvantaged pupils in coastal schools.
Summing up
So, disadvantaged pupils in coastal schools have been disproportionately affected by GCSE reforms, particularly in English, and by the removal of ECDL from the calculation of Attainment 8 and Progress 8.
At this point, I might tentatively put forward another hypothesis. These differences may well be related to differences in characteristics among disadvantaged pupils in coastal schools compared to other schools. For example, over 90% in coastal schools are from what we have called “high impact” disadvantaged groups[2] – those for whom the impact of disadvantage appears to be greater than for some other groups – compared to 65% in other schools. We’ll be doing more on this in the coming months.
Want to stay up-to-date with the latest research from FFT Education Datalab? Sign up to Datalab’s mailing list to get notifications about new blogposts, or to receive the team’s half-termly newsletter.
1. Firstly, reformed GCSEs began to be introduced in 2017, which resulted in a different points scale for legacy GCSEs.
Secondly, the measure of prior attainment also changed. Whereas in 2016 it was based on the average result in Key Stage 2 English and maths, in 2017 it was based on reading and maths. (The nature of Key Stage 2 tests changed in 2012 when almost all of the 2017 Key Stage 4 cohort would have been assessed. Previously, an overall score for English was calculated based on separate tests in reading and writing. The test in writing was discontinued after 2011.)
2. White British, white Irish, Gypsy/Roma, Traveller of Irish Heritage, black Caribbean, mixed white/black Caribbean.


Is 5.5km from the coast the ‘official’ definition of a coastal school? Thanks.
Hi Bill. Not sure there is such thing as an official definition. I chose 5.5km for no other reason that it included all the schools on the Isle of Wight.